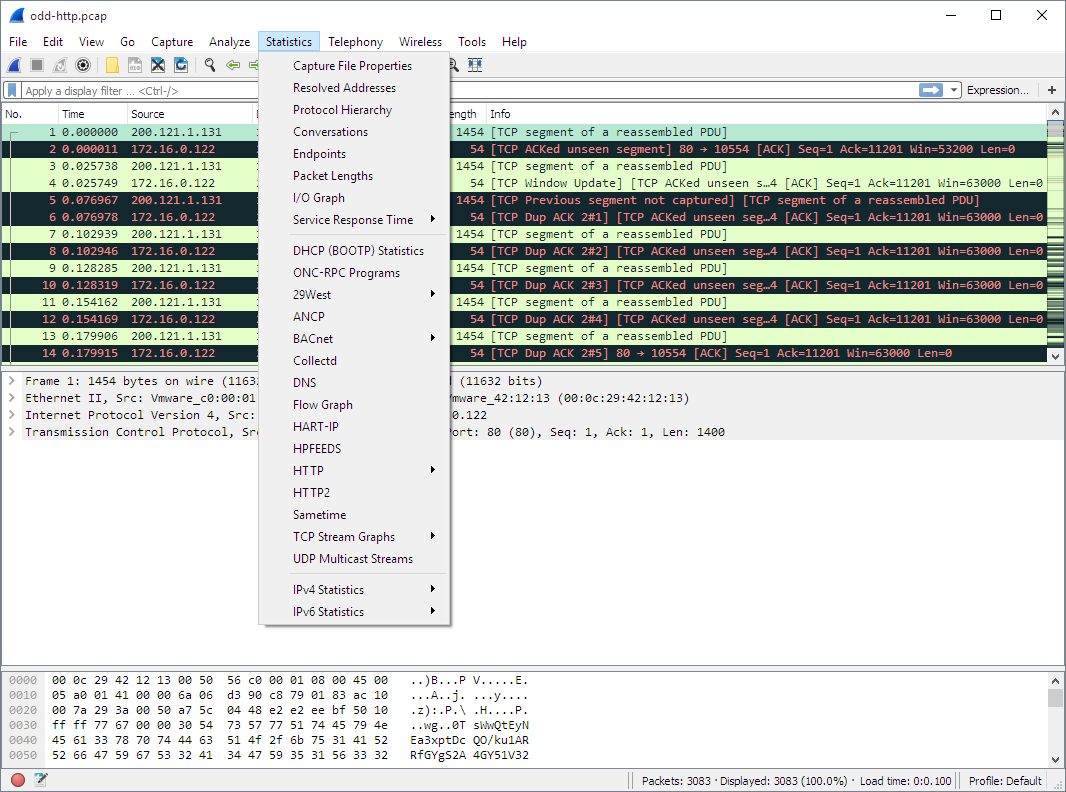
The Wireshark Statistics menu contains the fields shown in Table 3.9, “Statistics menu items”.
Each menu item brings up a new window showing specific statistics.
Table 3.9. Statistics menu items
| Menu Item | Accelerator | Description |
|---|---|---|
Show information about the capture file, see Section 8.2, “The “Capture File Properties” Dialog”. | ||
Display a hierarchical tree of protocol statistics, see Section 8.4, “The “Protocol Hierarchy” Window”. | ||
Display a list of conversations (traffic between two endpoints), see Section 8.5.1, “The “Conversations” Window”. | ||
Display a list of endpoints (traffic to/from an address), see Section 8.6.1, “The “Endpoints” Window”. | ||
Display user specified graphs (e.g., the number of packets in the course of time), see Section 8.8, “The “I/O Graphs” Window”. | ||
Plot display filter field values over time, see Section 8.9, “The “Plots” Window”. | ||
Display the time between a request and the corresponding response, see Section 8.10, “Service Response Time”. | ||
HTTP request/response statistics, see Section 8.22, “HTTP Statistics” | ||
