A network endpoint is the logical endpoint of separate protocol traffic of a specific protocol layer. The endpoint statistics of Wireshark will take the following endpoints into account:
![[Tip]](images/tip.svg) | Tip |
|---|---|
|
If you are looking for a feature other network tools call a hostlist, here is the right place to look. The list of Ethernet or IP endpoints is usually what you’re looking for. |
Endpoint and Conversation types
- Bluetooth
- A MAC-48 address similar to Ethernet.
- Ethernet
- Identical to the Ethernet device’s MAC-48 identifier.
- Fibre Channel
- A MAC-48 address similar to Ethernet.
- IEEE 802.11
- A MAC-48 address similar to Ethernet.
- FDDI
- Identical to the FDDI MAC-48 address.
- IPv4
- Identical to the 32-bit IPv4 address.
- IPv6
- Identical to the 128-bit IPv6 address.
- IPX
- A concatenation of a 32-bit network number and 48-bit node address, by default the Ethernet interface’s MAC-48 address.
- JXTA
- A 160-bit SHA-1 URN.
- NCP
- Similar to IPX.
- RSVP
- A combination of various RSVP session attributes and IPv4 addresses.
- SCTP
- A combination of the host IP addresses (plural) and the SCTP port used. So different SCTP ports on the same IP address are different SCTP endpoints, but the same SCTP port on different IP addresses of the same host are still the same endpoint.
- TCP
- A combination of the IP address and the TCP port used. Different TCP ports on the same IP address are different TCP endpoints.
- Token Ring
- Identical to the Token Ring MAC-48 address.
- UDP
- A combination of the IP address and the UDP port used, so different UDP ports on the same IP address are different UDP endpoints.
- USB
- Identical to the 7-bit USB address.
![[Note]](images/note.svg) | Broadcast and multicast endpoints |
|---|---|
|
Broadcast and multicast traffic will be shown separately as additional endpoints. Of course, as these aren’t physical endpoints the real traffic will be received by some or all of the listed unicast endpoints. |
This window shows statistics about the endpoints captured.
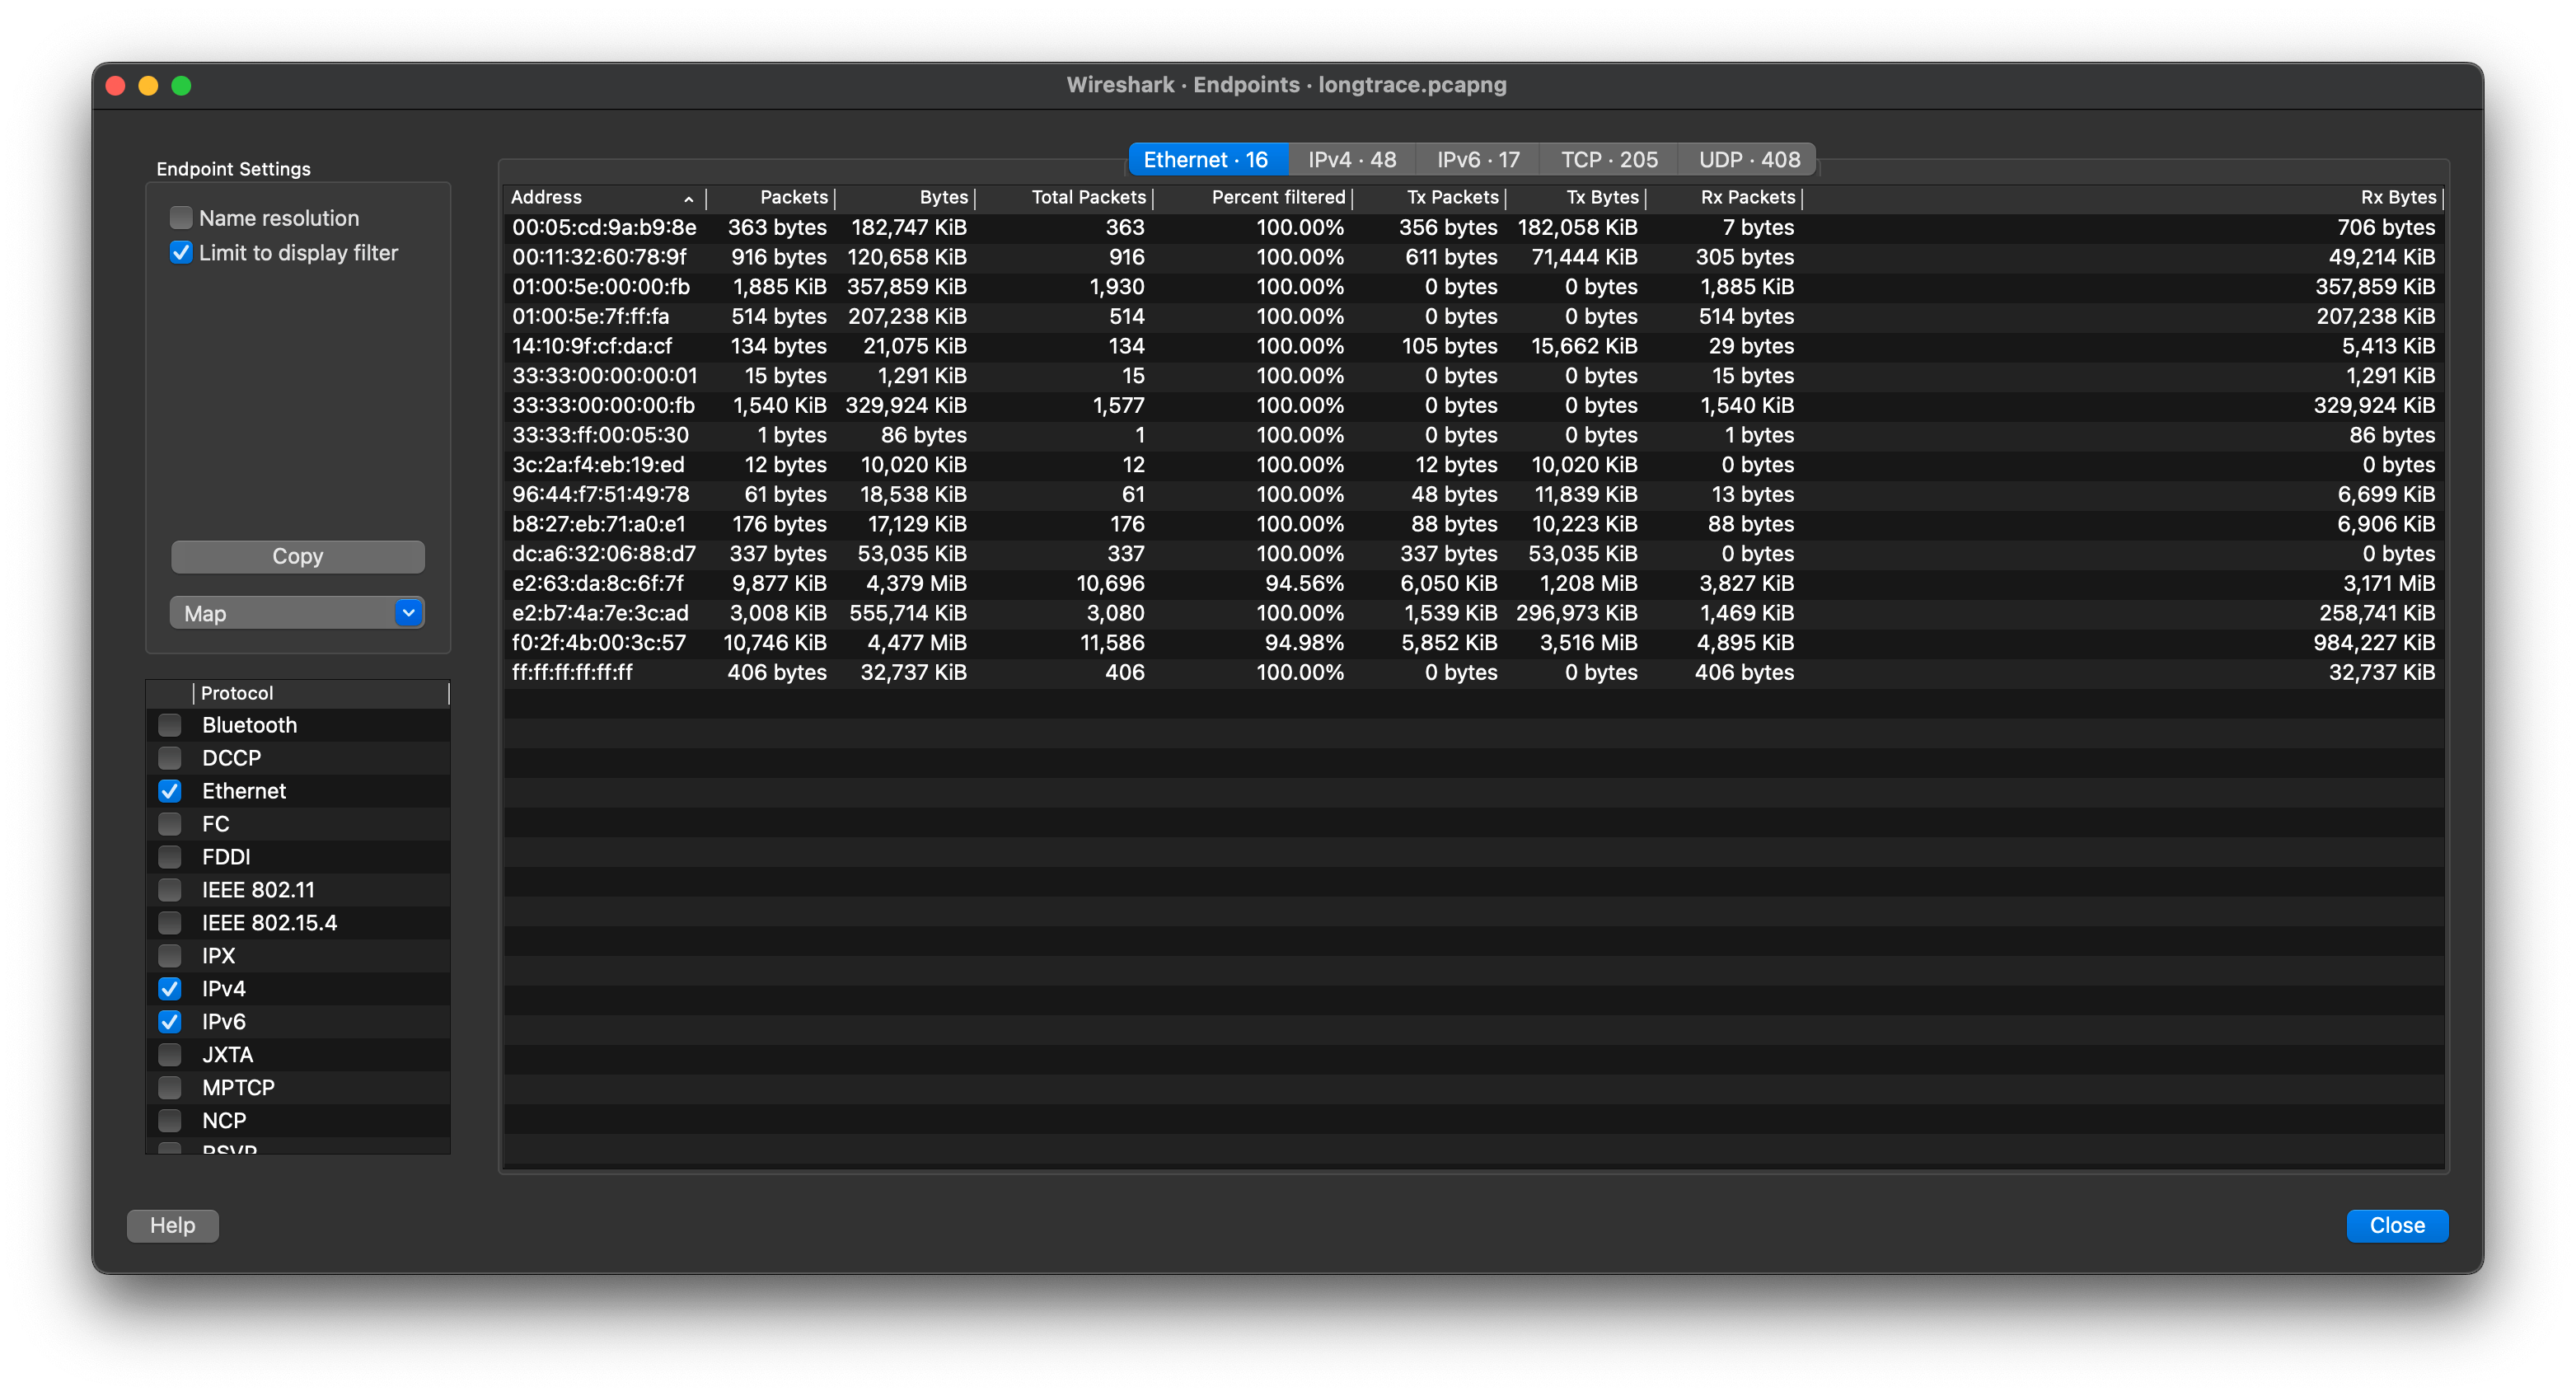
For each supported protocol, a tab is shown in this window. Each tab label shows the number of endpoints captured (e.g., the tab label “Ethernet · 4” tells you that four ethernet endpoints have been captured). If no endpoints of a specific protocol were captured, the tab label will be greyed out (although the related page can still be selected).
Each row in the list shows the statistical values for exactly one endpoint.
Name resolution will be done if selected in the window and if it is active for the specific protocol layer (MAC layer for the selected Ethernet endpoints page). Limit to display filter will only show conversations matching the current display filter. Note that in this example we have MaxMind DB configured which gives us extra geographic columns. See Section 11.9, “MaxMind Database Paths” for more information.
If a display filter had been applied before the dialog is opened, Limit to display filter will be set automatically. Additionally, after a display filter had been applied, two columns ("Total Packets") and ("Percent Filtered") show the number of unfiltered total packets and the percentage of packets in this filter display.
For IPv4 endpoints only, the Hide aggregated checkbox controls how the traffic identified from the subnets file should be displayed. By default (not checked), the individual endpoints and the subnets are both displayed, and when checked, only the aggregation is. The traffic which is not matching any subnet is kept as it is. This checkbox is available only when the IPv4 user preference Aggregate subnets in Statistics Dialogs is enabled. See Section B.3, “Configuration Files” for the subnets file description. image::images/ws-stats-endpoints-ipv4aggregation.png[scaledwidth="85%"]
The button will copy the list values to the clipboard in CSV (Comma Separated Values), YAML format or JSON format. The numbers are generally exported without special formatting, but this can be enabled if needed. The button will show the endpoints mapped in your web browser.
lets you choose which traffic type tabs are shown. See Section 8.6, “Endpoints” above for a list of endpoint types. The enabled types are saved in your profile settings, as well as the last opened tab.
| Tip |
|---|---|
|
This window will be updated frequently, so it will be useful even if you open it before (or while) you are doing a live capture. |