A network conversation is the traffic between two specific endpoints. For example, an IP conversation is all the traffic between two IP addresses. The description of the known endpoint types can be found in Section 8.6, “Endpoints”.
The conversations are influenced by the Deinterlacing conversations key preference.
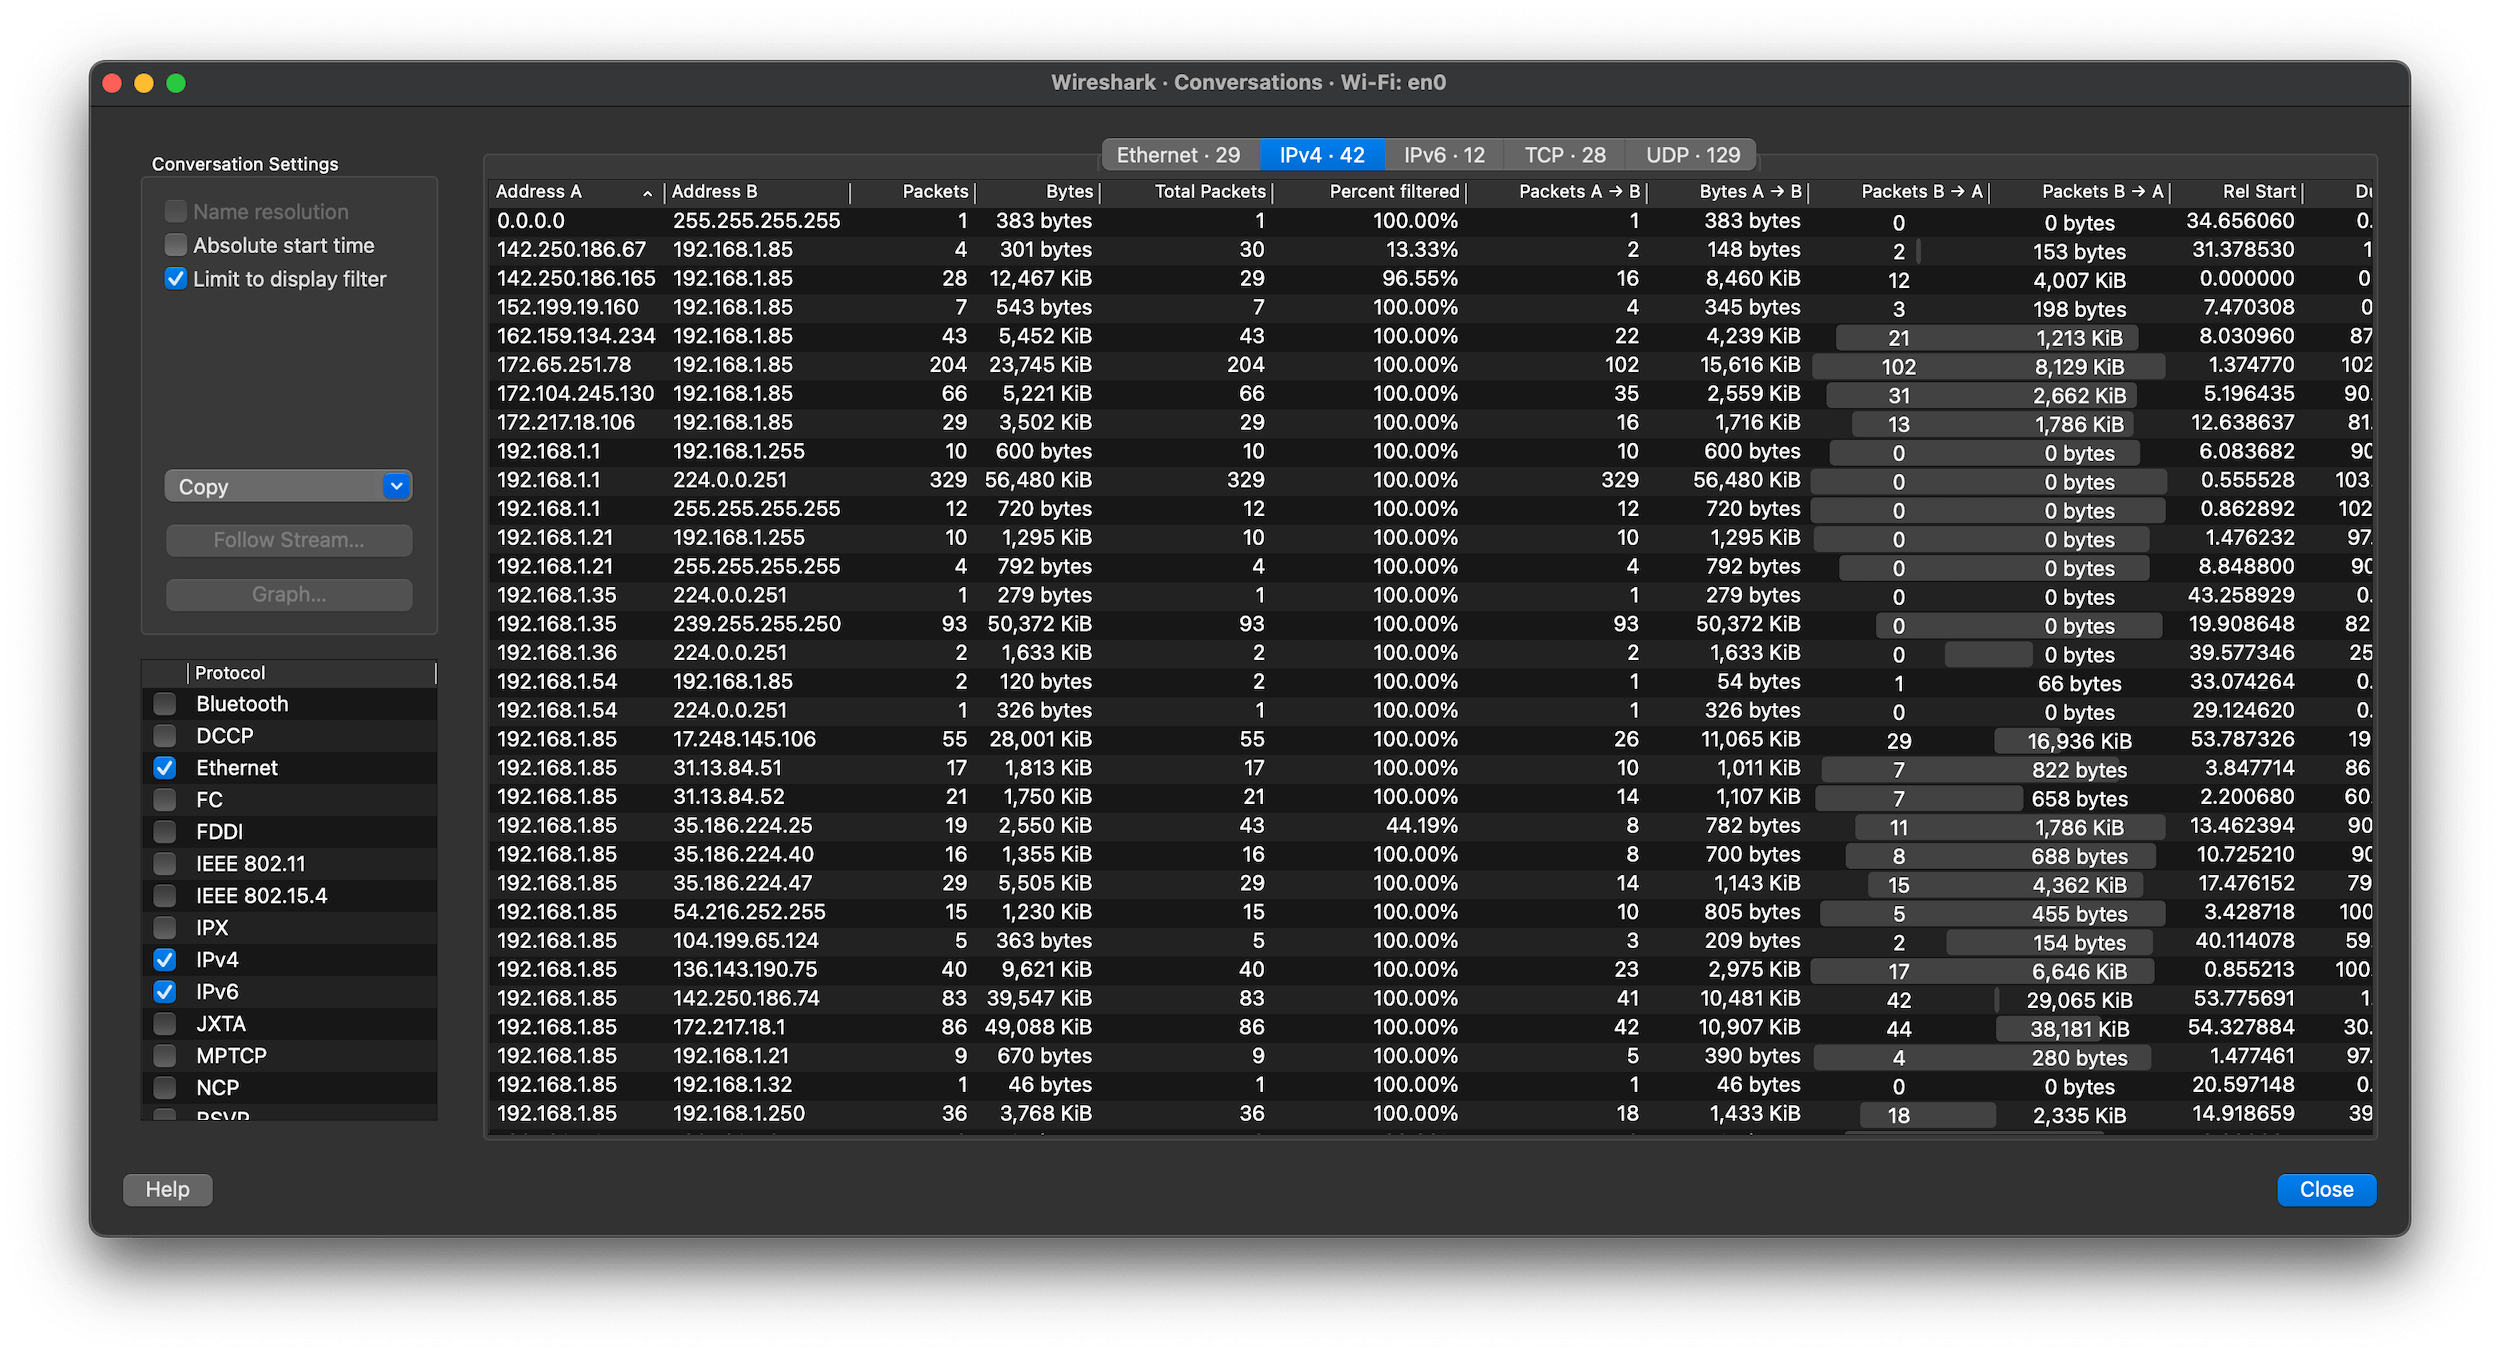
The conversations window is similar to the endpoint Window. See Section 8.6.1, “The “Endpoints” Window” for a description of their common features. Along with addresses, packet counters, and byte counters the conversation window adds four columns: the start time of the conversation (“Rel Start”) or (“Abs Start”), the duration of the conversation in seconds, and the average bits (not bytes) per second in each direction. A timeline graph is also drawn across the “Rel Start” / “Abs Start” and “Duration” columns.
Each row in the list shows the statistical values for exactly one conversation.
Name resolution will be done if selected in the window and if it is active for the specific protocol layer (MAC layer for the selected Ethernet endpoints page). Limit to display filter will only show conversations matching the current display filter. Absolute start time switches the start time column between relative (“Rel Start”) and absolute (“Abs Start”) times. Relative start times match the “Seconds Since First Captured Packet” time display format in the packet list and absolute start times match the “Time of Day” display format.
If a display filter had been applied before the dialog is opened, Limit to display filter will be set automatically. Additionally, after a display filter had been applied, two columns ("Total Packets") and ("Percent Filtered") show the number of unfiltered total packets and the percentage of packets in this filter display.
The button will copy the list values to the clipboard in CSV (Comma Separated Values), YAML format or JSON format. The numbers are generally exported without special formatting, but this can be enabled if needed.
The button will show the stream contents as described in Figure 7.1, “The “Follow TCP Stream” dialog box” dialog. The button will show a Time Sequence graph as described in Section 8.26, “TCP Stream Graphs”. The will open the I/O Graph dialog described in Section 8.8, “The “I/O Graphs” Window”, with the selected conversations.
lets you choose which traffic type tabs are shown. See Section 8.6, “Endpoints” for a list of endpoint types. The enabled types are saved in your profile settings, as well as the last opened tab.
![[Tip]](images/tip.svg) | Tip |
|---|---|
|
This window will be updated frequently so it will be useful even if you open it before (or while) you are doing a live capture. |