Lets you plot packet and protocol data in a variety of ways.
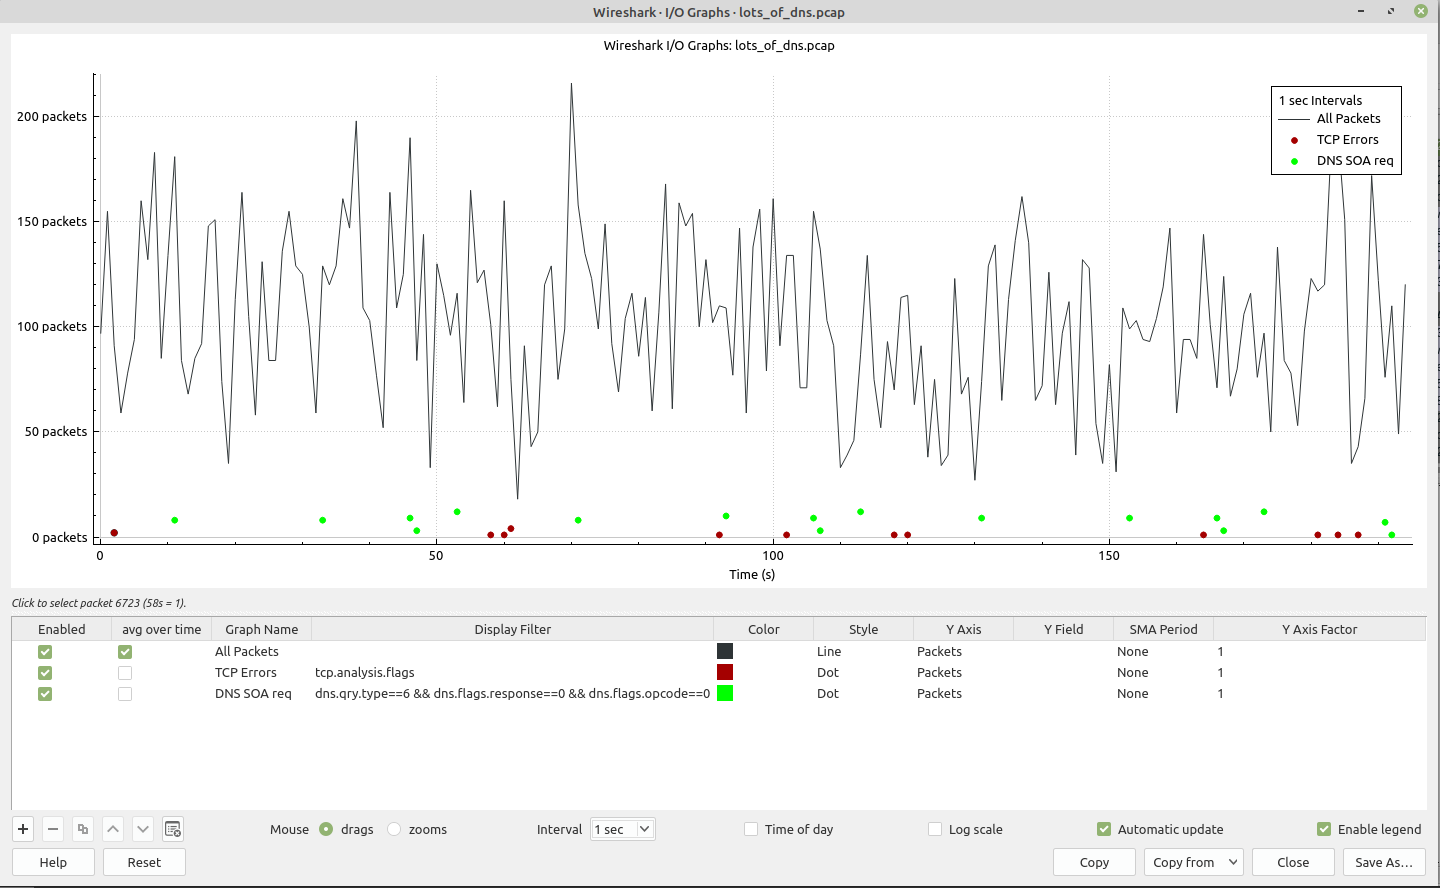
As shown above, this window contains a chart drawing area along with a customizable list of graphs. Graphs are saved in your current profile. They are divided into time intervals, which can be set as described below. Hovering over the graph shows the last packet number of the selected graph (or by default, the first enabled graph in the graphs list) in each interval except as noted below. If the graph was customized, instead of the packet number it will show a value computed according to the custom settings (ex: MAX,MIN,..). Clicking on the graph takes you to the associated packet in the packet list. Individual graphs can be configured using the following options:
- Enabled
- Draw or don’t draw this graph.
- Avg over Time
- When checked and the “Y Axis” value is one of Packets/Bytes/Bits, the displayed value is an average over time based on the Interval, instead of the raw value. The ordinary throughput is obtained when “Y Axis” is set to Bits.
- Graph Name
- The name of this graph.
- Display Filter
- Limits the graph to packets that match this filter.
- Color
- The color to use for plotting the graph’s lines, bars, or points.
- Style
- How to visually represent the graph’s data, e.g., by drawing a line, bar, circle, plus, etc.
- Y Axis
-
The value to use for the graph’s Y axis. Can be one of:
- Packets, Bytes, or Bits
- The total number of packets, packet bytes, or packet bits that match the graph’s display filter per interval. Zero values are omitted in some cases.
- SUM(Y Field)
- The sum of the values of the field specified in “Y Field” per interval.
- COUNT FRAMES(Y Field)
- The number of frames that contain the field specified in “Y Field” per interval.
- COUNT FIELDS(Y Field)
- The number of instances of the field specified in “Y Field” per interval. Some fields, such as dns.resp.name, can show up multiple times in a packet.
- MAX(Y Field), MIN(Y Field), AVG(Y Field)
- The maximum, minimum, and arithmetic mean values of the specified “Y Field” per interval. For MAX and MIN values, hovering and clicking the graph will show and take you to the packet with the MAX or MIN value in the interval instead of the most recent packet.
- LOAD(Y Field)
-
The queue depth, i.e., number of concurrent requests or calls, in each interval expressed in Erlangs.
Requires “Y Field” be a relative time value, and treats it as the duration of an event which
ended in the containing packet. Useful for response time fields like
smb.time. - THROUGHPUT(Y Field)
- If the “Y Field” is a payload (as frame.len, ip.len, ipv6.plen..), this is the computed throughput based on this payload. The “Y Axis Factor” needs to be set accordingly to the payload unit to have a value expressed in bits unit (ex: ip.len being expressed as Bytes, set Y Axis Factor to 8).
- Y Field
- The display filter field from which to extract values for the Y axis calculations listed above.
- SMA Period
- Show a simple moving average of values over a specified period of intervals.
- Y Axis Factor
- Scale the Y axis for this graph by multiplying by a constant factor, e.g. to graph bits if the “Y Field” contains bytes, or to present multiple graphs at a similar scale.
The chart as a whole can be configured using the controls under the graph list:
- Add a new graph.
- Remove the selected graph(s).
- Copy the selected graph(s).
- Move the selected graph(s) up in the list.
- Move the selected graph(s) down in the list.
- Remove all graphs.
- Mouse drags / zooms
- When using the mouse inside the graph area, either drag the graph contents or select a zoom area.
- Interval
- Set the interval period for the graph.
- Time of day
- Switch between showing the absolute time of day or the time relative from the start of capture in the X axis.
- Log scale
- Switch between a logarithmic or linear Y axis.
- Automatic updates
- Redraw each graph automatically.
- Enable legend
- Show a graph legend.
The main dialog buttons along the bottom let you do the following:
will take you to this section of the User’s Guide.
will autoscale the axes to full display all graphs.
will copy values from selected graphs to the clipboard in CSV (Comma Separated Values) format.
will let you copy graphs from another profile to the current dialog.
will close this dialog.
will save the currently displayed graph as an image or CSV data.
![[Tip]](images/tip.svg) | Tip |
|---|---|
|
You can see a list of useful keyboard shortcuts by right-clicking on the graph. |
Wireshark’s I/O Graph window counts or calculates summary statistics over intervals. If a packet or field does not occur in a given interval, the calculation might yield zero. This is particularly likely for very small intervals. For "counting" graphs (Packets, Bytes, Bits, COUNT FRAMES, COUNT FIELDS) zero values are omitted from scatter plots, but shown in line graphs and bar charts. For the summary statistics SUM, MAX, and AVG, values are always omitted if the Y field was not present in the interval. For LOAD graphs, values are omitted if no field’s time indicated that an event was was present in the interval. (Note for LOAD graphs that a response time can contribute to earlier intervals than the one containing the packet if the duration is longer than the interval.)