Lets you plot display filter field values over time.
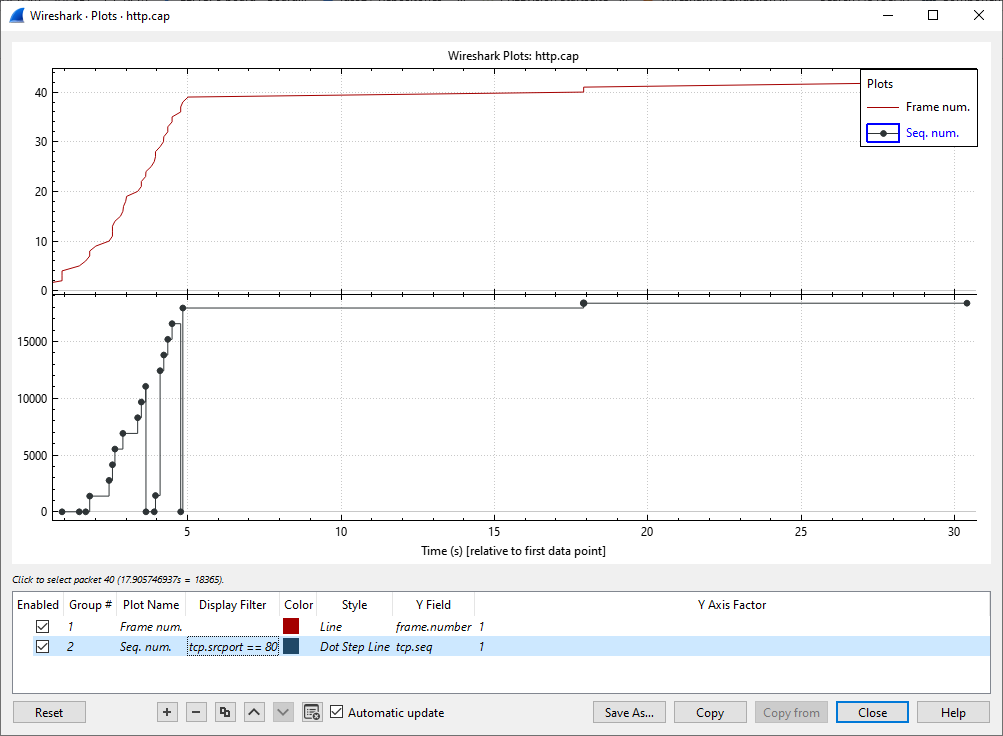
As shown above, this window contains a plot drawing area along with a customizable list of plots. Plots are saved in your current profile. Each plot shows the value of the specified field (see Y Field below) at each point in time. Hovering over the plot shows the packet number of the selected plot at any given time. Clicking on the plot takes you to the corresponding packet in the packet list. You can drag the plots around with a left click and zoom on a specific area with a right click.
Individual plots can be configured using the following options:
- Enabled
- Draw or don’t draw this plot.
- Group #
- If you don’t want all plots on the same graph, you can use this field to group them. Each one will be shown in a distinct graph.
- Plot Name
- The name of this plot.
- Display Filter
- Limits the plot to packets that match this filter.
- Color
- The color to use for plotting the plot’s lines or points.
- Style
- How to visually represent the plot’s data, e.g., by drawing a line, circle, plus, etc.
- Y Field
- The display filter field from which to extract values for the Y axis.
- Y Axis Factor
- Scale the Y axis for this plot by multiplying by a constant factor, e.g. to present multiple plots at a similar scale.
The plot as a whole can be configured using the controls under the plot list:
- Add a new plot.
- Remove the selected plot(s).
- Copy the selected plot(s).
- Move the selected plot(s) up in the list.
- Move the selected plot(s) down in the list.
- Remove all plots.
- Automatic updates
- Redraw each plot automatically.
- Time origin
- Switch between showing the time relative to first data point and time relative to capture start (not available in pcapng).
- Log scale
- Switch between linear and logarithmic Y axis.
- Crosshairs
- Enable/disable the crosshairs cursor.
- Top axis
- Show the axis scale also on top of the plot.
- Enable legend
- Show a plot legend.
- Multiple Value Axes
- Use multiple Y-axes for displaying data on different scales.
- Enable auto scroll
- Goes automatically to the last drawn points.
- Add Marker
- Add marker with x-axis of current mouse position.
- Move Marker
- Moves the selected marker to a specific x-axis position provided by the user.
- Show Pos Marker
- Show or hide the pos marker, you can then change it to the desired position by dragging and dropping it or left click.
- Show Differences
- User can show or hide the difference between markers.
- Show Data Point Marker
- User can show or hide data point marker.
- Delete Marker
- Delete the selected marker.
- Delete All
- Delete all markers, including the Pos Marker "P".
The main dialog buttons along the bottom let you do the following:
will take you to this section of the User’s Guide.
will autoscale the axes to fully display all plots.
will copy values from selected plot to the clipboard in CSV (Comma Separated Values) format.
will let you copy plots from another profile to the current dialog.
will close this dialog.
will save the currently displayed plot as an image.
![[Tip]](images/tip.svg) | Tip |
|---|---|
|
You can see a list of useful keyboard shortcuts by right-clicking on the plot. |