Announcement
What’s New In Wireshark 4.6?
by Gerald Combs | Wed Oct 08 2025
Wireshark 4.6.0 has been released! I’ll cover a few of the improvements and updates that have been added since version 4.4.0 was released here, but you will definitely want to check out the release notes1 for details.
Plots
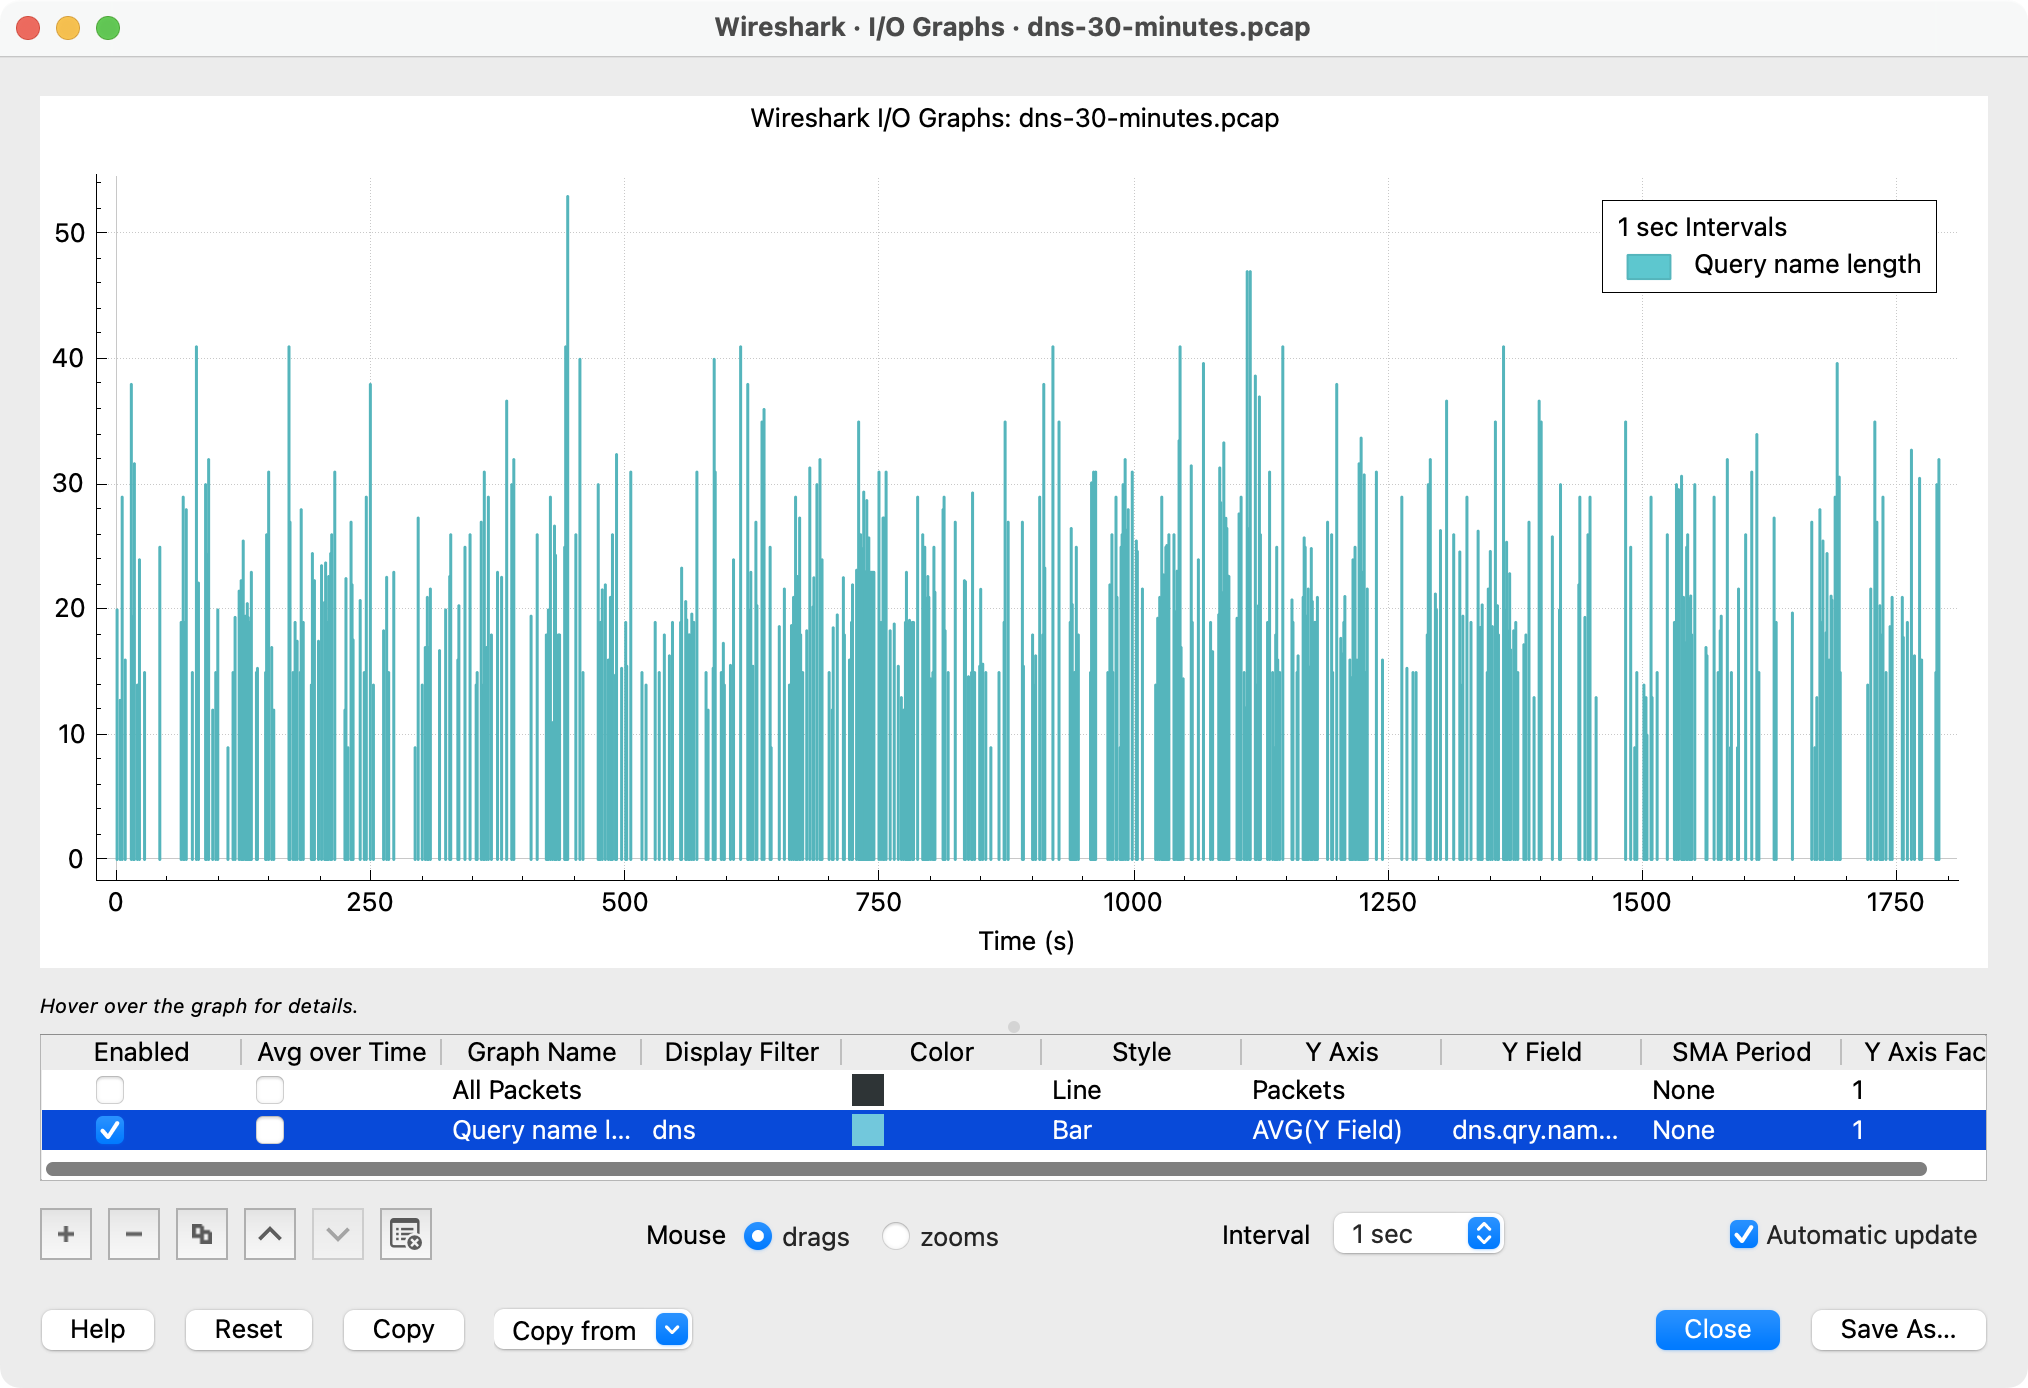
If you open the “Statistics” menu in Wireshark 4.6 you’ll see new “Plots” item listed under “I/O Graphs”. What’s the difference? Doesn’t “I/O Graphs” plot data as well? The difference is how the data is treated. Wireshark’s I/O Graphs are a type of histogram, where the data is divided into time intervals and summarized to a single data point. To illustrate this, suppose we have a capture that contains a bunch of DNS queries. We can show the average query name length per second using the I/O Graph dialog as shown below:

In this case, Wireshark creates a “bucket” for each 1 second interval and shows you the average query name length for all of the name lengths in each bucket. This is useful for things like average and maximum throughput, hence the name “I/O Graphs.”
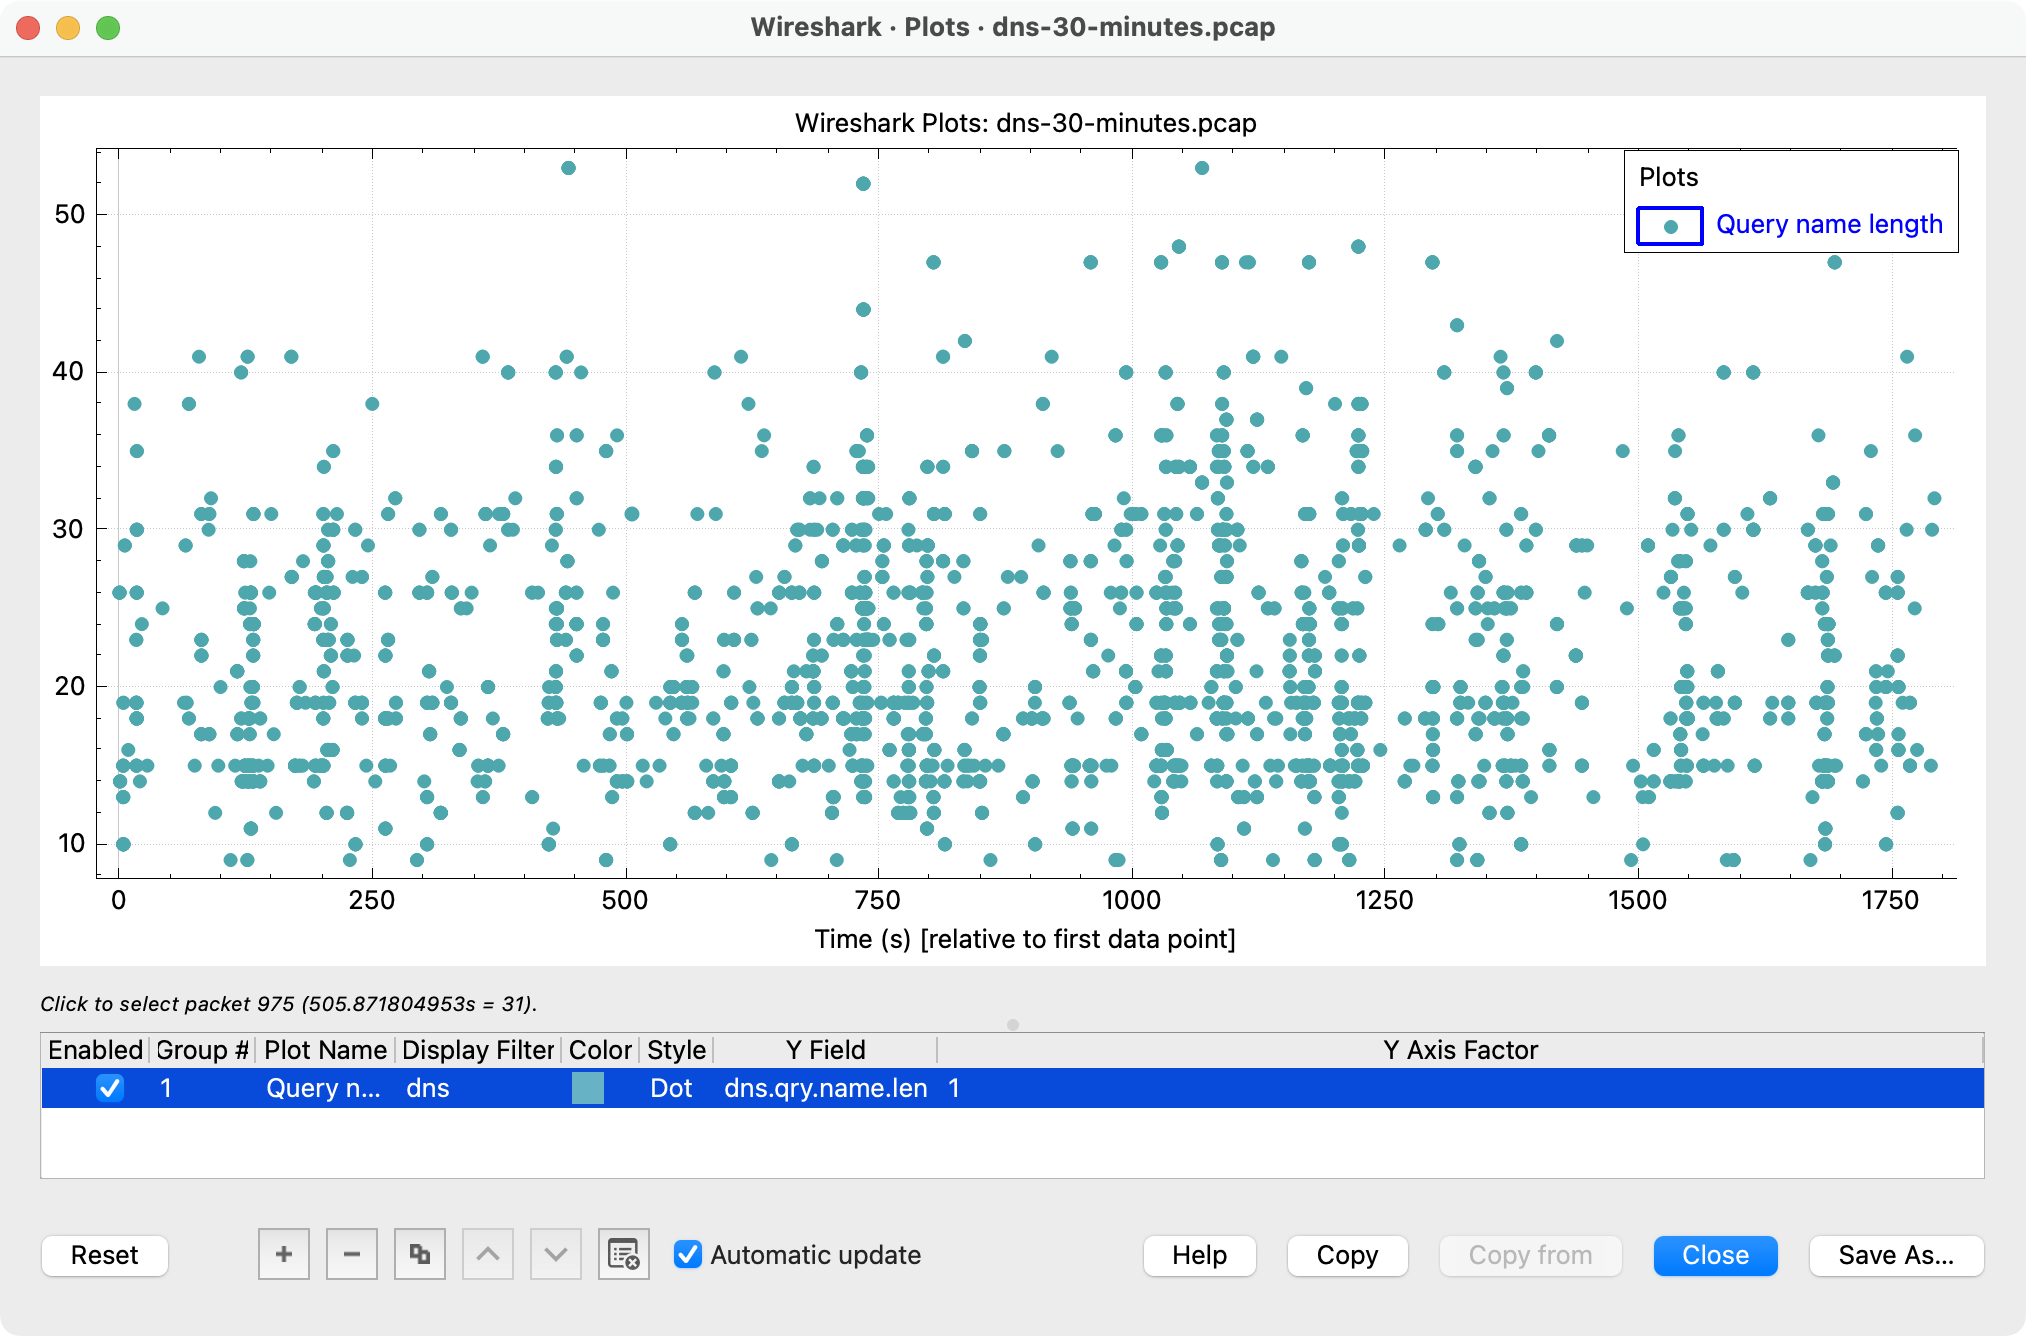
But what if we want to see the actual name lengths instead? That’s where Plots come in. If we plot our DNS query lengths instead, we end up with this:

Where the I/O graph appears to be more random, the plot shows some regular patterns. This is because it’s a capture of the DNS traffic in my house, and like most housesholds we have devices scattered everywhere that run apps that periodically phone home and refresh their data.
Other Changes
macOS packages now ship as a single Universal disk image instead of separate Arm and Intel packages.
Live captures can be compressed while writing.
You can now copy packet list items as HTML.
You can now force light or dark mode independently of your OS settings on macOS and Windows.
Links
Footnotes
-
The complete Wireshark 4.6.0 release notes can be found at https://www.wireshark.org/docs/relnotes/wireshark-4.6.0.html ↩
