It can be very helpful to see a protocol in the way that the application layer sees it. Perhaps you are looking for passwords in a Telnet stream, or you are trying to make sense of a data stream. Maybe you just need a display filter to show only the packets in a TLS or SSL stream. If so, Wireshark’s ability to follow protocol streams will be useful to you.
To filter to a particular stream, select a packet in the packet list of the stream/connection you are interested in and then select the menu item you want under → (or in the context menu in the packet list). Wireshark will set an appropriate display filter and display a dialog box with the data from the stream laid out, as shown in Figure 7.1, “The “Follow TCP Stream” dialog box”.
![[Tip]](images/tip.svg) | Tip |
|---|---|
|
Following a protocol stream applies a display filter which selects all the packets in the current stream. Some people open the “Follow TCP Stream” dialog and immediately close it as a quick way to isolate a particular stream. Closing the dialog with the “Back” button will reset the display filter if this behavior is not desired. |
Wireshark supports following the streams of many different protocols, including TCP, UDP, DCCP, TLS, HTTP, HTTP/2, QUIC, WebSocket, SIP, and USB CDC. The dialog for following TCP streams is covered in detail here; most other supported protocols will show dialogs which are very similar.
![[Note]](images/note.svg) | Note |
|---|---|
|
If the type of stream you wish to follow is disabled or missing from the menu, Wireshark did not find the respective protocol in the currently selected packet. |
| Tip |
|---|---|
|
To follow TLS or SSL streams, see the wiki page on TLS for instructions on providing TLS keys. |
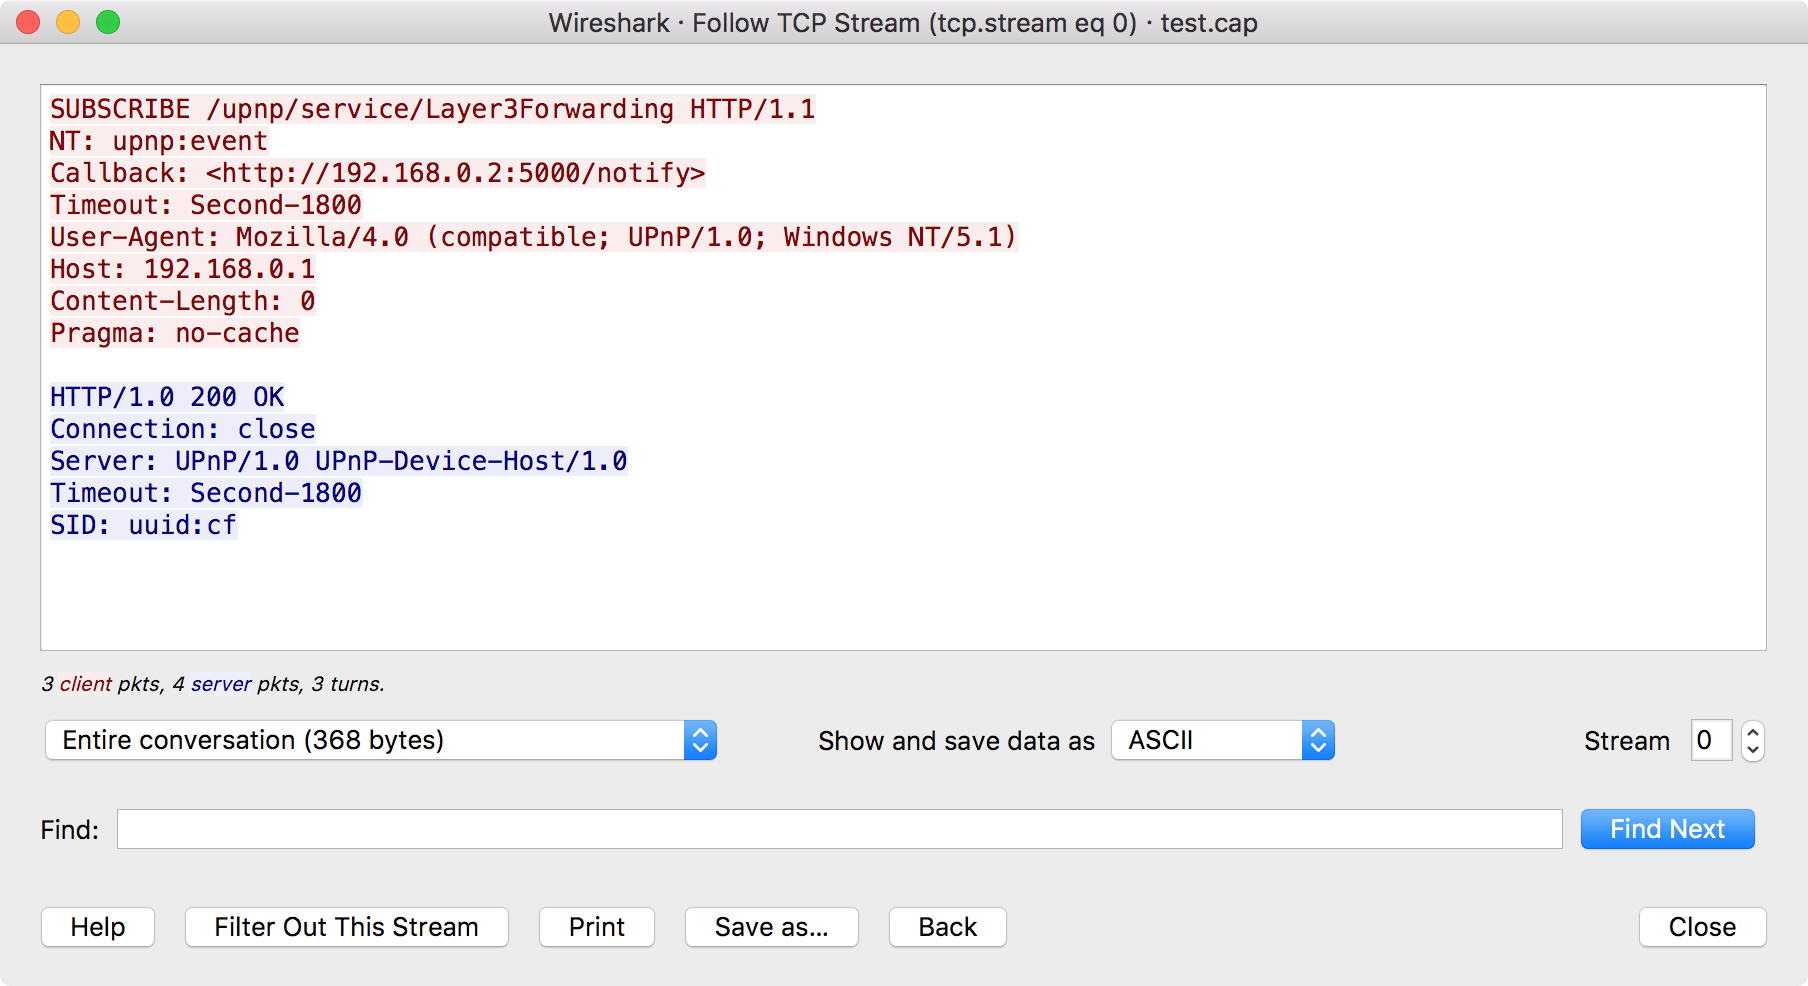
The stream content is displayed in the same sequence as it appeared on the network. Non-printable characters are replaced by dots. Traffic from the client to the server is colored red, while traffic from the server to the client is colored blue. These colors are defined by the active theme, which you can select by opening → and choosing a theme under → .
The stream content won’t be updated while doing a live capture. To get the latest content you’ll have to reopen the dialog.
You can choose from the following actions:
- Show this help.
- Apply a display filter removing the current stream data from the display.
- Print the stream data in the currently selected format.
- Save the stream data in the currently selected format.
- Close this dialog box and restore the previous display filter.
- Close this dialog box, leaving the current display filter in effect.
By default, Wireshark displays both client and server data. You can select the to switch between both, client to server, or server to client data.
You can choose to view the data in one of the following formats:
- In this view you see the data from each direction in ASCII. Obviously best for ASCII based protocols, e.g., HTTP.
- This allows you to import the stream data into your own C program.
- For the big-iron freaks out there.
- This allows you to see all the data. This will require a lot of screen space and is best used with binary protocols.
- Like ASCII, but decode the data as UTF-8.
- Like ASCII, but decode the data as UTF-16.
- This allows you to load the stream as YAML.
The YAML output is divided into 2 main sections:
-
The
peerssection where for eachpeeryou found the peer index, thehostaddress and theportnumber. -
The
packetssection where for eachpacketyou found the packet number in the original capture, thepeerindex, the packetindexfor this peer, thetimestampin seconds and thedatain base64 encoding.
Example 7.1. Follow Stream YAML output
peers:
  - peer: 0
    host: 127.0.0.1
    port: 54048
  - peer: 1
    host: 127.0.10.1
    port: 5000
packets:
  - packet: 1
    peer: 0
    index: 0
    timestamp: 1599485409.693955274
    data: !!binary |
      aGVsbG8K
  - packet: 3
    peer: 1
    index: 0
    timestamp: 1599485423.885866692
    data: !!binary |
      Ym9uam91cgo=
The same example but in old YAML format (before version 3.5):
# Packet 1
peer0_0: !!binary |
  aGVsbG8K
# Packet 3
peer1_0: !!binary |
  Ym9uam91cgo=
How the old format data can be found in the new format:
| New YAML format | Old YAML format | |
|---|---|---|
...
packets:
  - packet: AAA
    peer: BBB
    index: CCC
    data: !!binary |
DDD | # Packet AAA peerBBB_CCC !!binary | DDD | AAA: packet number in the original capture BBB: peer index CCC: packet index for this peer DDD: data in base64 encoding |
- This allows you to load the unaltered stream data into a different program for further examination. The display will show the data as strings of hex characters with each frame on a separate line, but “Save As” will result in a binary file without any added line separators.
You can optionally show the delta time each time the direction changes (turns) or for every packet or event.
You can switch between streams using the “Stream” selector.
You can search for text by entering it in the “Find” entry box and pressing .
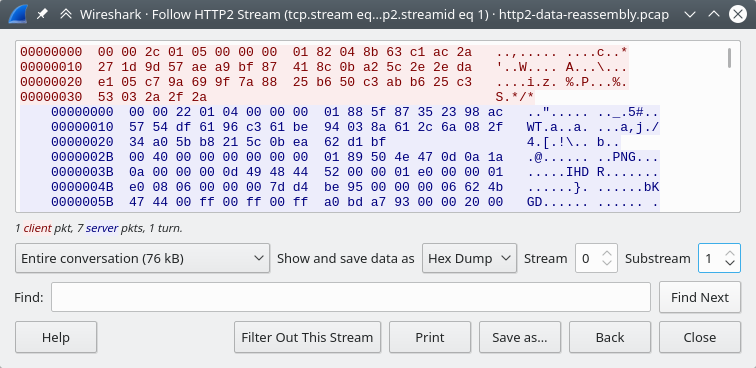
The HTTP/2 Stream dialog is similar to the "Follow TCP Stream" dialog, except
for an additional "Substream" dialog field. HTTP/2 Streams are identified by
a HTTP/2 Stream Index (field name http2.streamid) which are unique within a
TCP connection. The “Stream” selector determines the TCP connection whereas the
“Substream” selector is used to pick the HTTP/2 Stream ID.
The QUIC protocol is similar, the first number selects the QUIC connection number while the "Substream" field selects the QUIC Stream ID.
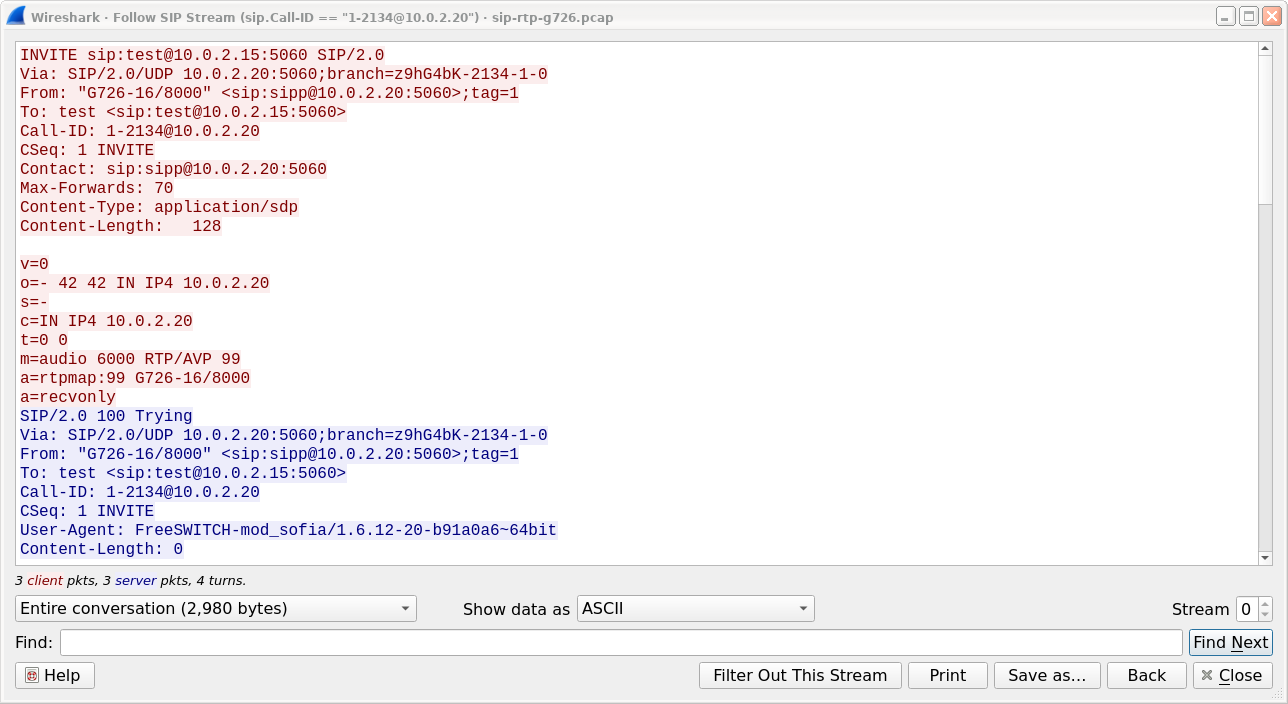
The SIP call is shown with same dialog, just filter is based on sip.Call-ID field. Count of streams is fixed to 0 and the field is disabled.