Table of Contents
- Preface
- 1. Introduction
- 2. Building and Installing Wireshark
- 3. User Interface
- 3.1. Introduction
- 3.2. Start Wireshark
- 3.3. The Main window
- 3.4. The Menu
- 3.5. The “File” Menu
- 3.6. The “Edit” Menu
- 3.7. The “View” Menu
- 3.8. The “Go” Menu
- 3.9. The “Capture” Menu
- 3.10. The “Analyze” Menu
- 3.11. The “Statistics” Menu
- 3.12. The “Telephony” Menu
- 3.13. The “Wireless” Menu
- 3.14. The “Tools” Menu
- 3.15. The “Help” Menu
- 3.16. The “Main” Toolbar
- 3.17. The “Filter” Toolbar
- 3.18. The “Packet List” Pane
- 3.19. The “Packet Details” Pane
- 3.20. The “Packet Bytes” Pane
- 3.21. The “Packet Diagram” Pane
- 3.22. The Statusbar
- 4. Capturing Live Network Data
- 4.1. Introduction
- 4.2. Prerequisites
- 4.3. Start Capturing
- 4.4. The “Capture” Section Of The Welcome Screen
- 4.5. The “Capture Options” Dialog Box
- 4.6. The “Manage Interfaces” Dialog Box
- 4.7. The “Compiled Filter Output” Dialog Box
- 4.8. Capture files and file modes
- 4.9. Link-layer header type
- 4.10. Filtering while capturing
- 4.11. While a Capture is running …
- 5. File Input, Output, And Printing
- 5.1. Introduction
- 5.2. Open Capture Files
- 5.3. Saving Captured Packets
- 5.4. Merging Capture Files
- 5.5. Import Hex Dump
- 5.6. File Sets
- 5.7. Exporting Data
- 5.7.1. The “Export Specified Packets” Dialog Box
- 5.7.2. The “Export Packet Dissections” Dialog Box
- 5.7.3. The “Export Selected Packet Bytes” Dialog Box
- 5.7.4. The “Export PDUs to File…” Dialog Box
- 5.7.5. The “Strip Headers…” Dialog Box
- 5.7.6. The “Export TLS Session Keys…” Dialog Box
- 5.7.7. The “Export Objects” Dialog Box
- 5.8. Printing Packets
- 5.9. The “Packet Range” Frame
- 5.10. The Packet Format Frame
- 6. Working With Captured Packets
- 6.1. Viewing Packets You Have Captured
- 6.2. Pop-up Menus
- 6.3. Filtering Packets While Viewing
- 6.4. Building Display Filter Expressions
- 6.4.1. Display Filter Fields
- 6.4.2. Comparing Values
- 6.4.3. Combining Expressions
- 6.4.4. Slice Operator
- 6.4.5. The Layer Operator
- 6.4.6. The At Operator
- 6.4.7. Membership Operator
- 6.4.8. Arithmetic operators
- 6.4.9. Functions
- 6.4.10. Field References
- 6.4.11. Implicit type conversions
- 6.4.12. Sometimes Fields Change Names
- 6.4.13. Some protocol names can be ambiguous
- 6.5. The “Display Filter Expression” Dialog Box
- 6.6. Defining And Saving Filters
- 6.7. Defining And Saving Filter Macros
- 6.8. Finding Packets
- 6.9. Go To A Specific Packet
- 6.10. Marking Packets
- 6.11. Ignoring Packets
- 6.12. Time Display Formats And Time References
- 6.13. Time Shifting Packets
- 7. Advanced Topics
- 8. Statistics
- 8.1. Introduction
- 8.2. The “Capture File Properties” Dialog
- 8.3. Resolved Addresses
- 8.4. The “Protocol Hierarchy” Window
- 8.5. Conversations
- 8.6. Endpoints
- 8.7. Packet Lengths
- 8.8. The “I/O Graphs” Window
- 8.9. The “Plots” Window
- 8.10. Service Response Time
- 8.11. Distribution Statistics
- 8.12. DHCP (BOOTP) Statistics
- 8.13. NetPerfMeter Statistics
- 8.14. ONC-RPC Programs
- 8.15. 29West
- 8.16. ANCP
- 8.17. BACnet
- 8.18. Collectd
- 8.19. DNS
- 8.20. Flow Graph
- 8.21. HART-IP
- 8.22. HPFEEDS
- 8.23. HTTP Statistics
- 8.24. HTTP2
- 8.25. Sametime
- 8.26. TCP Stream Graphs
- 8.27. UDP Multicast Streams
- 8.28. Reliable Server Pooling (RSerPool)
- 8.29. F5
- 8.30. IPv4 Statistics
- 8.31. IPv6 Statistics
- 9. Telephony
- 9.1. Introduction
- 9.2. Playing VoIP Calls
- 9.3. VoIP Calls Window
- 9.4. ANSI
- 9.5. GSM Windows
- 9.6. IAX2 Stream Analysis Window
- 9.7. ISUP Messages Window
- 9.8. 3GPP Uu
- 9.9. MTP3 Windows
- 9.10. Osmux Windows
- 9.11. RTP
- 9.12. RTSP Window
- 9.13. SCTP Windows
- 9.14. SMPP Operations Window
- 9.15. UCP Messages Window
- 9.16. F1AP Messages Window
- 9.17. NGAP Messages Window
- 9.18. E2AP Messages Window
- 9.19. H.225 Window
- 9.20. SIP Flows Window
- 9.21. SIP Statistics Window
- 9.22. WAP-WSP Packet Counter Window
- 10. Wireless
- 11. Customizing Wireshark
- 11.1. Introduction
- 11.2. Start Wireshark from the command line
- 11.3. Packet colorization
- 11.4. Control Protocol Dissection
- 11.5. Preferences
- 11.6. Configuration Profiles
- 11.7. User Accessible Tables
- 11.8. ESS Category Attributes
- 11.9. MaxMind Database Paths
- 11.10. IEEE 802.11 WLAN Decryption Keys
- 11.11. IKEv2 decryption table
- 11.12. Object Identifiers
- 11.13. PRES Users Context List
- 11.14. SCCP users Table
- 11.15. SMI (MIB and PIB) Modules
- 11.16. SMI (MIB and PIB) Paths
- 11.17. SNMP Enterprise Specific Trap Types
- 11.18. SNMP users Table
- 11.19. Tektronix K12xx/15 RF5 protocols Table
- 11.20. User DLTs dissector table
- 11.21. Protobuf Search Paths
- 11.22. Protobuf UDP Message Types
- 11.23. Welcome Page Banner Slides
- 12. MATE
- A. Wireshark Messages
- B. Files and Folders
- C. Protocols and Protocol Fields
- D. Related command line tools
- D.1. Introduction
- D.2. tshark: Terminal-based Wireshark
- D.3. tcpdump: Capturing with “tcpdump” for viewing with Wireshark
- D.4. dumpcap: Capturing with “dumpcap” for viewing with Wireshark
- D.5. capinfos: Print information about capture files
- D.6. captype: Prints the types of capture files
- D.7. rawshark: Dump and analyze network traffic.
- D.8. editcap: Edit capture files
- D.9. mergecap: Merging multiple capture files into one
- D.10. text2pcap: Converting ASCII hexdumps to network captures
- D.11. reordercap: Reorder a capture file
- D.12. mmdbresolve: Resolve IP geolocation information
- 13. This Document’s License (GPL)
List of Figures
- 1.1. Wireshark captures packets and lets you examine their contents.
- 3.1. The Main window
- 3.2. The Menu
- 3.3. The “File” Menu
- 3.4. The “Edit” Menu
- 3.5. The “View” Menu
- 3.6. The “Go” Menu
- 3.7. The “Capture” Menu
- 3.8. The “Analyze” Menu
- 3.9. The “Statistics” Menu
- 3.10. The “Telephony” Menu
- 3.11. The “Wireless” Menu
- 3.12. The “Tools” Menu
- 3.13. The “Help” Menu
- 3.14. The “Main” toolbar
- 3.15. The “Filter” toolbar
- 3.16. The “Packet List” pane
- 3.17. The “Packet Details” pane
- 3.18. The “Packet Bytes” pane
- 3.19. The “Packet Bytes” pane with tabs
- 3.20. The “Packet Diagram” pane
- 3.21. The initial Statusbar
- 3.22. The Statusbar with a loaded capture file
- 3.23. The Statusbar with a configuration profile menu
- 3.24. The Statusbar with a selected protocol field
- 3.25. The Statusbar with a display filter message
- 4.1. Capture interfaces on Microsoft Windows
- 4.2. Capture interfaces on macOS
- 4.3. The “Capture Options” input tab
- 4.4. The “Capture Options” output tab
- 4.5. The “Capture Options” options tab
- 4.6. The “Manage Interfaces” dialog box
- 4.7. The “Compiled Filter Output” dialog box
- 4.8. Capture output options
- 4.9. The “Capture Information” dialog box
- 5.1. “Open” on Microsoft Windows
- 5.2. “Open” - Linux and UNIX
- 5.3. “Save” on Microsoft Windows
- 5.4. “Save” on Linux and UNIX
- 5.5. “Merge” on Microsoft Windows
- 5.6. “Merge” on Linux and UNIX
- 5.7. The “Import from Hex Dump” dialog in Hex Dump mode
- 5.8. The "Regular Expression" tab inside the "Import from Hex Dump” dialog.
- 5.9. The “List Files” dialog box
- 5.10. The “Export Specified Packets” dialog box
- 5.11. The “Export Packet Dissections” dialog box
- 5.12. The “Export Selected Packet Bytes” dialog box
- 5.13. Export PDUs to File window
- 5.14. Export TLS Session Keys window
- 5.15. The “Export Objects” dialog box
- 5.16. The “Print” dialog box
- 5.17. The “Packet Range” frame
- 5.18. The “Packet Format” frame
- 6.1. Wireshark with a TCP packet selected for viewing
- 6.2. Viewing a packet in a separate window
- 6.3. Pop-up menu of the “Packet List” column header
- 6.4. Pop-up menu of the “Packet List” pane
- 6.5. Pop-up menu of the “Packet Details” pane
- 6.6. Pop-up menu of the “Packet Bytes” pane
- 6.7. Pop-up menu of the “Packet Diagram” pane
- 6.8. Filtering on the TCP protocol
- 6.9. The “Display Filter Expression” dialog box
- 6.10. The “Capture Filters” and “Display Filters” dialog boxes
- 6.11. Display Filter Macros window
- 6.12. The “Find Packet” toolbar
- 6.13. The “Go To Packet” toolbar
- 6.14. Wireshark showing a time referenced packet
- 6.15. The “Time Shift” dialog
- 6.16. A Time Shifted Packet
- 7.1. The “Follow TCP Stream” dialog box
- 7.2. The “Follow HTTP/2 Stream” dialog box
- 7.3. The “Follow SIP Call” dialog box
- 7.4. The “Expert Information” dialog box
- 7.5. The “Colorized” protocol details tree
- 7.6. The “Expert” packet list column
- 7.7. “TCP Analysis” packet detail items
- 7.8. The “Packet Bytes” pane with a reassembled tab
- 8.1. The “Capture File Properties” dialog
- 8.2. Resolved Addresses window
- 8.3. The “Protocol Hierarchy” Window
- 8.4. The “Conversations” window
- 8.5. The “Endpoints” window
- 8.6. The “Packet Lengths” window
- 8.7. The “I/O Graphs” window
- 8.8. The “Plots” window
- 8.9. The “SMB2 Service Response Time Statistics” window
- 8.10. The “Distribution” window
- 8.11. NetPerfMeter Statistics window
- 8.12. DNS statistics window
- 8.13. Flow Graph window
- 8.14. Flow Graph window showing VoIP call sequences
- 8.15. The “HTTP Request Sequences” window
- 8.16. UDP Multicast Streams window
- 8.17. ASAP Statistics window
- 8.18. ENRP Statistics window
- 8.19. Component Status Protocol Statistics window
- 8.20. CalcApp Protocol Statistics window
- 8.21. Fractal Generator Protocol Statistics window
- 8.22. Ping Pong Protocol Statistics window
- 8.23. Scripting Service Protocol Statistics window
- 9.1. List of supported codecs
- 9.2. button with opened action menu
- 9.3. Tools for modifying playlist in RTP Player window
- 9.4. VoIP Calls window
- 9.5. The “3GPP MAC Traffic Statistics” window
- 9.6. The RLC Graph window
- 9.7. The “LTE RLC Traffic Statistics” window
- 9.8. The “RTP Streams” window
- 9.9. The “RTP Stream Analysis” window
- 9.10. Error indicated in “RTP Stream Analysis” window
- 9.11. Graph in “RTP Stream Analysis” window
- 9.12. RTP Player window
- 9.13. Waveform with error marks
- 9.14. RTP stream state indication
- 9.15. SCTP Analyze Association window
- 9.16. SCTP Associations window
- 10.1. Bluetooth Devices window
- 10.2. Bluetooth HCI Summary window
- 10.3. The “WLAN Traffic Statistics” window
- 11.1. The “Coloring Rules” dialog box
- 11.2. A color chooser
- 11.3. Using color filters with Wireshark
- 11.4. The “Enabled Protocols” dialog box
- 11.5. The “Decode As” dialog box
- 11.6. The preferences dialog box
- 11.7. Column preferences
- 11.8. Layout preferences
- 11.9. Theme and font preferences
- 11.10. Capture preferences
- 11.11. Aggregation fields preferences
- 11.12. Expert item preferences
- 11.13. Filter buttons
- 11.14. Name resolution preferences
- 11.15. Protocol preferences
- 11.16. RSA keys
- 11.17. Statistics preferences
- 11.18. Advanced preferences
- 11.19. The configuration profiles dialog box
- 11.20. "IEEE 802.11 wireless LAN" preferences
- 11.21. 802.11 Decryption Key Types
- 11.22. 802.11 Decryption Key Examples
- 12.1. Packet Details - MATE TCP Session (tcp.mate)
- 12.2. MATE Analysis (PDU→GOP→GOG) flowchart
- 12.3. Wireshark window - fields for PDU extraction
- 12.4. Frame fields mapped to PDU attributes
- 12.5. Frame containing multiple PDUs
- 12.6. Frame with encapsulated (tunneled) fields
- 12.7. Extract from Payload fields
- 12.8. Grouping PDUs (GOP) flowchart
- 12.9. Grouping GOPs (GOG) flowchart
- 12.10. Applying Transform flowchart
List of Tables
- 1. Typographic Conventions
- 3.1. Keyboard Navigation
- 3.2. File menu items
- 3.3. Edit menu items
- 3.4. View menu items
- 3.5. Internals menu items
- 3.6. Go menu items
- 3.7. Capture menu items
- 3.8. Analyze menu items
- 3.9. Statistics menu items
- 3.10. Telephony menu items
- 3.11. Wireless menu items
- 3.12. Tools menu items
- 3.13. Help menu items
- 3.14. Main toolbar items
- 3.15. Filter toolbar items
- 3.16. Related packet symbols
- 4.1. Capture file mode selected by capture options
- 6.1. The menu items of the “Packet List” column header pop-up menu
- 6.2. The menu items of the “Packet List” pop-up menu
- 6.3. The menu items of the “Packet Details” pop-up menu
- 6.4. The menu items of the “Packet Bytes” pop-up menu
- 6.5. The menu items of the “Packet Diagram” pop-up menu
- 6.6. Display Filter comparison operators
- 6.7. Display Filter Escape Sequences in Character and String Literals
- 6.8. Display Filter Logical Operations
- 6.9. Display Filter Arithmetic Operations
- 6.10. Display Filter Functions
- 7.1. Example expert information items
- 7.2. Time zone examples for UTC arrival times (without DST)
- B.1. Configuration files overview
List of Examples
Table of Contents
Wireshark is the world’s foremost network protocol analyzer, but the rich feature set can be daunting for the unfamiliar. This document is part of an effort by the Wireshark team to improve Wireshark’s usability. We hope that you find it useful and look forward to your comments.
The intended audience of this book is anyone using Wireshark.
This book explains all of the basic and some advanced features of Wireshark. As Wireshark has become a very complex program, not every feature may be explained in this book.
This book is not intended to explain network sniffing in general and it will not provide details about specific network protocols. A lot of useful information regarding these topics can be found at the Wireshark Wiki at https://wiki.wireshark.org/.
By reading this book, you will learn how to install Wireshark, how to use the basic elements of the graphical user interface (such as the menu) and what’s behind some of the advanced features that are not always obvious at first sight. It will hopefully guide you around some common problems that frequently appear for new (and sometimes even advanced) Wireshark users.
The authors would like to thank the whole Wireshark team for their assistance. In particular, the authors would like to thank:
- Gerald Combs, for initiating the Wireshark project and funding to do this documentation.
- Guy Harris, for many helpful hints and a great deal of patience in reviewing this document.
- Gilbert Ramirez, for general encouragement and helpful hints along the way.
The authors would also like to thank the following people for their helpful feedback on this document:
- Pat Eyler, for his suggestions on improving the example on generating a backtrace.
- Martin Regner, for his various suggestions and corrections.
- Graeme Hewson, for many grammatical corrections.
The authors would like to acknowledge those man page and README authors for the Wireshark project from who sections of this document borrow heavily:
-
Scott Renfro from whose
mergecapman page Section D.9, “mergecap: Merging multiple capture files into one” is derived. -
Ashok Narayanan from whose
text2pcapman page Section D.10, “text2pcap: Converting ASCII hexdumps to network captures” is derived.
This book was originally developed by Richard Sharpe with funds provided from the Wireshark Fund. It was updated by Ed Warnicke and more recently redesigned and updated by Ulf Lamping.
It was originally written in DocBook/XML and converted to AsciiDoc by Gerald Combs.
The latest copy of this documentation can always be found at https://www.wireshark.org/docs/wsug_html_chunked/.
Should you have any feedback about this document, please send it to the authors through wireshark-dev[AT]wireshark.org.
The following table shows the typographic conventions that are used in this guide.
Table 1. Typographic Conventions
| Style | Description | Example |
|---|---|---|
Italic |
File names, folder names, and extensions |
C:\Development\wireshark. |
|
Commands, flags, and environment variables |
CMake’s |
|
Commands that should be run by the user |
Run |
Dialog and window buttons |
Press to go to the Moon. |
|
Key |
Keyboard shortcut |
Press Ctrl+Down to move to the next packet. |
Menu item |
Select → to move to the next packet. |
Important and notable items are marked as follows:
![[Warning]](images/warning.svg) |
This is a warning |
|---|---|
|
You should pay attention to a warning, otherwise data loss might occur. |
![[Caution]](images/caution.svg) |
This is a caution |
|---|---|
|
Act carefully (i.e., exercise care). |
![[Important]](images/important.svg) |
This is important information |
|---|---|
|
RTFM - Read The Fine Manual |
![[Tip]](images/tip.svg) |
This is a tip |
|---|---|
|
Tips are helpful for your everyday work using Wireshark. |
![[Note]](images/note.svg) |
This is a note |
|---|---|
|
A note will point you to common mistakes and things that might not be obvious. |
Bourne shell, normal user.
$ # This is a comment
$ git config --global log.abbrevcommit true
Bourne shell, root user.
# # This is a comment
# ninja install
Command Prompt (cmd.exe).
>rem This is a comment
>cd C:\Development
PowerShell.
PS$># This is a comment
PS$> choco list -l
C Source Code.
#include "config.h"

/* This method dissects foos */
static int
dissect_foo_message(tvbuff_t *tvb, packet_info *pinfo _U_, proto_tree *tree _U_, void *data _U_)
{
    /* TODO: implement your dissecting code */
    return tvb_captured_length(tvb);
}
Table of Contents
Wireshark is a network packet analyzer. A network packet analyzer presents captured packet data in as much detail as possible.
You could think of a network packet analyzer as a measuring device for examining what’s happening inside a network cable, just like an electrician uses a voltmeter for examining what’s happening inside an electric cable (but at a higher level, of course).
In the past, such tools were either very expensive, proprietary, or both. However, with the advent of Wireshark, that has changed. Wireshark is available for free, is open source, and is one of the best packet analyzers available today.
Here are some reasons people use Wireshark:
- Network administrators use it to troubleshoot network problems
- Network security engineers use it to examine security problems
- QA engineers use it to verify network applications
- Developers use it to debug protocol implementations
- People use it to learn network protocol internals
Wireshark can also be helpful in many other situations.
The following are some of the many features Wireshark provides:
- Available for UNIX and Windows.
- Capture live packet data from a network interface.
- Open files containing packet data captured with tcpdump/WinDump, Wireshark, and many other packet capture programs.
- Import packets from text files containing hex dumps of packet data.
- Display packets with very detailed protocol information.
- Save packet data captured.
- Export some or all packets in a number of capture file formats.
- Filter packets on many criteria.
- Search for packets on many criteria.
- Colorize packet display based on filters.
- Create various statistics.
- …and a lot more!
However, to really appreciate its power you have to start using it.
Figure 1.1, “Wireshark captures packets and lets you examine their contents.” shows Wireshark having captured some packets and waiting for you to examine them.
Wireshark can capture traffic from many different network media types, including Ethernet, Wireless LAN, Bluetooth, USB, and more. The specific media types supported may be limited by several factors, including your hardware and operating system. An overview of the supported media types can be found at https://wiki.wireshark.org/CaptureSetup/NetworkMedia.
Wireshark can open packet captures from a large number of capture programs. For a list of input formats see Section 5.2.2, “Input File Formats”.
Wireshark can save captured packets in many formats, including those used by other capture programs. For a list of output formats see Section 5.3.2, “Output File Formats”.
There are protocol dissectors (or decoders, as they are known in other products) for a great many protocols: see Section B.5.3, “Windows temporary folder”.
Wireshark is an open source software project, and is released under the GNU General Public License (GPL). You can freely use Wireshark on any number of computers you like, without worrying about license keys or fees or such. In addition, all source code is freely available under the GPL. Because of that, it is very easy for people to add new protocols to Wireshark, either as plugins, or built into the source, and they often do!
Here are some things Wireshark does not provide:
- Wireshark isn’t an intrusion detection system. It will not warn you when someone does strange things on your network that he/she isn’t allowed to do. However, if strange things happen, Wireshark might help you figure out what is really going on.
- Wireshark will not manipulate things on the network, it will only “measure” things from it. Wireshark doesn’t send packets on the network or do other active things (except domain name resolution, but that can be disabled).
The amount of resources Wireshark needs depends on your environment and on the size of the capture file you are analyzing. The values below should be fine for small to medium-sized capture files no more than a few hundred MB. Larger capture files will require more memory and disk space.
|
Busy networks mean large captures |
|---|---|
|
A busy network can produce huge capture files. Capturing on even a 100 megabit network can produce hundreds of megabytes of capture data in a short time. A computer with a fast processor, and lots of memory and disk space is always a good idea. |
If Wireshark runs out of memory it will crash. See https://wiki.wireshark.org/KnownBugs/OutOfMemory for details and workarounds.
Although Wireshark uses a separate process to capture packets, the packet analysis is single-threaded and won’t benefit much from multi-core systems.
Wireshark should support any version of Windows that is still within its extended support lifetime. At the time of writing this includes Windows 11, 10, Server 2022, Server 2019, and Server 2016. It also requires the following:
- The Universal C Runtime. This is included with Windows 10 and Windows Server 2019 and is installed automatically on earlier versions if Microsoft Windows Update is enabled. Otherwise you must install KB2999226 or KB3118401.
- Any modern 64-bit Intel or Arm processor.
- 500 MB available RAM. Larger capture files require more RAM.
- 500 MB available disk space. Capture files require additional disk space.
- Any modern display. 1280 × 1024 or higher resolution is recommended. Wireshark will make use of HiDPI or Retina resolutions if available. Power users will find multiple monitors useful.
-
A supported network card for capturing
- Ethernet. Any card supported by Windows should work. See the wiki pages on Ethernet capture and offloading for issues that may affect your environment.
- 802.11. See the Wireshark wiki page. Capturing raw 802.11 information may be difficult without special equipment.
- Other media. See https://wiki.wireshark.org/CaptureSetup/NetworkMedia.
Older versions of Windows which are outside Microsoft’s extended lifecycle support window are no longer supported. It is often difficult or impossible to support these systems due to circumstances beyond our control, such as third party libraries on which we depend or due to necessary features that are only present in newer versions of Windows such as hardened security or memory management.
- Wireshark 4.4 was the last release branch to officially support Windows 10, version 1607 and Windows Server 2016.
- Wireshark 4.0 was the last release branch to officially support Windows 8.1 and Windows Server 2012.
- Wireshark 3.6 was the last release branch to officially support 32-bit Windows.
- Wireshark 3.2 was the last release branch to officially support Windows 7 and Windows Server 2008 R2.
- Wireshark 2.2 was the last release branch to support Windows Vista and Windows Server 2008 sans R2
- Wireshark 1.12 was the last release branch to support Windows Server 2003.
- Wireshark 1.10 was the last release branch to officially support Windows XP.
See the Wireshark release lifecycle page for more details.
Wireshark supports macOS 11 and later. Similar to Windows, supported macOS versions depend on third party libraries and on Apple’s requirements.
- Wireshark 4.4 was the last release branch to support macOS 11.
- Wireshark 4.2 was the last release branch to support macOS 10.14.
- Wireshark 3.6 was the last release branch to support macOS 10.13.
- Wireshark 3.4 was the last release branch to support macOS 10.12.
- Wireshark 2.6 was the last release branch to support Mac OS X 10.6 and 10.7 and OS X 10.8 to 10.11.
- Wireshark 2.0 was the last release branch to support OS X on 32-bit Intel.
- Wireshark 1.8 was the last release branch to support Mac OS X on PowerPC.
See the Wireshark release lifecycle page for more details.
The system requirements should be comparable to the specifications listed above for Windows.
Wireshark runs on most UNIX and UNIX-like platforms including Linux and most BSD variants. The system requirements should be comparable to the specifications listed above for Windows.
Binary packages are available for most Unices and Linux distributions including the following platforms:
- Alpine Linux
- Arch Linux
- Canonical Ubuntu
- Debian GNU/Linux
- FreeBSD
- Gentoo Linux
- HP-UX
- NetBSD
- OpenPKG
- Oracle Solaris
- Red Hat Enterprise Linux / CentOS / Fedora
If a binary package is not available for your platform you can download the source and try to build it. Please report your experiences to wireshark-dev[AT]wireshark.org.
You can get the latest copy of the program from the Wireshark website at https://www.wireshark.org/download.html. The download page should automatically highlight the appropriate download for your platform and direct you to the nearest mirror. Official Windows and macOS installers are signed by Wireshark Foundation using trusted certificates on those platforms. macOS installers are additionally notarized.
A new Wireshark version typically becomes available every six weeks.
If you want to be notified about new Wireshark releases you should subscribe to the wireshark-announce mailing list. You will find more details in Section 1.6.5, “Mailing Lists”.
Each release includes a list of file hashes which are sent to the wireshark-announce mailing list and placed in a file named SIGNATURES-x.y.z.txt. Announcement messages are archived at https://lists.wireshark.org/archives/wireshark-announce/ and SIGNATURES files can be found at https://www.wireshark.org/download/src/all-versions/. Both are GPG-signed and include verification instructions for Windows, Linux, and macOS. As noted above, you can also verify downloads on Windows and macOS using the code signature validation features on those systems.
In late 1997 Gerald Combs needed a tool for tracking down network problems and wanted to learn more about networking so he started writing Ethereal (the original name of the Wireshark project) as a way to solve both problems.
Ethereal was initially released after several pauses in development in July 1998 as version 0.2.0. Within days patches, bug reports, and words of encouragement started arriving and Ethereal was on its way to success.
Not long after that Gilbert Ramirez saw its potential and contributed a low-level dissector to it.
In October, 1998 Guy Harris was looking for something better than tcpview so he started applying patches and contributing dissectors to Ethereal.
In late 1998 Richard Sharpe, who was giving TCP/IP courses, saw its potential on such courses and started looking at it to see if it supported the protocols he needed. While it didn’t at that point new protocols could be easily added. So he started contributing dissectors and contributing patches.
The list of people who have contributed to the project has become very long since then, and almost all of them started with a protocol that they needed that Wireshark did not already handle. So they copied an existing dissector and contributed the code back to the team.
In 2006 the project moved house and re-emerged under a new name: Wireshark.
In 2008, after ten years of development, Wireshark finally arrived at version 1.0. This release was the first deemed complete, with the minimum features implemented. Its release coincided with the first Wireshark Developer and User Conference, called Sharkfest.
In 2015 Wireshark 2.0 was released, which featured a new user interface.
In 2023 Wireshark moved to the Wireshark Foundation, a nonprofit corporation that operates under section 501(c)(3) of the U.S. tax code. The foundation provides the project’s infrastructure, hosts SharkFest, our developer and user conference, and promotes low level network education.
Wireshark was initially developed by Gerald Combs. Ongoing development and maintenance of Wireshark is handled by the Wireshark team, a loose group of individuals who fix bugs and provide new functionality.
There have also been a large number of people who have contributed protocol dissectors to Wireshark, and it is expected that this will continue. You can find a list of the people who have contributed code to Wireshark by checking the about dialog box of Wireshark, or at the authors page on the Wireshark web site.
Wireshark is an open source software project, and is released under the GNU General Public License (GPL) version 2. All source code is freely available under the GPL. You are welcome to modify Wireshark to suit your own needs, and it would be appreciated if you contribute your improvements back to the Wireshark team.
You gain three benefits by contributing your improvements back to the community:
- Other people who find your contributions useful will appreciate them, and you will know that you have helped people in the same way that the developers of Wireshark have helped you.
- The developers of Wireshark can further improve your changes or implement additional features on top of your code, which may also benefit you.
- The maintainers and developers of Wireshark will maintain your code, fixing it when API changes or other changes are made, and generally keeping it in tune with what is happening with Wireshark. So when Wireshark is updated (which is often), you can get a new Wireshark version from the website and your changes will already be included without any additional effort from you.
The Wireshark source code and binary kits for some platforms are all available on the download page of the Wireshark website: https://www.wireshark.org/download.html.
If you have problems or need help with Wireshark there are several places that may be of interest (besides this guide, of course).
You will find lots of useful information on the Wireshark homepage at https://www.wireshark.org/.
The Wireshark Wiki at https://wiki.wireshark.org/ provides a wide range of information related to Wireshark and packet capture in general. You will find a lot of information not part of this user’s guide. For example, it contains an explanation how to capture on a switched network, an ongoing effort to build a protocol reference, protocol-specific information, and much more.
And best of all, if you would like to contribute your knowledge on a specific topic (maybe a network protocol you know well), you can edit the wiki pages with your web browser.
The Wireshark Q&A site at https://ask.wireshark.org/ offers a resource where questions and answers come together. You can search for questions asked before and see what answers were given by people who knew about the issue. Answers are ranked, so you can easily pick out the best ones. If your question hasn’t been discussed before you can post one yourself.
The Frequently Asked Questions lists often asked questions and their corresponding answers.
|
Read the FAQ |
|---|---|
|
Before sending any mail to the mailing lists below, be sure to read the FAQ. It will often answer any questions you might have. This will save yourself and others a lot of time. Keep in mind that a lot of people are subscribed to the mailing lists. |
You will find the FAQ inside Wireshark by clicking the menu item Help/Contents and selecting the FAQ page in the dialog shown.
An online version is available at the Wireshark website at https://www.wireshark.org/faq.html. You might prefer this online version, as it’s typically more up to date and the HTML format is easier to use.
There are several mailing lists of specific Wireshark topics available:
- wireshark-announce
- Information about new program releases, which usually appear about every six weeks.
- wireshark-users
- Topics of interest to users of Wireshark. People typically post questions about using Wireshark and others (hopefully) provide answers.
- wireshark-dev
- Topics of interest to developers of Wireshark. If you want to develop a protocol dissector or update the user interface, join this list.
You can subscribe to each of these lists from the Wireshark web site: https://www.wireshark.org/lists/. From there, you can choose which mailing list you want to subscribe to by clicking on the Subscribe/Unsubscribe/Options button under the title of the relevant list. The links to the archives are included on that page as well.
|
The lists are archived |
|---|---|
|
You can search in the list archives to see if someone asked the same question some time before and maybe already got an answer. That way you don’t have to wait until someone answers your question. |
|
Note |
|---|---|
|
Before reporting any problems, please make sure you have installed the latest version of Wireshark. |
When reporting problems with Wireshark please supply the following information:
- The version number of Wireshark and the dependent libraries linked with it, such as Qt or GLib. You can obtain this from Wireshark’s about box or the command wireshark -v.
- Information about the platform you run Wireshark on (Windows, Linux, etc. and 32-bit, 64-bit, etc.).
- A detailed description of your problem.
- If you get an error/warning message, copy the text of that message (and also a few lines before and after it, if there are some) so others may find the place where things go wrong. Please don’t give something like: “I get a warning while doing x” as this won’t give a good idea where to look.
|
Don’t send confidential information! |
|---|---|
|
If you send capture files to the mailing lists be sure they don’t contain any sensitive or confidential information like passwords or personally identifiable information (PII). In many cases you can use a tool like TraceWrangler to sanitize a capture file before sharing it. |
|
Don’t send large files |
|---|---|
|
Do not send large files (> 1 MB) to the mailing lists. Instead, provide a download link. For bugs and feature requests, you can create an issue on GitLab Issues and upload the file there. |
If you use AI tools to help find or draft a bug report, please mention that and make sure you have personally verified the steps and details before submitting. Purely AI-generated reports are not supported and might be closed; a quick human check keeps triage efficient for everyone.
When reporting crashes with Wireshark it is helpful if you supply the traceback information along with the information mentioned in “Reporting Problems”.
You can obtain this traceback information with the following commands on UNIX or Linux (note the backticks):
$ gdb `whereis wireshark | cut -f2 -d: | cut -d' ' -f2` core >& backtrace.txt
backtrace
^D
If you do not have gdb available, you will have to check out your operating system’s debugger.
Email backtrace.txt to wireshark-dev[AT]wireshark.org.
The Windows distributions don’t contain the symbol files (.pdb) because they are very large. You can download them separately at https://www.wireshark.org/download/win64/all-versions/ .
Table of Contents
As with all things there must be a beginning and so it is with Wireshark. To use Wireshark you must first install it. If you are running Windows or macOS you can download an official release at https://www.wireshark.org/download.html, install it, and skip the rest of this chapter.
If you are running another operating system such as Linux or FreeBSD you might want to install from source. Several Linux distributions offer Wireshark packages but they commonly provide out-of-date versions. No other versions of UNIX ship Wireshark so far. For that reason, you will need to know where to get the latest version of Wireshark and how to install it.
This chapter shows you how to obtain source and binary packages and how to build Wireshark from source should you choose to do so.
The general steps are the following:
- Download the relevant package for your needs, e.g., source or binary distribution.
- For source distributions, compile the source into a binary. This may involve building and/or installing other necessary packages.
- Install the binaries into their final destinations.
You can obtain both source and binary distributions from the Wireshark main page or the download page at https://www.wireshark.org/download.html. Select the package most appropriate for your system.
The official Windows packages can be downloaded from the Wireshark main page or the download page. Installer names contain the version and platform. For example, Wireshark-4.7.3-x64.exe installs Wireshark 4.7.3 for Windows on 64-bit Intel processors. The Wireshark installer includes Npcap which is required for packet capture. Windows packages automatically update. See Section 2.8, “Updating Wireshark” for details.
Simply download the Wireshark installer from https://www.wireshark.org/download.html and execute it. Official packages are signed by Wireshark Foundation. You can choose to install several optional components and select the location of the installed package. The default settings are recommended for most users.
On the Choose Components page of the installer you can select from the following:
- Wireshark - The network protocol analyzer that we all know and mostly love.
- TShark - A command-line network protocol analyzer. If you haven’t tried it you should.
-
External Capture (extcap) - External Capture Interfaces
- Androiddump - Provide capture interfaces from Android devices.
- Etwdump - Provide an interface to read Event Tracing for Windows (ETW) event trace (ETL).
- Randpktdump - Provide an interface to the random packet generator. (see also randpkt)
- Sshdump, Ciscodump, and Wifidump - Provide remote capture through SSH. (tcpdump, Cisco EPC, wifi)
- UDPdump - Provide capture interface to receive UDP packets streamed from network devices.
- Wireshark Start Menu Item - Add a shortcut to the start menu.
- Wireshark Desktop Icon - Add a Wireshark icon to the desktop.
- Associate trace file extensions with Wireshark - Associate standard network trace files to Wireshark.
By default Wireshark installs into %ProgramFiles%\Wireshark on 32-bit Windows
and %ProgramFiles64%\Wireshark on 64-bit Windows. This expands to C:\Program
Files\Wireshark on most systems.
The Wireshark installer contains the latest Npcap installer.
If you don’t have Npcap installed you won’t be able to capture live network traffic but you will still be able to open saved capture files. By default the latest version of Npcap will be installed. If you don’t wish to do this or if you wish to reinstall Npcap you can check the Install Npcap box as needed.
For more information about Npcap see https://npcap.com/ and https://wiki.wireshark.org/Npcap.
For special cases, there are some command line parameters available:
-
/Sruns the installer or uninstaller silently with default values. The silent installer will not install Npcap. -
/desktopiconinstallation of the desktop icon,=yes- force installation,=no- don’t install, otherwise use default settings. This option can be useful for a silent installer. -
/Dsets the default installation directory ($INSTDIR), overriding InstallDir and InstallDirRegKey. It must be the last parameter used in the command line and must not contain any quotes even if the path contains spaces. -
/NCRCdisables the CRC check. We recommend against using this flag. -
/EXTRACOMPONENTScomma separated list of optional components to install. The following extcap binaries are supported.-
androiddump- Provide interfaces to capture from Android devices -
ciscodump- Provide interfaces to capture from a remote Cisco router through SSH -
randpktdump- Provide an interface to generate random captures using randpkt -
sshdump- Provide interfaces to capture from a remote host through SSH using a remote capture binary -
udpdump- Provide a UDP receiver that gets packets from network devices
-
Example:
> Wireshark-4.2.5-x64.exe /NCRC /S /desktopicon=yes /D=C:\Program Files\Foo > Wireshark-4.2.5-x64.exe /S /EXTRACOMPONENTS=sshdump,udpdump
Running the installer without any parameters shows the normal interactive installer.
As mentioned above, the Wireshark installer also installs Npcap. If you prefer to install Npcap manually or want to use a different version than the one included in the Wireshark installer, you can download Npcap from the main Npcap site at https://npcap.com/.
Wireshark updates may also include a new version of Npcap. Manual Npcap updates instructions can be found on the Npcap web site at https://npcap.com/. You may have to reboot your machine after installing a new Npcap version.
You can uninstall Wireshark using the Programs and Features control panel. Select the “Wireshark” entry to start the uninstallation procedure.
The Wireshark uninstaller provides several options for removal. The default is to remove the core components but keep your personal settings and Npcap. Npcap is kept in case other programs need it.
We strongly recommended using the binary installer for Windows unless you want to start developing Wireshark on the Windows platform.
For further information how to obtain sources and build Wireshark for Windows from the sources see the Developer’s Guide at:
You may also want to have a look at the Development Wiki (https://wiki.wireshark.org/Development) for the latest available development documentation.
The official macOS packages can be downloaded from the Wireshark main page or the download page. They are signed by Wireshark Foundation. Packages are distributed as disk images (.dmg) containing the application bundle. Package names contain the platform and version. To install Wireshark simply open the disk image and drag Wireshark to your /Applications folder. macOS packages automatically update. See Section 2.8, “Updating Wireshark” for details.
In order to capture packets, you must install the “ChmodBPF” launch daemon. You can do so by opening the Install ChmodBPF.pkg file in the Wireshark .dmg or from Wireshark itself by opening → selecting the “Folders” tab, and double-clicking “macOS Extras”.
The installer package includes Wireshark along with ChmodBPF and system path packages. See the included Read me first.html file for more details.
In general installing the binary under your version of UNIX will be specific to the installation methods used with your version of UNIX. For example, under AIX, you would use smit to install the Wireshark binary package, while under Tru64 UNIX (formerly Digital UNIX) you would use setld.
Building RPMs from Wireshark’s source code results in several packages (most distributions follow the same system):
-
The
wiresharkpackage contains the core Wireshark libraries and command-line tools. -
The
wiresharkorwireshark-qtpackage contains the Qt-based GUI.
Many distributions use yum or a similar package management tool to make
installation of software (including its dependencies) easier. If your
distribution uses yum, use the following command to install Wireshark
together with the Qt GUI:
yum install wireshark wireshark-qt
If you’ve built your own RPMs from the Wireshark sources you can install them by running, for example:
rpm -ivh wireshark-2.0.0-1.x86_64.rpm wireshark-qt-2.0.0-1.x86_64.rpm
If the above command fails because of missing dependencies, install the dependencies first, and then retry the step above.
If you can just install from the repository then use
apt install wireshark
Apt should take care of all of the dependency issues for you.
|
Capturing requires privileges |
|---|---|
|
By installing Wireshark packages non-root, users won’t gain rights automatically to capture packets. To allow non-root users to capture packets follow the procedure described in https://gitlab.com/wireshark/wireshark/-/blob/master/packaging/debian/README.Debian (/usr/share/doc/wireshark-common/README.Debian.gz) |
Use the following command to install Wireshark under Gentoo Linux with all of the extra features:
USE="c-ares ipv6 snmp ssl kerberos threads selinux" emerge wireshark
We recommended using the binary installer for your platform unless you want to start developing Wireshark.
Building Wireshark requires the proper build environment including a compiler and many supporting libraries. For more information, see the Developer’s Guide at:
By default, Wireshark on Windows and macOS will check for new versions and notify you when they are available. If you have the Check for updates preference disabled or if you run Wireshark in an isolated environment you should subscribe to the wireshark-announce mailing list to be notified of new versions. See Section 1.6.5, “Mailing Lists” for details on subscribing to this list.
New versions of Wireshark are usually released every four to six weeks. Updating Wireshark is done the same way as installing it. Simply download and run the installer on Windows, or download and drag the application on macOS. A reboot is usually not required and all your personal settings will remain unchanged.
We offer two update channels, Stable and Development. The Stable channel is the default, and only installs packages from stable (even-numbered) release branches. The Development channel installs development and release candidate packages when they are available, and stable releases otherwise. To configure your release channel, go to → and search for “update.channel”. See Section 11.5, “Preferences” for details.
Table of Contents
- 3.1. Introduction
- 3.2. Start Wireshark
- 3.3. The Main window
- 3.4. The Menu
- 3.5. The “File” Menu
- 3.6. The “Edit” Menu
- 3.7. The “View” Menu
- 3.8. The “Go” Menu
- 3.9. The “Capture” Menu
- 3.10. The “Analyze” Menu
- 3.11. The “Statistics” Menu
- 3.12. The “Telephony” Menu
- 3.13. The “Wireless” Menu
- 3.14. The “Tools” Menu
- 3.15. The “Help” Menu
- 3.16. The “Main” Toolbar
- 3.17. The “Filter” Toolbar
- 3.18. The “Packet List” Pane
- 3.19. The “Packet Details” Pane
- 3.20. The “Packet Bytes” Pane
- 3.21. The “Packet Diagram” Pane
- 3.22. The Statusbar
By now you have installed Wireshark and are likely keen to get started capturing your first packets. In the next chapters we will explore:
- How the Wireshark user interface works
- How to capture packets in Wireshark
- How to view packets in Wireshark
- How to filter packets in Wireshark
- … and many other things!
You can start Wireshark from your shell or window manager.
|
Power user tip |
|---|---|
|
When starting Wireshark it’s possible to specify optional settings using the command line. See Section 11.2, “Start Wireshark from the command line” for details. |
The following chapters contain many screenshots of Wireshark. As Wireshark runs on many different platforms with many different window managers, different styles applied and there are different versions of the underlying GUI toolkit used, your screen might look different from the provided screenshots. But as there are no real differences in functionality these screenshots should still be well understandable.
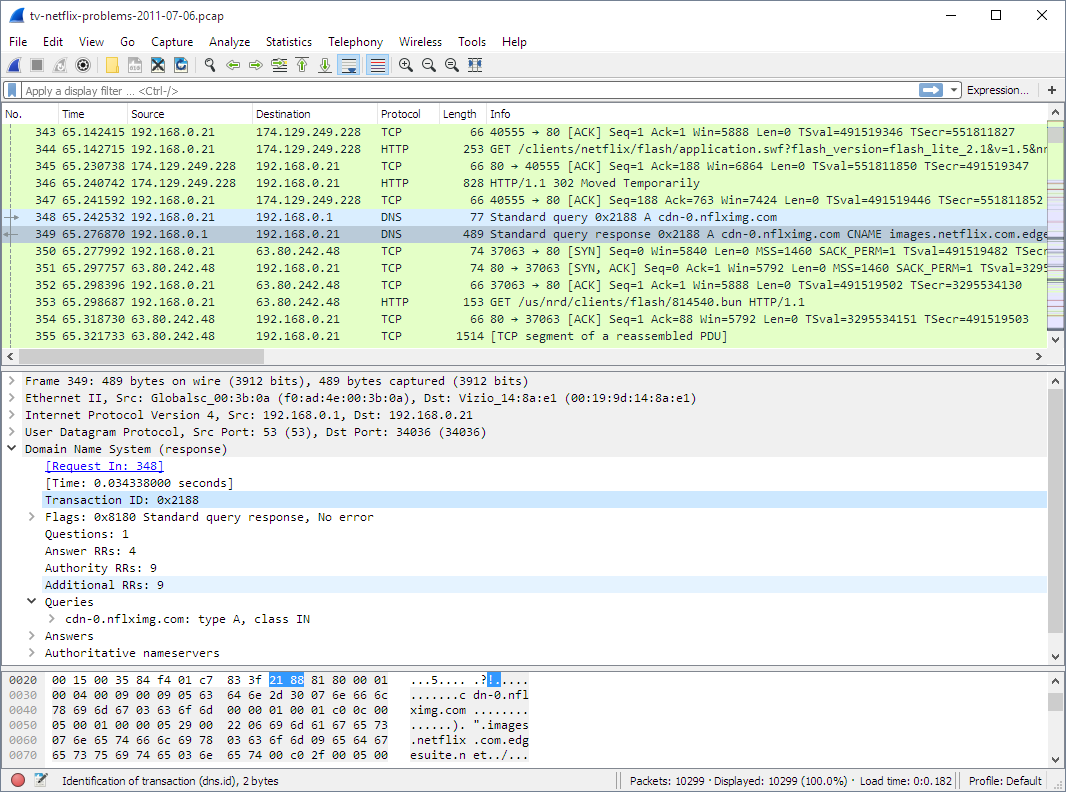
Let’s look at Wireshark’s user interface. Figure 3.1, “The Main window” shows Wireshark as you would usually see it after some packets are captured or loaded (how to do this will be described later).
Wireshark’s main window consists of parts that are commonly known from many other GUI programs.
- The menu (see Section 3.4, “The Menu”) is used to start actions.
- The main toolbar (see Section 3.16, “The “Main” Toolbar”) provides quick access to frequently used items from the menu.
- The filter toolbar (see Section 3.17, “The “Filter” Toolbar”) allows users to set display filters to filter which packets are displayed (see Section 6.3, “Filtering Packets While Viewing”).
- The packet list pane (see Section 3.18, “The “Packet List” Pane”) displays a summary of each packet captured. By clicking on packets in this pane you control what is displayed in the other two panes.
- The packet details pane (see Section 3.19, “The “Packet Details” Pane”) displays the packet selected in the packet list pane in more detail.
- The packet bytes pane (see Section 3.20, “The “Packet Bytes” Pane”) displays the data from the packet selected in the packet list pane, and highlights the field selected in the packet details pane.
- The packet diagram pane (see Section 3.21, “The “Packet Diagram” Pane”) displays the packet selected in the packet list as a textbook-style diagram.
- The statusbar (see Section 3.22, “The Statusbar”) shows some detailed information about the current program state and the captured data.
|
Tip |
|---|---|
|
The layout of the main window can be customized by changing preference settings. See Section 11.5, “Preferences” for details. |
Packet list and detail navigation can be done entirely from the keyboard. Table 3.1, “Keyboard Navigation” shows a list of keystrokes that will let you quickly move around a capture file. See Table 3.6, “Go menu items” for additional navigation keystrokes.
Table 3.1. Keyboard Navigation
| Accelerator | Description |
|---|---|
Tab or Shift+Tab |
Move between screen elements, e.g., from the toolbars to the packet list to the packet detail. |
↓ |
Move to the next packet or detail item. |
↑ |
Move to the previous packet or detail item. |
Ctrl+↓ or F8 |
Move to the next packet, even if the packet list isn’t focused. |
Ctrl+↑ or F7 |
Move to the previous packet, even if the packet list isn’t focused. |
Ctrl+. |
Move to the next packet of the conversation (TCP, UDP or IP). |
Ctrl+, |
Move to the previous packet of the conversation (TCP, UDP or IP). |
Alt+→ or Option+→ (macOS) |
Move to the next packet in the selection history. |
Alt+← or Option+← (macOS) |
Move to the previous packet in the selection history. |
← |
In the packet detail, closes the selected tree item. If it’s already closed, jumps to the parent node. |
→ |
In the packet detail, opens the selected tree item. |
Shift+→ |
In the packet detail, opens the selected tree item and all of its subtrees. |
Ctrl+→ |
In the packet detail, opens all tree items. |
Ctrl+← |
In the packet detail, closes all tree items. |
Backspace |
In the packet detail, jumps to the parent node. |
Return or Enter |
In the packet detail, toggles the selected tree item. |
→ → will show a list of all shortcuts in the main window. Additionally, typing anywhere in the main window will start filling in a display filter.
Wireshark’s main menu is located either at the top of the main window (Windows, Linux) or at the top of your main screen (macOS). An example is shown in Figure 3.2, “The Menu”.
|
Note |
|---|---|
|
Some menu items will be disabled (greyed out) if the corresponding feature isn’t available. For example, you cannot save a capture file if you haven’t captured or loaded any packets. |

The main menu contains the following items:
- This menu contains items to open and merge capture files, save, print, or export capture files in whole or in part, and to quit the Wireshark application. See Section 3.5, “The “File” Menu”.
- This menu contains items to find a packet, time reference or mark one or more packets, handle configuration profiles, and set your preferences; (cut, copy, and paste are not presently implemented). See Section 3.6, “The “Edit” Menu”.
- This menu controls the display of the captured data, including colorization of packets, zooming the font, showing a packet in a separate window, expanding and collapsing trees in packet details, …. See Section 3.7, “The “View” Menu”.
- This menu contains items to go to a specific packet. See Section 3.8, “The “Go” Menu”.
- This menu allows you to start and stop captures and to edit capture filters. See Section 3.9, “The “Capture” Menu”.
- This menu contains items to manipulate display filters, enable or disable the dissection of protocols, configure user specified decodes and follow a TCP stream. See Section 3.10, “The “Analyze” Menu”.
- This menu contains items to display various statistic windows, including a summary of the packets that have been captured, display protocol hierarchy statistics and much more. See Section 3.11, “The “Statistics” Menu”.
- This menu contains items to display various telephony related statistic windows, including a media analysis, flow diagrams, display protocol hierarchy statistics and much more. See Section 3.12, “The “Telephony” Menu”.
- This menu contains items to display Bluetooth and IEEE 802.11 wireless statistics.
- This menu contains various tools available in Wireshark, such as creating Firewall ACL Rules. See Section 3.14, “The “Tools” Menu”.
- This menu contains items to help the user, e.g., access to some basic help, manual pages of the various command line tools, online access to some of the webpages, and the usual about dialog. See Section 3.15, “The “Help” Menu”.
Each of these menu items is described in more detail in the sections that follow.
|
Shortcuts make life easier |
|---|---|
|
Most common menu items have keyboard shortcuts. For example, you can press the Control and the K keys together to open the “Capture Options” dialog. |
The Wireshark file menu contains the fields shown in Table 3.2, “File menu items”.
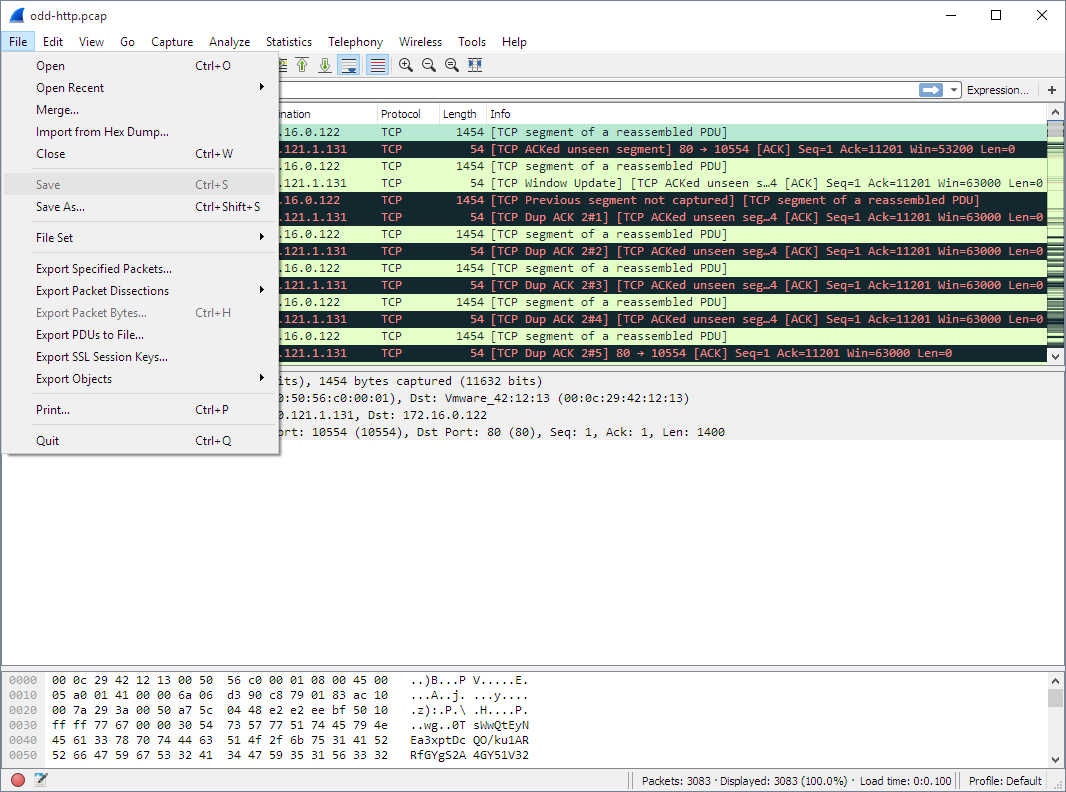
Table 3.2. File menu items
| Menu Item | Accelerator | Description |
|---|---|---|
Ctrl+O |
This shows the file open dialog box that allows you to load a capture file for viewing. It is discussed in more detail in Section 5.2.1, “The “Open Capture File” Dialog Box”. |
|
This lets you open recently opened capture files. Clicking on one of the submenu items will open the corresponding capture file directly. |
||
This menu item lets you merge a capture file into the currently loaded one. It is discussed in more detail in Section 5.4, “Merging Capture Files”. |
||
This menu item brings up the import file dialog box that allows you to import a text file containing a hex dump into a new temporary capture. It is discussed in more detail in Section 5.5, “Import Hex Dump”. |
||
Ctrl+W |
This menu item closes the current capture. If you haven’t saved the capture, you will be asked to do so first (this can be disabled by a preference setting). |
|
Ctrl+S |
This menu item saves the current capture. If you have not set a default capture file name (perhaps with the -w <capfile> option), Wireshark pops up the Save Capture File As dialog box (which is discussed further in Section 5.3.1, “The “Save Capture File As” Dialog Box”). If you have already saved the current capture, this menu item will be greyed out. You cannot save a live capture while the capture is in progress. You must stop the capture in order to save. |
|
Shift+Ctrl+S |
This menu item allows you to save the current capture file to whatever file you would like. It pops up the Save Capture File As dialog box (which is discussed further in Section 5.3.1, “The “Save Capture File As” Dialog Box”). |
|
→ |
This menu item allows you to show a list of files in a file set. It pops up the Wireshark List File Set dialog box (which is discussed further in Section 5.6, “File Sets”). |
|
→ |
If the currently loaded file is part of a file set, jump to the next file in the set. If it isn’t part of a file set or just the last file in that set, this item is greyed out. |
|
→ |
If the currently loaded file is part of a file set, jump to the previous file in the set. If it isn’t part of a file set or just the first file in that set, this item is greyed out. |
|
This menu item allows you to export all (or some) of the packets in the capture file to file. It pops up the Wireshark Export dialog box (which is discussed further in Section 5.7, “Exporting Data”). |
||
Ctrl+H |
These menu items allow you to export the currently selected bytes in the packet bytes pane to a text file in a number of formats including plain, CSV, and XML. It is discussed further in Section 5.7.3, “The “Export Selected Packet Bytes” Dialog Box”. |
|
These menu items allow you to export captured DICOM, FTP-DATA, HTTP, IMF, SMB, or TFTP objects into local files. It pops up a corresponding object list (which is discussed further in Section 5.7.7, “The “Export Objects” Dialog Box”) |
||
Ctrl+P |
This menu item allows you to print all (or some) of the packets in the capture file. It pops up the Wireshark Print dialog box (which is discussed further in Section 5.8, “Printing Packets”). |
|
Ctrl+Q |
This menu item allows you to quit from Wireshark. Wireshark will ask to save your capture file if you haven’t previously saved it (this can be disabled by a preference setting). |
The Wireshark Edit menu contains the fields shown in Table 3.3, “Edit menu items”.
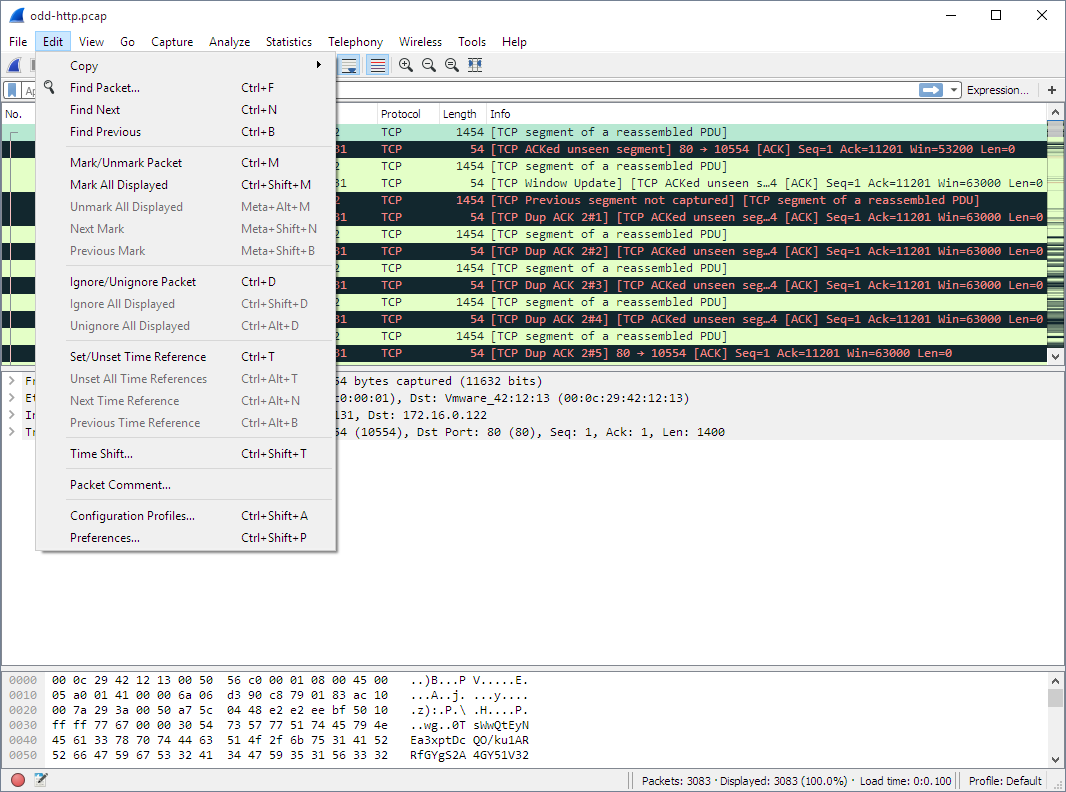
Table 3.3. Edit menu items
| Menu Item | Accelerator | Description |
|---|---|---|
These menu items will copy the packet list, packet detail, or properties of the currently selected packet to the clipboard. |
||
Ctrl+F |
This menu item brings up a toolbar that allows you to find a packet by many criteria. There is further information on finding packets in Section 6.8, “Finding Packets”. |
|
Ctrl+N |
This menu item tries to find the next packet matching the settings from “Find Packet…”. |
|
Ctrl+B |
This menu item tries to find the previous packet matching the settings from “Find Packet…”. |
|
Ctrl+M |
This menu item marks the currently selected packet. See Section 6.10, “Marking Packets” for details. |
|
Ctrl+Shift+M |
This menu item marks all displayed packets. |
|
Ctrl+Alt+M |
This menu item unmarks all displayed packets. |
|
Ctrl+Shift+N |
Find the next marked packet. |
|
Ctrl+Shift+B |
Find the previous marked packet. |
|
Ctrl+D |
This menu item marks the currently selected packet as ignored. See Section 6.11, “Ignoring Packets” for details. |
|
Ctrl+Shift+D |
This menu item marks all displayed packets as ignored. |
|
Ctrl+Alt+D |
This menu item unmarks all ignored packets. |
|
Ctrl+T |
This menu item set a time reference on the currently selected packet. See Section 6.12.1, “Packet Time Referencing” for more information about the time referenced packets. |
|
Ctrl+Alt+T |
This menu item removes all time references on the packets. |
|
Ctrl+Alt+N |
This menu item tries to find the next time referenced packet. |
|
Ctrl+Alt+B |
This menu item tries to find the previous time referenced packet. |
|
Ctrl+Shift+T |
Opens the “Time Shift” dialog, which allows you to adjust the timestamps of some or all packets. |
|
Ctrl+Alt+C |
Opens the “Packet Comment” dialog, which lets you add a comment to a single packet. Note that the ability to save packet comments depends on your file format. E.g., pcapng supports comments, pcap does not. |
|
This will delete all comments from all packets. Note that the ability to save capture comments depends on your file format. E.g., pcapng supports comments, pcap does not. |
||
Embeds the used TLS decryption secrets into the capture file, which lets TLS be decrypted without having the separate keylog file. Note that the ability to save decryption secrets depends on your file format. E.g., pcapng supports Decryption Secrets Blocks, pcap does not. |
||
Embeds the used ESP decryption secrets into the capture file, which lets ESP be decrypted without having the esp_sa file configured. Note that the ability to save decryption secrets depends on your file format. E.g., pcapng supports Decryption Secrets Blocks, pcap does not. |
||
This will discard all embedded decryption secrets from the capture file. Note that the ability to save decryption secrets depends on your file format. E.g., pcapng supports Decryption Secrets Blocks, pcap does not. |
||
Ctrl+Shift+A |
This menu item brings up a dialog box for handling configuration profiles. More detail is provided in Section 11.6, “Configuration Profiles”. |
|
Ctrl+Shift+P or Cmd+, (macOS) |
This menu item brings up a dialog box that allows you to set preferences for many parameters that control Wireshark. You can also save your preferences so Wireshark will use them the next time you start it. More detail is provided in Section 11.5, “Preferences”. |
The Wireshark View menu contains the fields shown in Table 3.4, “View menu items”.
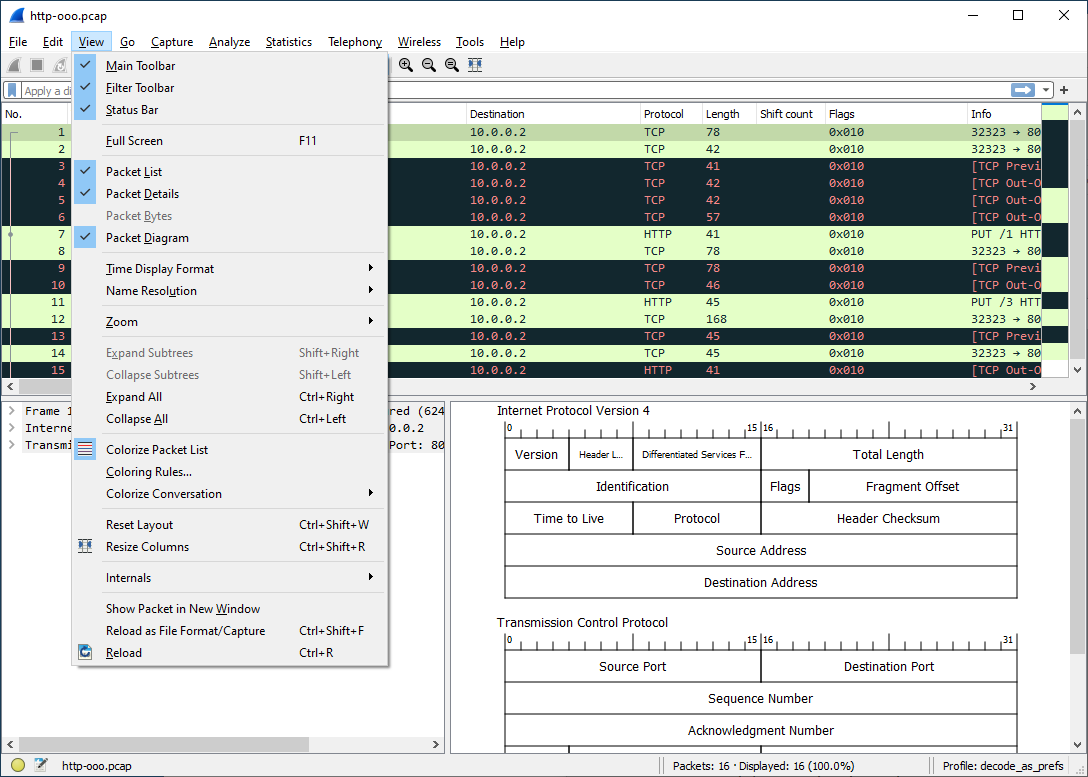
Table 3.4. View menu items
| Menu Item | Accelerator | Description |
|---|---|---|
This menu item hides or shows the main toolbar, see Section 3.16, “The “Main” Toolbar”. |
||
This menu item hides or shows the filter toolbar, see Section 3.17, “The “Filter” Toolbar”. |
||
This menu item hides or shows the wireless toolbar. May not be present on some platforms. |
||
This menu item hides or shows the statusbar, see Section 3.22, “The Statusbar”. |
||
This menu item hides or shows the packet list pane, see Section 3.18, “The “Packet List” Pane”. |
||
This menu item hides or shows the packet details pane, see Section 3.19, “The “Packet Details” Pane”. |
||
This menu item hides or shows the packet bytes pane, see Section 3.20, “The “Packet Bytes” Pane”. |
||
This menu item hides or shows the packet diagram pane. See Section 3.21, “The “Packet Diagram” Pane”. |
||
→ |
Selecting this tells Wireshark to display the time stamps in date and time of day format, see Section 6.12, “Time Display Formats And Time References”. The fields “Time of Day”, “Date and Time of Day”, “Seconds Since First Captured Packet”, “Seconds Since Previous Captured Packet” and “Seconds Since Previous Displayed Packet” are mutually exclusive. |
|
→ |
Selecting this tells Wireshark to display time stamps in time of day format, see Section 6.12, “Time Display Formats And Time References”. |
|
→ |
Selecting this tells Wireshark to display time stamps in seconds since 1970-01-01 00:00:00, see Section 6.12, “Time Display Formats And Time References”. |
|
→ |
Selecting this tells Wireshark to display time stamps in seconds since first captured packet format, see Section 6.12, “Time Display Formats And Time References”. |
|
→ |
Selecting this tells Wireshark to display time stamps in seconds since previous captured packet format, see Section 6.12, “Time Display Formats And Time References”. |
|
→ |
Selecting this tells Wireshark to display time stamps in seconds since previous displayed packet format, see Section 6.12, “Time Display Formats And Time References”. |
|
→ |
Selecting this tells Wireshark to display time stamps with the precision given by the capture file format used, see Section 6.12, “Time Display Formats And Time References”. The fields “Automatic”, “Seconds” and “…seconds” are mutually exclusive. |
|
→ |
Selecting this tells Wireshark to display time stamps with a precision of one second, see Section 6.12, “Time Display Formats And Time References”. |
|
→ |
Selecting this tells Wireshark to display time stamps with a precision of one second, decisecond, centisecond, millisecond, microsecond or nanosecond, see Section 6.12, “Time Display Formats And Time References”. |
|
→ |
Selecting this tells Wireshark to display time stamps in seconds, with hours and minutes. |
|
→ |
This item allows you to manually enter names to resolve IP addresses in the current packet, see Section 7.9, “Name Resolution”. |
|
→ |
This item allows you to control whether or not Wireshark translates MAC addresses into names, see Section 7.9, “Name Resolution”. |
|
→ |
This item allows you to control whether or not Wireshark translates network addresses into names, see Section 7.9, “Name Resolution”. |
|
→ |
This item allows you to control whether or not Wireshark translates transport addresses into names, see Section 7.9, “Name Resolution”. |
|
Ctrl++ or Ctrl+= |
Zoom into the packet data (increase the font size). |
|
Ctrl+- |
Zoom out of the packet data (decrease the font size). |
|
Ctrl+0 |
Set zoom level back to 100% (set font size back to normal). |
|
Shift+→ |
This menu item expands the currently selected subtree in the packet details tree. |
|
Shift+← |
This menu item collapses the currently selected subtree in the packet details tree. |
|
Ctrl+→ |
Wireshark keeps a list of all the protocol subtrees that are expanded, and uses it to ensure that the correct subtrees are expanded when you display a packet. This menu item expands all subtrees in all packets in the capture. |
|
Ctrl+← |
This menu item collapses the tree view of all packets in the capture list. |
|
|
This item allows you to control whether or not Wireshark should colorize the packet list. Enabling colorization will slow down the display of new packets while capturing or loading capture files. |
||
This menu item brings up a submenu that allows you to color packets in the packet list pane based on the addresses of the currently selected packet. This makes it easy to distinguish packets belonging to different conversations. Section 11.3, “Packet colorization”. |
||
→ |
These menu items enable one of the ten temporary color filters based on the currently selected conversation. |
|
→ |
This menu item clears all temporary coloring rules. |
|
→ |
This menu item opens a dialog window in which a new permanent coloring rule can be created based on the currently selected conversation. |
|
This menu item brings up a dialog box that allows you to color packets in the packet list pane according to filter expressions you choose. It can be very useful for spotting certain types of packets, see Section 11.3, “Packet colorization”. |
||
Shift+Ctrl+R |
Resize all column widths so the content will fit into it. Resizing may take a significant amount of time, especially if a large capture file is loaded. |
|
Information about various internal data structures. See Table 3.5, “Internals menu items” below for more information. |
||
Shows the selected packet in a separate window. The separate window shows only the packet details and bytes of that packet, and will continue to do so even if another packet is selected in the main window. See Figure 6.2, “Viewing a packet in a separate window” for details. |
||
This menu item redissects the current packets. This can be useful if name resolution or decryption information has changed. |
||
Shift+Ctrl+F |
This menu item allows you to switch between viewing the list of frames contained in the current capture file (normal mode) and viewing its internal structure, if supported for the current file type. |
|
Ctrl+R |
This menu item allows you to reload the current capture file. |
Table 3.5. Internals menu items
| Menu Item | Description |
|---|---|
Shows the tuples (address and port combinations) used to identify each conversation. |
|
Shows tables of subdissector relationships. |
|
Displays supported protocols and protocol fields. |
The Wireshark Go menu contains the fields shown in Table 3.6, “Go menu items”.
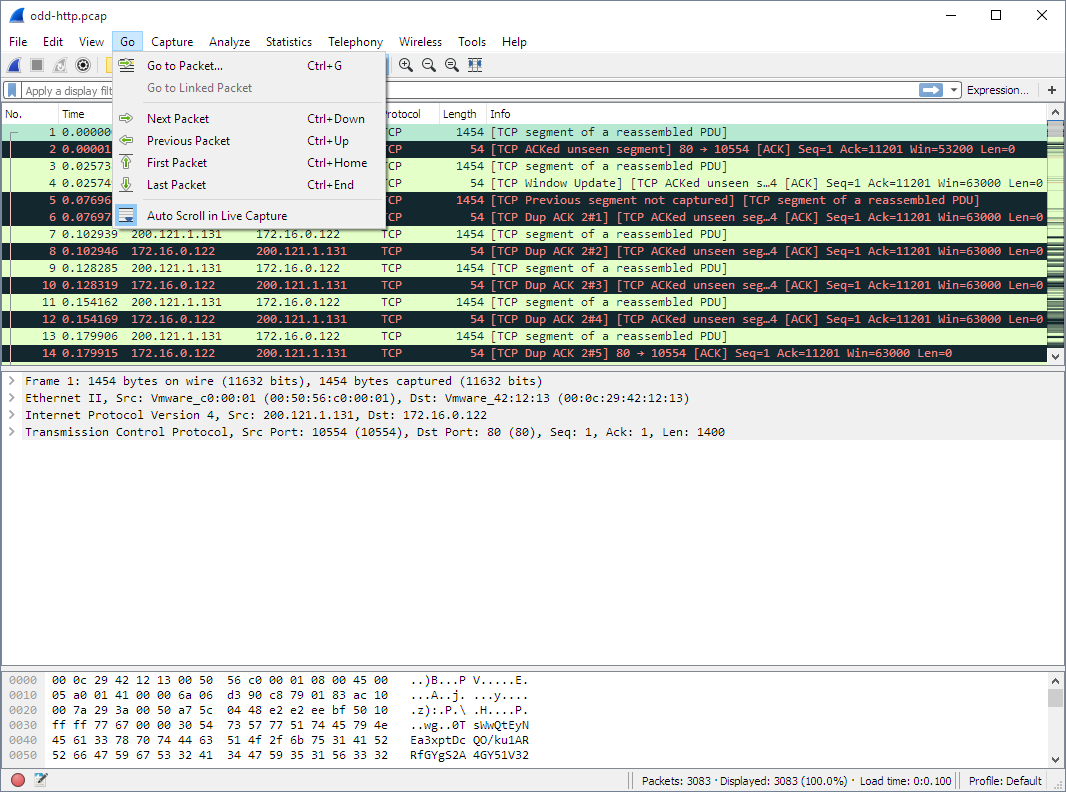
Table 3.6. Go menu items
| Menu Item | Accelerator | Description |
|---|---|---|
Ctrl+G |
Bring up a window frame that allows you to specify a packet number, and then goes to that packet. See Section 6.9, “Go To A Specific Packet” for details. |
|
Go to the corresponding packet of the currently selected protocol field (e.g., the reply corresponding to a request packet, or vice versa). If the selected field doesn’t correspond to a packet, this item is greyed out. |
||
Ctrl+↓ |
Move to the next packet in the list. This can be used to move to the next packet even if the packet list doesn’t have keyboard focus. |
|
Ctrl+↑ |
Move to the previous packet in the list. This can be used to move to the previous packet even if the packet list doesn’t have keyboard focus. |
|
Ctrl+Home |
Jump to the first packet of the capture file. |
|
Ctrl+End |
Jump to the last packet of the capture file. |
|
Ctrl+. |
Move to the next packet in the current conversation. This can be used to move to the next packet even if the packet list doesn’t have keyboard focus. |
|
Ctrl+, |
Move to the previous packet in the current conversation. This can be used to move to the previous packet even if the packet list doesn’t have keyboard focus. |
|
Move to the first packet in the current conversation. This can be used to move to the first packet even if the packet list doesn’t have keyboard focus. |
||
Move to the last packet in the current conversation. This can be used to move to the last packet even if the packet list doesn’t have keyboard focus. |
||
Alt+→ |
Jump to the next visited packet in the packet history, much like the page history in a web browser. |
|
Alt+← |
Jump to the recently visited packet in the packet history, much like the page history in a web browser. |
|
This item allows you to specify that Wireshark should scroll the packet list pane as new packets come in, so you are always looking at the last packet. If you do not specify this, Wireshark simply adds new packets onto the end of the list, but does not scroll the packet list pane. |
||
Activates a summarized display that groups frames by selected field values, showing only the latest frame for each unique combination. |
The Wireshark Capture menu contains the fields shown in Table 3.7, “Capture menu items”.
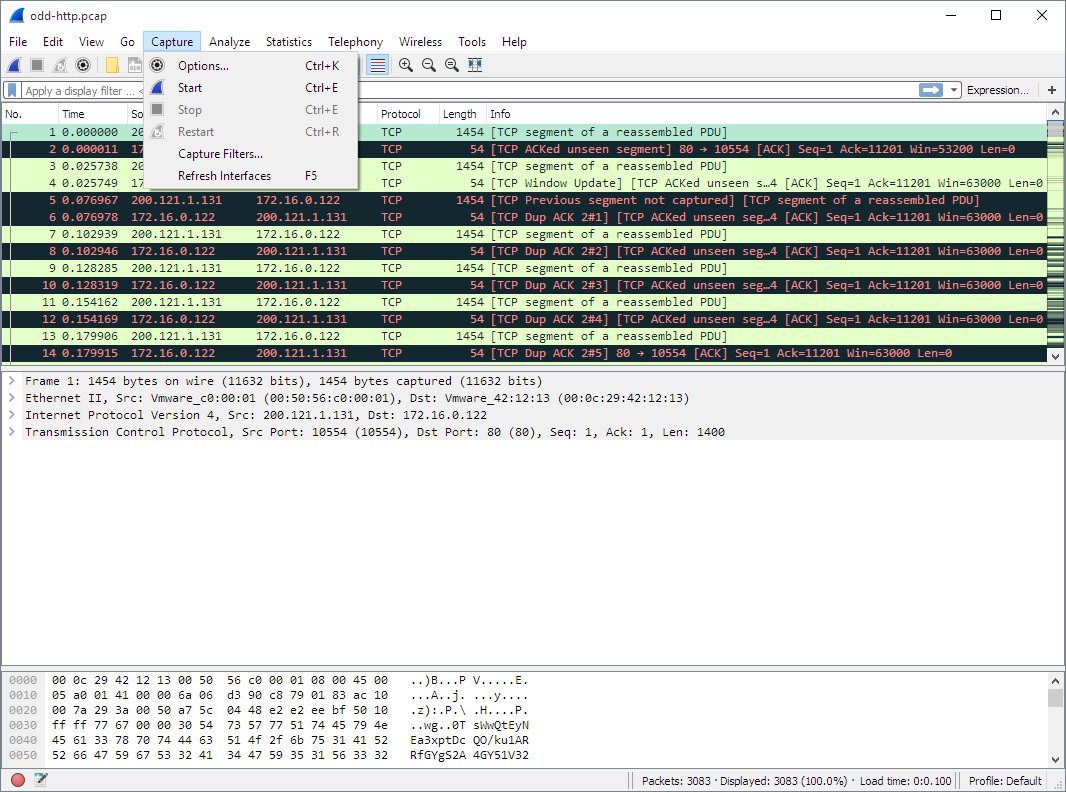
Table 3.7. Capture menu items
| Menu Item | Accelerator | Description |
|---|---|---|
Ctrl+K |
Shows the Capture Options dialog box, which allows you to configure interfaces and capture options. See Section 4.5, “The “Capture Options” Dialog Box”. |
|
Ctrl+E |
Immediately starts capturing packets with the same settings as the last time. |
|
Ctrl+E |
Stops the currently running capture. See Section 4.11.1, “Stop the running capture”. |
|
Ctrl+R |
Stops the currently running capture and starts it again with the same options. |
|
Shows a dialog box that allows you to create and edit capture filters. You can name filters and save them for future use. See Section 6.6, “Defining And Saving Filters”. |
||
F5 |
Clear and recreate the interface list. |
The Wireshark Analyze menu contains the fields shown in Table 3.8, “Analyze menu items”.
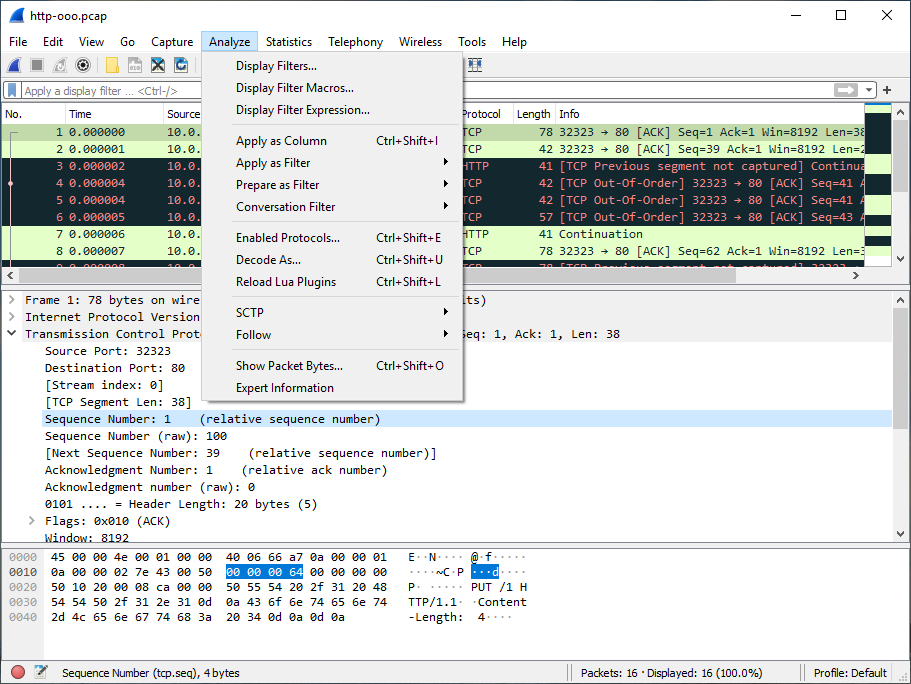
Table 3.8. Analyze menu items
| Menu Item | Accelerator | Description |
|---|---|---|
Displays a dialog box that allows you to create and edit display filters. You can name filters, and you can save them for future use. See Section 6.6, “Defining And Saving Filters”. |
||
Shows a dialog box that allows you to create and edit display filter macros. You can name filter macros, and you can save them for future use. See Section 6.7, “Defining And Saving Filter Macros”. |
||
Shows a dialog box that allows you to build a display filter expression to apply. This shows possible fields and their applicable relations and values, and allows you to search by name and description. See Section 6.5, “The “Display Filter Expression” Dialog Box”. |
||
Shift+Ctrl+I |
Adds the selected protocol item in the packet details pane as a column to the packet list. |
|
Change the current display filter and apply it immediately. Depending on the chosen menu item, the current display filter string will be replaced or appended to by the selected protocol field in the packet details pane. |
||
Change the current display filter but won’t apply it. Depending on the chosen menu item, the current display filter string will be replaced or appended to by the selected protocol field in the packet details pane. |
||
Apply a conversation filter for various protocols. |
||
Shift+Ctrl+E |
Enable or disable various protocol dissectors. See Section 11.4.1, “The “Enabled Protocols” dialog box”. |
|
Decode certain packets as a particular protocol. See Section 11.4.2, “User Specified Decodes”. |
||
Allows you to analyze and prepare a filter for this SCTP association. See Section 9.13, “SCTP Windows”. |
||
Opens a sub-menu with options of various types of protocol streams to follow. The entries for protocols which aren’t found in the currently selected packet will be disabled. See Section 7.2, “Following Protocol Streams”. |
||
Open a window allowing for decoding and reformatting packet bytes. You can do actions like Base64 decode, decompress, interpret as a different character encoding, interpret bytes as an image format, and save, print, or copy to the clipboard the results. See Section 7.3, “Show Packet Bytes” for more information. |
||
|
Open a window showing expert information found in the capture. Some protocol dissectors add packet detail items for notable or unusual behavior, such as invalid checksums or retransmissions. Those items are shown here. See Section 7.4, “Expert Information” for more information. The amount of information will vary depend on the protocol |
The Wireshark Statistics menu contains the fields shown in Table 3.9, “Statistics menu items”.
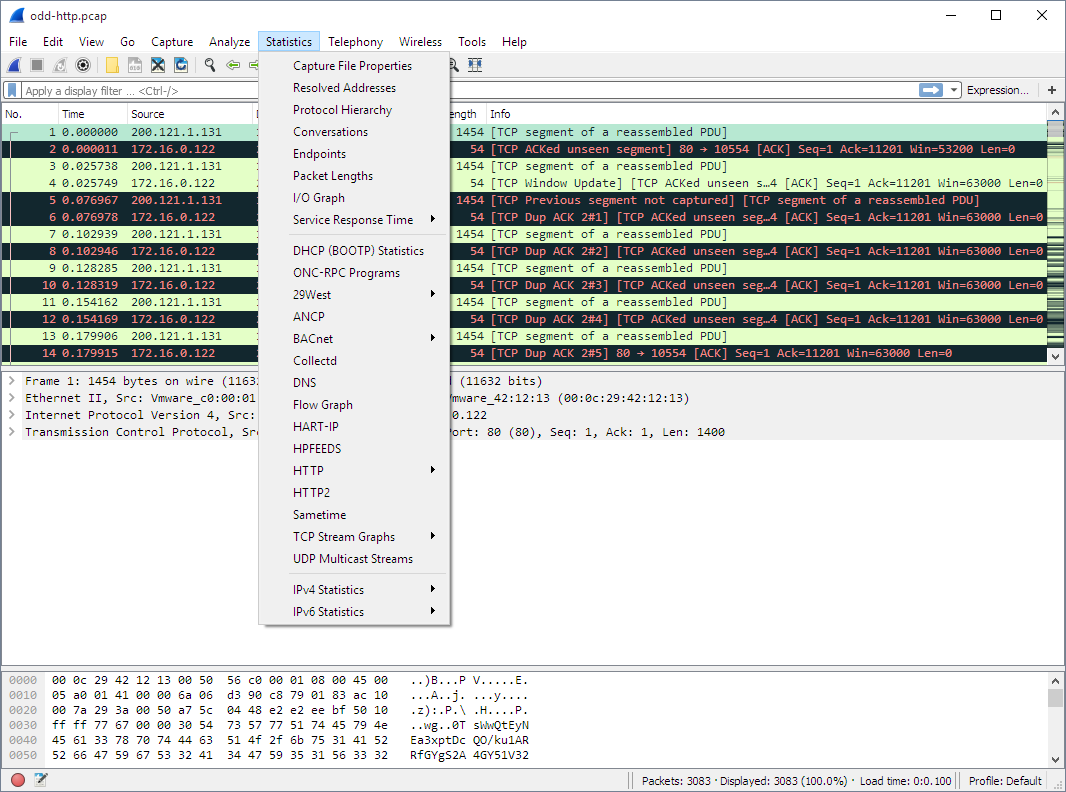
Each menu item brings up a new window showing specific statistics.
Table 3.9. Statistics menu items
| Menu Item | Accelerator | Description |
|---|---|---|
Show information about the capture file, see Section 8.2, “The “Capture File Properties” Dialog”. |
||
Display a hierarchical tree of protocol statistics, see Section 8.4, “The “Protocol Hierarchy” Window”. |
||
Display a list of conversations (traffic between two endpoints), see Section 8.5.1, “The “Conversations” Window”. |
||
Display a list of endpoints (traffic to/from an address), see Section 8.6.1, “The “Endpoints” Window”. |
||
Display user specified graphs (e.g., the number of packets in the course of time), see Section 8.8, “The “I/O Graphs” Window”. |
||
Plot display filter field values over time, see Section 8.9, “The “Plots” Window”. |
||
Display the time between a request and the corresponding response, see Section 8.10, “Service Response Time”. |
||
Display a Named Field distribution and entropy, see Section 8.11, “Distribution Statistics”. |
||
HTTP request/response statistics, see Section 8.23, “HTTP Statistics” |
||
SOME/IP |
||
DTN |
||
ILNP Statistics |
||
The Wireshark Telephony menu contains the fields shown in Table 3.10, “Telephony menu items”.
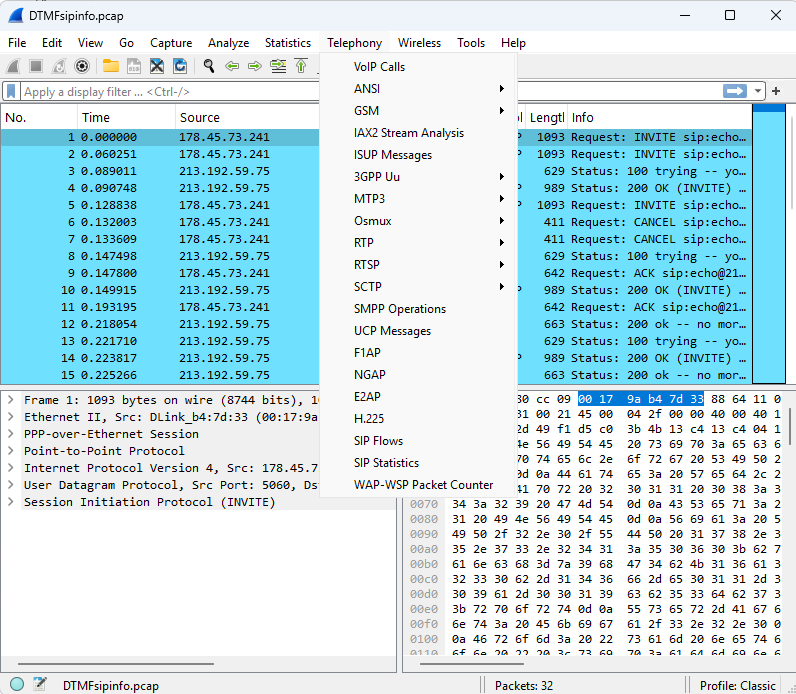
Each menu item shows specific telephony related statistics.
Table 3.10. Telephony menu items
| Menu Item | Accelerator | Description |
|---|---|---|
See Section 9.11.1, “RTP Streams Window” and Section 9.11.2, “RTP Stream Analysis Window” |
||
DIS Streams |
||
The Wireless menu lets you analyze Bluetooth and IEEE 802.11 wireless LAN activity as shown in Figure 3.11, “The “Wireless” Menu”.
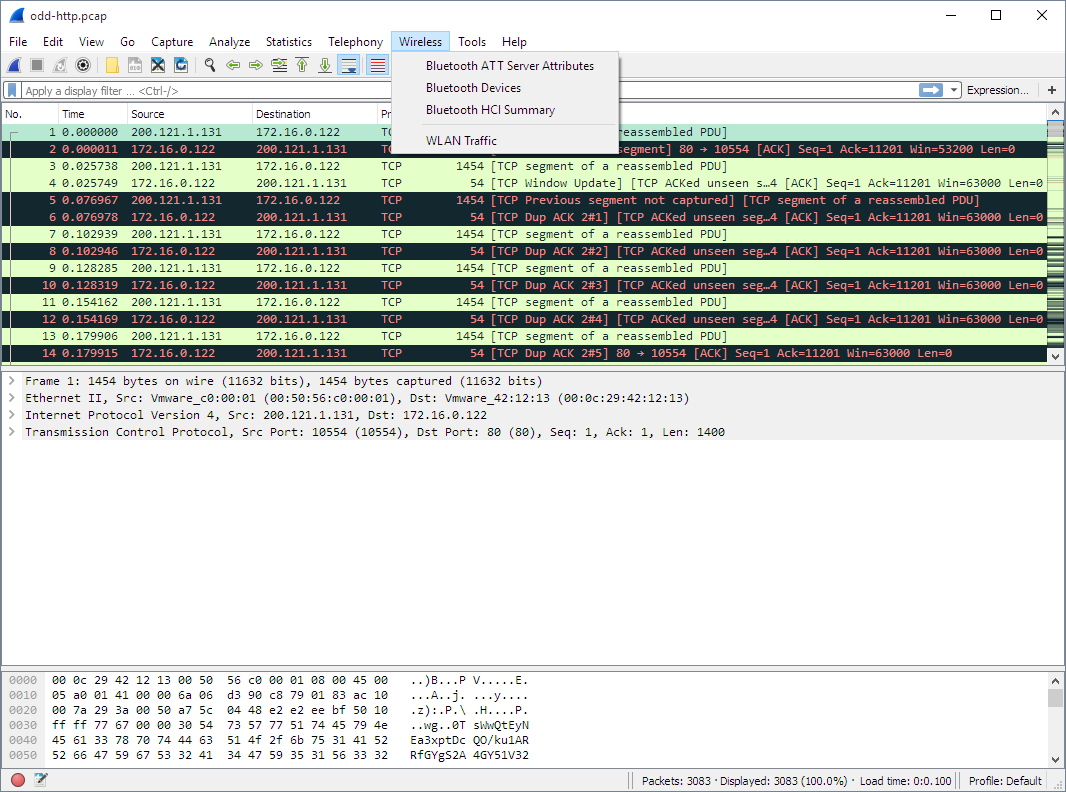
Each menu item shows specific Bluetooth and IEEE 802.11 statistics.
The Wireshark Tools menu contains the fields shown in Table 3.12, “Tools menu items”.
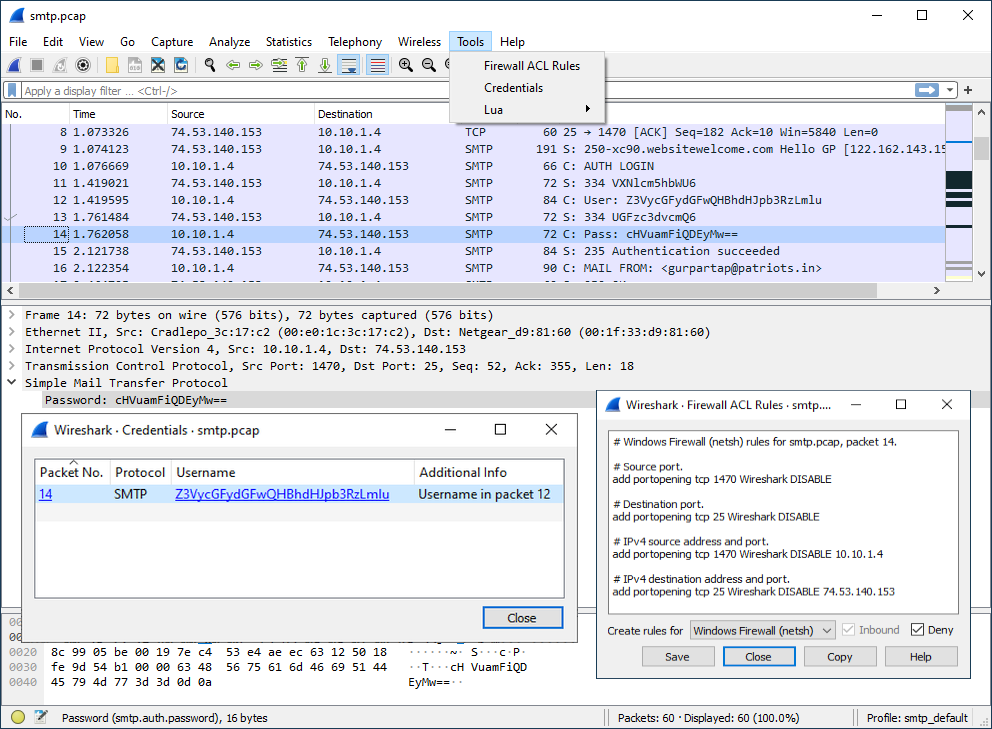
Table 3.12. Tools menu items
| Menu Item | Accelerator | Description |
|---|---|---|
|
This allows you to create command-line ACL rules for many different firewall products, including Cisco IOS, Linux Netfilter (iptables), OpenBSD pf and Windows Firewall (via netsh). Rules for MAC addresses, IPv4 addresses, TCP and UDP ports, and IPv4+port combinations are supported. It is assumed that the rules will be applied to an outside interface. Menu item is greyed out unless one (and only one) frame is selected in the packet list. |
||
This allows you to extract credentials from the current capture file. Some of the dissectors (ftp, http, imap, pop, smtp) have been instrumented to provide the module with usernames and passwords and more will be instrumented in the future. The window dialog provides you the packet number where the credentials have been found, the protocol that provided them, the username and protocol specific information. |
||
This allows viewing the IEEE MAC address registry data that Wireshark uses to resolve MAC address blocks to vendor names. The table can be searched by address prefix or vendor name. |
||
This can launch an application such as a web browser or a terminal window with the SSLKEYLOGFILE environment variable set to the same value as the TLS secret log file. Note that you will probably have to quit your existing web browser session in order to have it run under a fresh environment. |
||
This option opens the built-in graphical debugger for Lua scripts. See “Lua Debugger” in the Wireshark Developer’s Guide. |
||
This option allows you to work with the Lua interpreter optionally built into Wireshark, to inspect Lua internals and evaluate code. See “Lua Support in Wireshark” in the Wireshark Developer’s Guide. |
The Wireshark Help menu contains the fields shown in Table 3.13, “Help menu items”.
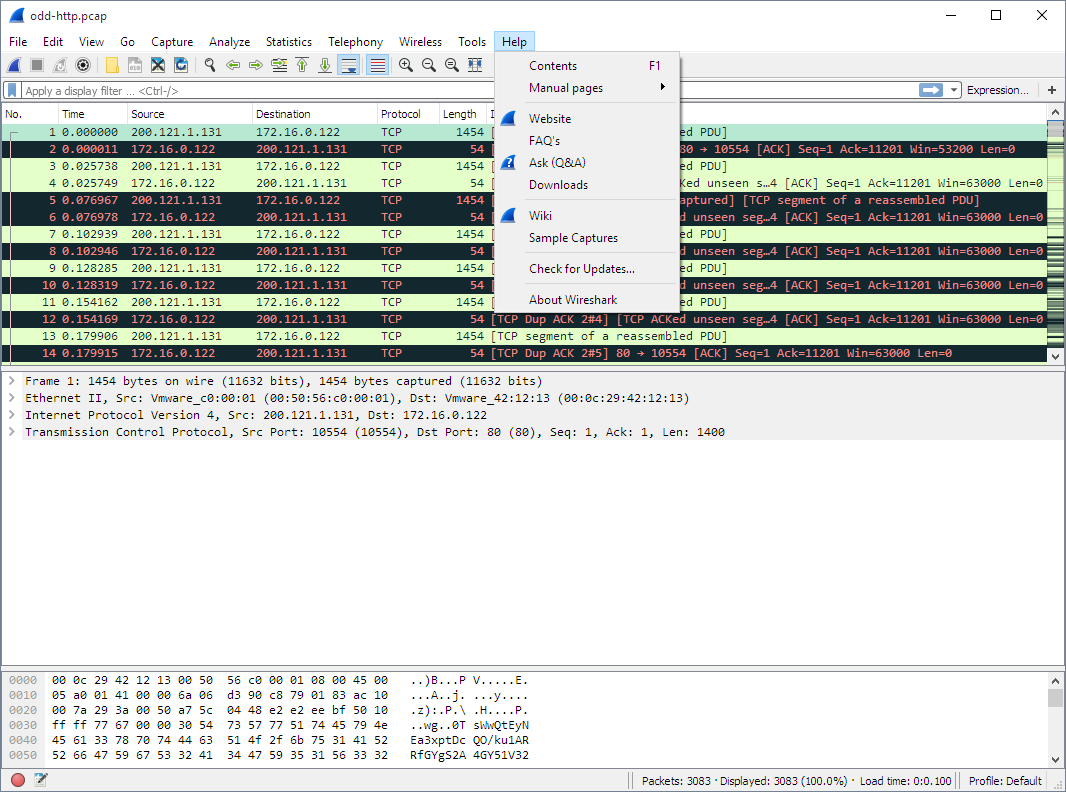
Table 3.13. Help menu items
| Menu Item | Accelerator | Description |
|---|---|---|
F1 |
This menu item brings up the Wireshark User’s Guide you’re reading right now. |
|
→ |
This menu item starts a Web browser showing one of the locally installed html manual pages. |
|
This menu item starts a Web browser showing the webpage from: https://www.wireshark.org/. |
||
This menu item starts a Web browser showing various FAQs. |
||
This menu item starts a Web browser showing the downloads from: https://www.wireshark.org/download.html. |
||
This menu item starts a Web browser showing the front page from: https://wiki.wireshark.org/. |
||
This menu item starts a Web browser showing the sample captures from: https://wiki.wireshark.org/SampleCaptures. |
||
This menu item starts a Web browser showing the Release Notes of the current version. |
||
This menu item brings up an information window that provides various detailed information items on Wireshark, such as how it’s built, the plugins loaded, the used folders, … |
||
→ |
This menu item starts the updater utility that checks whether there’s an new version of Wireshark available. This item is only available on Windows and macOS. |
|
Note |
|---|---|
|
Opening a Web browser might be unsupported in your version of Wireshark. If this is the case the corresponding menu items will be hidden. If calling a Web browser fails on your machine, nothing happens, or the browser starts but no page is shown, have a look at the web browser setting in the preferences dialog. |
The main toolbar provides quick access to frequently used items from the menu. This toolbar cannot be customized by the user, but it can be hidden using the View menu if the space on the screen is needed to show more packet data.
Items in the toolbar will be enabled or disabled (greyed out) similar to their corresponding menu items. For example, in the image below shows the main window toolbar after a file has been opened. Various file-related buttons are enabled, but the stop capture button is disabled because a capture is not in progress.

Table 3.14. Main toolbar items
| Toolbar Icon | Toolbar Item | Menu Item | Description |
|---|---|---|---|
|
→ |
Starts capturing packets with the same options as the last capture or the default options if none were set (Section 4.3, “Start Capturing”). |
|
|
→ |
Stops the currently running capture (Section 4.3, “Start Capturing”). |
|
|
→ |
Restarts the current capture session. |
|
|
→ |
Opens the “Capture Options” dialog box. See Section 4.3, “Start Capturing” for details. |
|
|
→ |
Opens the file open dialog box, which allows you to load a capture file for viewing. It is discussed in more detail in Section 5.2.1, “The “Open Capture File” Dialog Box”. |
|
|
→ |
Save the current capture file to whatever file you would like. See Section 5.3.1, “The “Save Capture File As” Dialog Box” for details. If you currently have a temporary capture file open the “Save” icon will be shown instead. |
|
|
→ |
Closes the current capture. If you have not saved the capture, you will be asked to save it first. |
|
|
→ |
Reloads the current capture file. |
|
|
→ |
Find a packet based on different criteria. See Section 6.8, “Finding Packets” for details. |
|
|
→ |
Jump back in the packet history. Hold down the Alt key (Option on macOS) to go back in the selection history. |
|
|
→ |
Jump forward in the packet history. Hold down the Alt key (Option on macOS) to go forward in the selection history. |
|
|
→ |
Go to a specific packet. |
|
|
→ |
Jump to the first packet of the capture file. |
|
|
→ |
Jump to the last packet of the capture file. |
|
|
→ |
Auto scroll packet list while doing a live capture (or not). |
|
|
→ |
Activates the Aggregation View, which displays frames aggregated by selected field values, showing only the most recently received ones for each combination. This feature is disabled by default and can be enabled by adding the aggregation fields Preferences → Capture → Aggregation fields. The aggregation fields used for grouping can be configured in the same preferences section (see Section 11.5, “Preferences”). |
|
|
→ |
Colorize the packet list (or not). |
|
|
→ |
Zoom into the packet data (increase the font size). |
|
|
→ |
Zoom out of the packet data (decrease the font size). |
|
|
→ |
Set zoom level back to 100%. |
|
|
→ |
Resize columns, so the content fits into them. |
|
|
→ |
Reset layout to default size. |
The filter toolbar lets you quickly edit and apply display filters. More information on display filters is available in Section 6.3, “Filtering Packets While Viewing”.

Table 3.15. Filter toolbar items
| Toolbar Icon | Name | Description |
|---|---|---|
|
Bookmarks |
Manage or select saved filters. |
|
Filter Input |
The area to enter or edit a display filter string, see Section 6.4, “Building Display Filter Expressions”. A syntax check of your filter string is done while you are typing. The background will turn red if you enter an incomplete or invalid string, and will become green when you enter a valid string. After you’ve changed something in this field, don’t forget to press the Apply button (or the Enter/Return key), to apply this filter string to the display. This field is also where the current applied filter is displayed. |
|
Clear |
Reset the current display filter and clear the edit area. |
|
Apply |
Apply the current value in the edit area as the new display filter. Applying a display filter on large capture files might take quite a long time. |
|
Recent |
Select from a list of recently applied filters. |
|
Add Button |
Add a new filter button. |
Filter Button |
Filter buttons are handy shortcuts that apply a display filter as soon as you press them. You can create filter buttons by pressing the button, right-clicking in the filter button area, or opening the Filter Button section of the Preferences Dialog. The example shows a filter button with the label “Squirrels”. If you have lots of buttons you can arrange them into groups by using “//” as a label separator. For example, if you create buttons named “Not Squirrels // Rabbits” and “Not Squirrels // Capybaras” they will show up in the toolbar under a single button named “Not Squirrels”. |
The packet list pane displays all the packets in the current capture file.
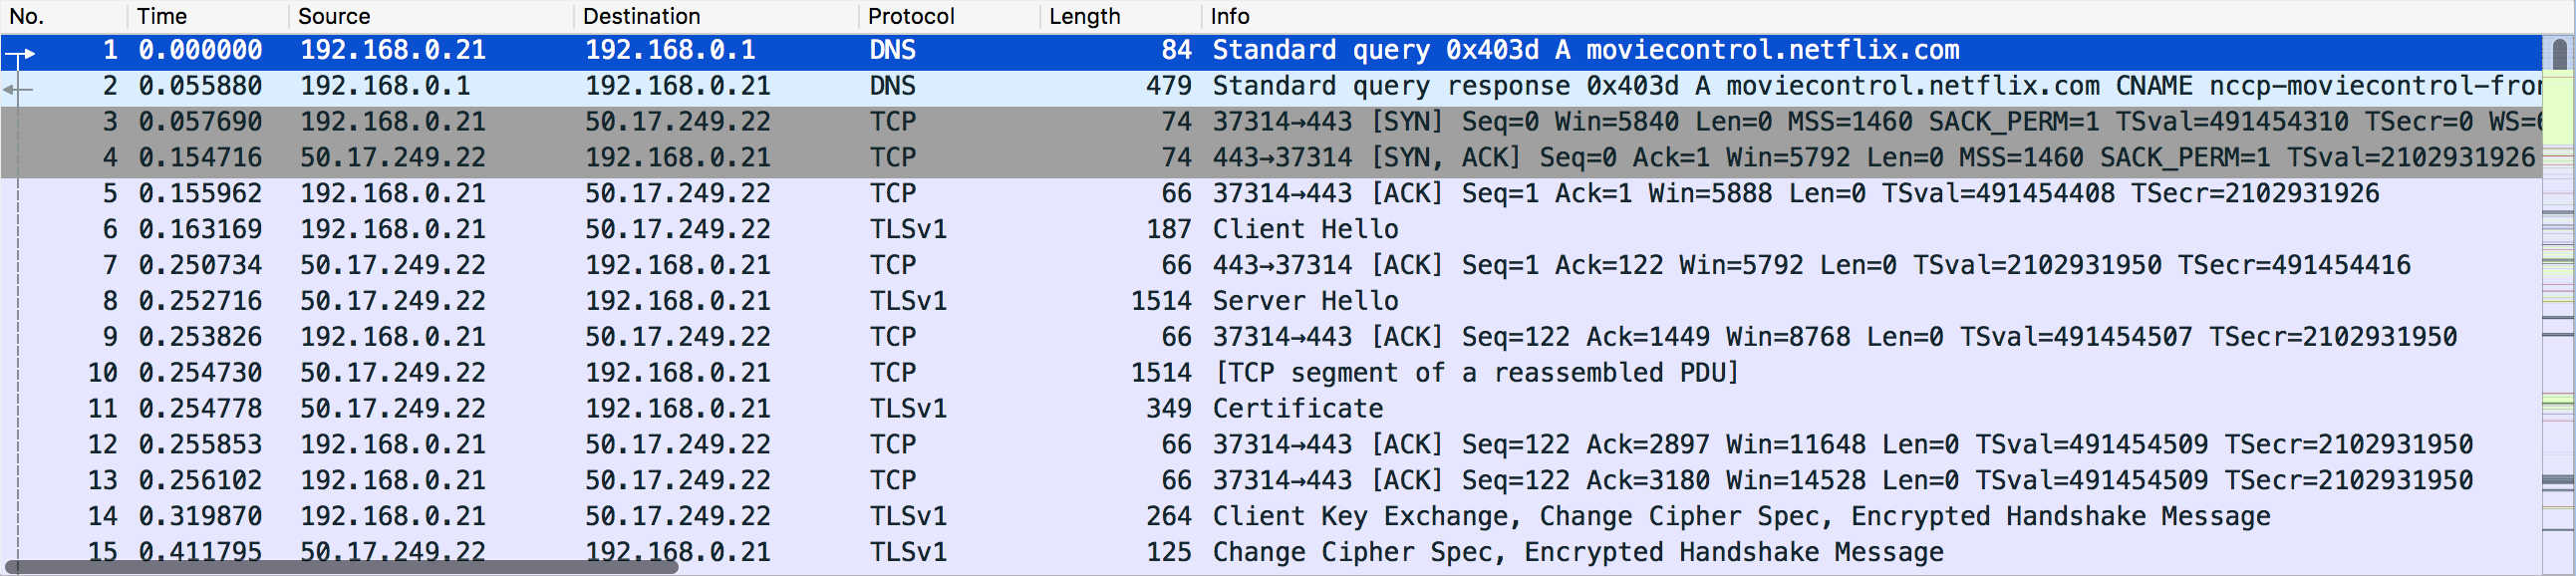
Each line in the packet list corresponds to one packet in the capture file. If you select a line in this pane, more details will be displayed in the “Packet Details” and “Packet Bytes” panes.
While dissecting a packet, Wireshark will place information from the protocol dissectors into the columns. As higher-level protocols might overwrite information from lower levels, you will typically see the information from the highest possible level only.
For example, let’s look at a packet containing TCP inside IP inside an Ethernet packet. The Ethernet dissector will write its data (such as the Ethernet addresses), the IP dissector will overwrite this by its own (such as the IP addresses), the TCP dissector will overwrite the IP information, and so on.
There are many different columns available. You can choose which columns are displayed in the preferences. See Section 11.5, “Preferences”.
The default columns will show:
- The number of the packet in the capture file. This number won’t change, even if a display filter is used.
- The timestamp of the packet. The presentation format of this timestamp can be changed, see Section 6.12, “Time Display Formats And Time References”.
- The delta time from the previous displayed packet.
- The address where this packet is coming from.
- The address where this packet is going to.
- The protocol name in a short (perhaps abbreviated) version.
- The length of each packet.
- Additional information about the packet content.
The first column shows how each packet is related to the selected packet. For example, in the image above the first packet is selected, which is a DNS request. Wireshark shows a rightward arrow for the request itself, followed by a leftward arrow for the response in packet 2. Why is there a dashed line? There are more DNS packets further down that use the same port numbers. Wireshark treats them as belonging to the same conversation and draws a line connecting them.
Table 3.16. Related packet symbols
|
|
First packet in a conversation. |
|
|
Part of the selected conversation. |
|
|
Not part of the selected conversation. |
|
|
Last packet in a conversation. |
|
|
Request. |
|
|
Response. |
|
|
The selected packet acknowledges this packet. |
|
|
The selected packet is a duplicate acknowledgement of this packet. |
|
|
The selected packet is related to this packet in some other way, e.g., as part of reassembly. |
The packet list has an Intelligent Scrollbar which shows a miniature map of nearby packets. Each raster line of the scrollbar corresponds to a single packet, so the number of packets shown in the map depends on your physical display and the height of the packet list. A tall packet list on a high-resolution (“Retina”) display will show you quite a few packets. In the image above the scrollbar shows the status of more than 500 packets along with the 15 shown in the packet list itself.
Right clicking will show a context menu, described in Figure 6.4, “Pop-up menu of the “Packet List” pane”.
The packet details pane shows the current packet (selected in the “Packet List” pane) in a more detailed form.
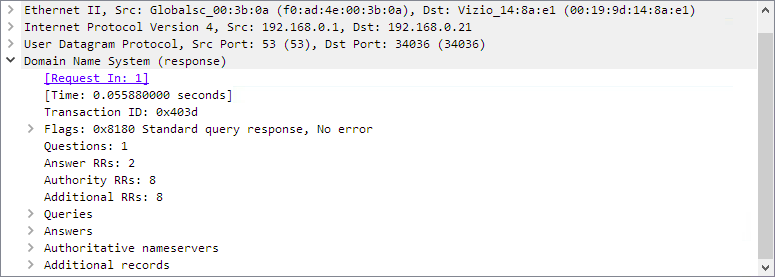
This pane shows the protocols and protocol fields of the packet selected in the “Packet List” pane. The protocol summary lines (subtree labels) and fields of the packet are shown in a tree which can be expanded and collapsed.
There is a context menu (right mouse click) available. See details in Figure 6.5, “Pop-up menu of the “Packet Details” pane”.
Some protocol fields have special meanings.
- Generated fields. Wireshark itself will generate additional protocol information which isn’t present in the captured data. This information is enclosed in square brackets (“[” and “]”). Generated information includes response times, TCP analysis, IP geolocation information, and checksum validation.
- Links. If Wireshark detects a relationship to another packet in the capture file it will generate a link to that packet. Links are underlined and displayed in blue. If you double-clicked on a link Wireshark will jump to the corresponding packet.
The packet bytes pane shows the data of the current packet (selected in the “Packet List” pane) in a hexdump style.
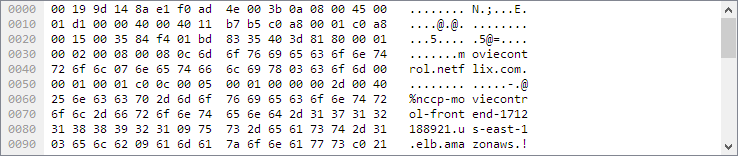
The “Packet Bytes” pane shows a canonical hex dump of the packet data. Each line contains the data offset, sixteen hexadecimal bytes, and sixteen ASCII bytes. Non-printable bytes are replaced with a period (“.”).
Depending on the packet data, sometimes more than one page is available, e.g. when Wireshark has reassembled some packets into a single chunk of data. (See Section 7.8, “Packet Reassembly” for details). In this case you can see each data source by clicking its corresponding tab at the bottom of the pane.
The default mode for viewing will highlight the bytes for a field where the mouse pointer is hovering above. The highlight will follow the mouse cursor as it moves. If this highlighting is not required or wanted, there are two methods for deactivating the functionality:
- Temporary By holding down the Ctrl button while moving the mouse, the highlighted field will not change
- Permanently Using the context menu (right mouse click) the hover highlighting may be activated/deactivated. This setting is stored in the selected profile recent file.
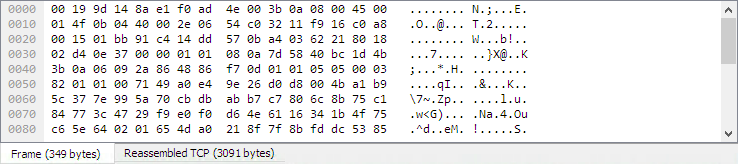
Additional tabs typically contain data reassembled from multiple packets or decrypted data.
The packet diagram pane shows the current packet (selected in the “Packet List” pane) as a diagram, similar to ones used in textbooks and IETF RFCs.
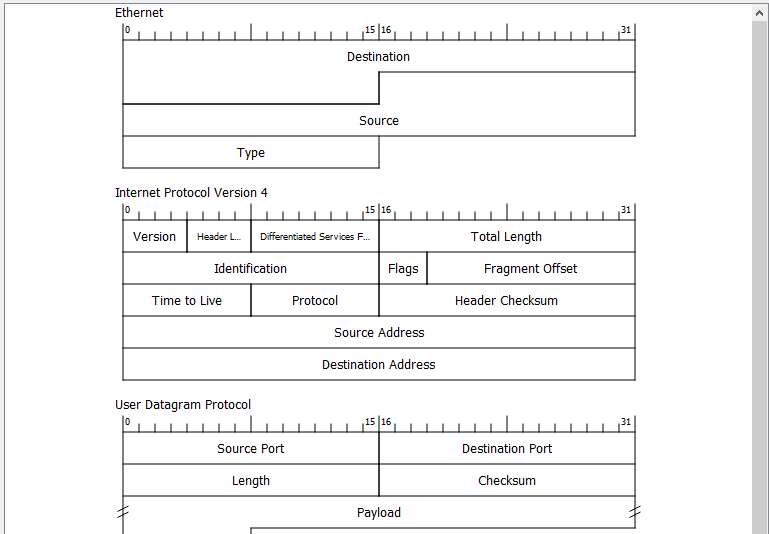
This pane shows the protocols and top-level protocol fields of the packet selected in the “Packet List” pane as a series of diagrams.
There is a context menu (right mouse click) available. For details see Figure 6.7, “Pop-up menu of the “Packet Diagram” pane”.
The statusbar displays informational messages.
In general, the left side will show context related information, the middle part will show information about the current capture file, and the right side will show the selected configuration profile. Drag the handles between the text areas to change the size.

This statusbar is shown while no capture file is loaded, e.g., when Wireshark is started.

- The colorized bullet…
- on the left shows the highest expert information level found in the currently loaded capture file. Hovering the mouse over this icon will show a description of the expert info level, and clicking the icon will bring up the Expert Information dialog box. For a detailed description of this dialog and each expert level, see Section 7.4, “Expert Information”.
- The edit icon…
- on the left side lets you add a comment to the capture file using the Capture File Properties dialog.
- The left side…
- shows the capture file name by default. It also shows field information when hovering over and selecting items in the packet detail and packet bytes panes, as well as general notifications.
- The middle…
-
shows the current number of packets in the capture file. The following values are displayed:
- Packets
- The number of captured packets.
- Displayed
- The number of packets currently being displayed.
- Marked
- The number of marked packets. Only displayed if you marked any packets.
- Dropped
- The number of dropped packets Only displayed if Wireshark was unable to capture all packets.
- Ignored
- The number of ignored packets Only displayed if you ignored any packets.
- The right side…
- shows the selected configuration profile. Clicking on this part of the statusbar will bring up a menu with all available configuration profiles, and selecting from this list will change the configuration profile.
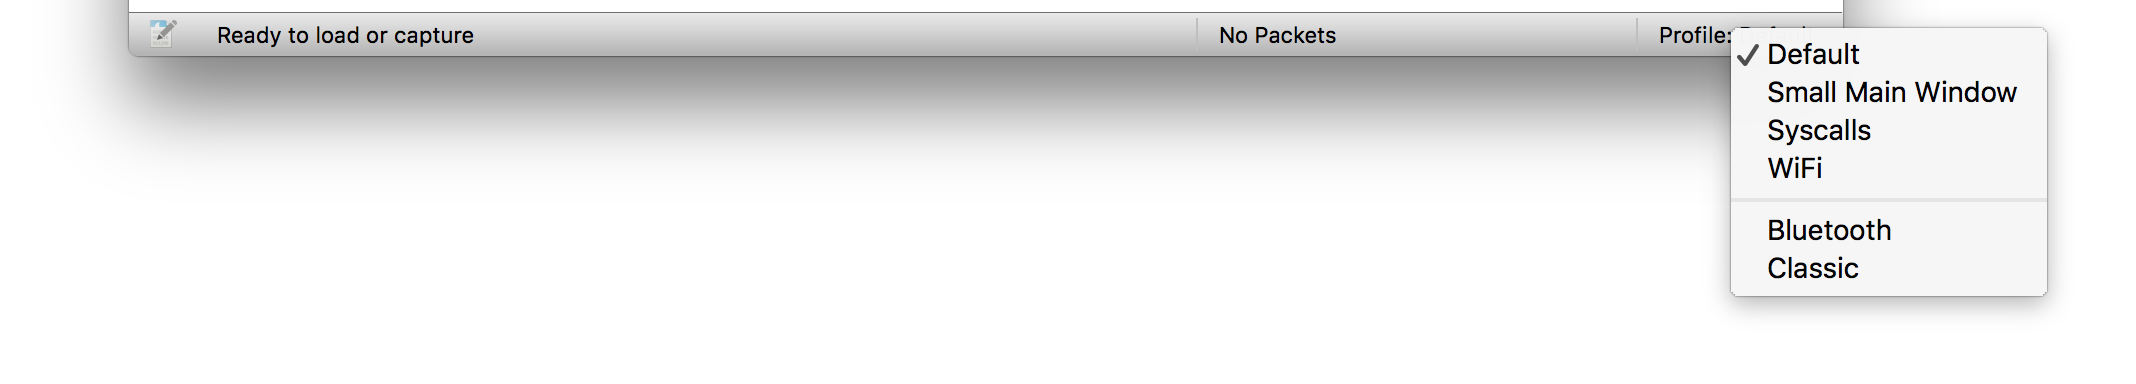
For a detailed description of configuration profiles, see Section 11.6, “Configuration Profiles”.

This is displayed if you have selected a protocol field in the “Packet Details” pane.
|
Tip |
|---|---|
|
The value between the parentheses (in this example “ipv6.src”) is the display filter field for the selected item. You can become more familiar with display filter fields by selecting different packet detail items. |

This is displayed if you are trying to use a display filter which may have unexpected results.
Table of Contents
- 4.1. Introduction
- 4.2. Prerequisites
- 4.3. Start Capturing
- 4.4. The “Capture” Section Of The Welcome Screen
- 4.5. The “Capture Options” Dialog Box
- 4.6. The “Manage Interfaces” Dialog Box
- 4.7. The “Compiled Filter Output” Dialog Box
- 4.8. Capture files and file modes
- 4.9. Link-layer header type
- 4.10. Filtering while capturing
- 4.11. While a Capture is running …
Capturing live network data is one of the major features of Wireshark.
The Wireshark capture engine provides the following features:
- Capture from different kinds of network hardware such as Ethernet or 802.11.
- Simultaneously capture from multiple network interfaces.
- Stop the capture on different triggers such as the amount of captured data, elapsed time, or the number of packets.
- Simultaneously show decoded packets while Wireshark is capturing.
- Filter packets, reducing the amount of data to be captured. See Section 4.10, “Filtering while capturing”.
- Save packets in multiple files while doing a long-term capture, optionally rotating through a fixed number of files (a “ringbuffer”). See Section 4.8, “Capture files and file modes”.
The capture engine still lacks the following features:
- Stop capturing (or perform some other action) depending on the captured data.
Setting up Wireshark to capture packets for the first time can be tricky. A comprehensive guide “How To setup a Capture” is available at https://wiki.wireshark.org/CaptureSetup.
Here are some common pitfalls:
- You may need special privileges to start a live capture.
- You need to choose the right network interface to capture packet data from.
- You need to capture at the right place in the network to see the traffic you want to see.
If you have any problems setting up your capture environment, you should have a look at the guide mentioned above.
The following methods can be used to start capturing packets with Wireshark:
- You can double-click on an interface in the welcome screen.
- You can select an interface in the welcome screen, then select → or click the first toolbar button.
- You can get more detailed information about available interfaces using Section 4.5, “The “Capture Options” Dialog Box” ( → ).
- If you already know the name of the capture interface you can start Wireshark from the command line:
$ wireshark -i eth0 -k
This will start Wireshark capturing on interface eth0. More details can be found at Section 11.2, “Start Wireshark from the command line”.
When you open Wireshark without starting a capture or opening a capture file it will display the “Welcome Screen,” which lists any recently opened capture files and available capture interfaces. Network activity for each interface will be shown in a sparkline next to the interface name. It is possible to select more than one interface and capture from them simultaneously.
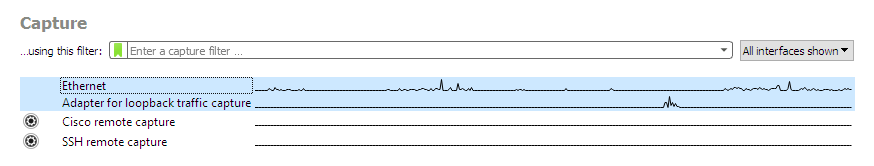
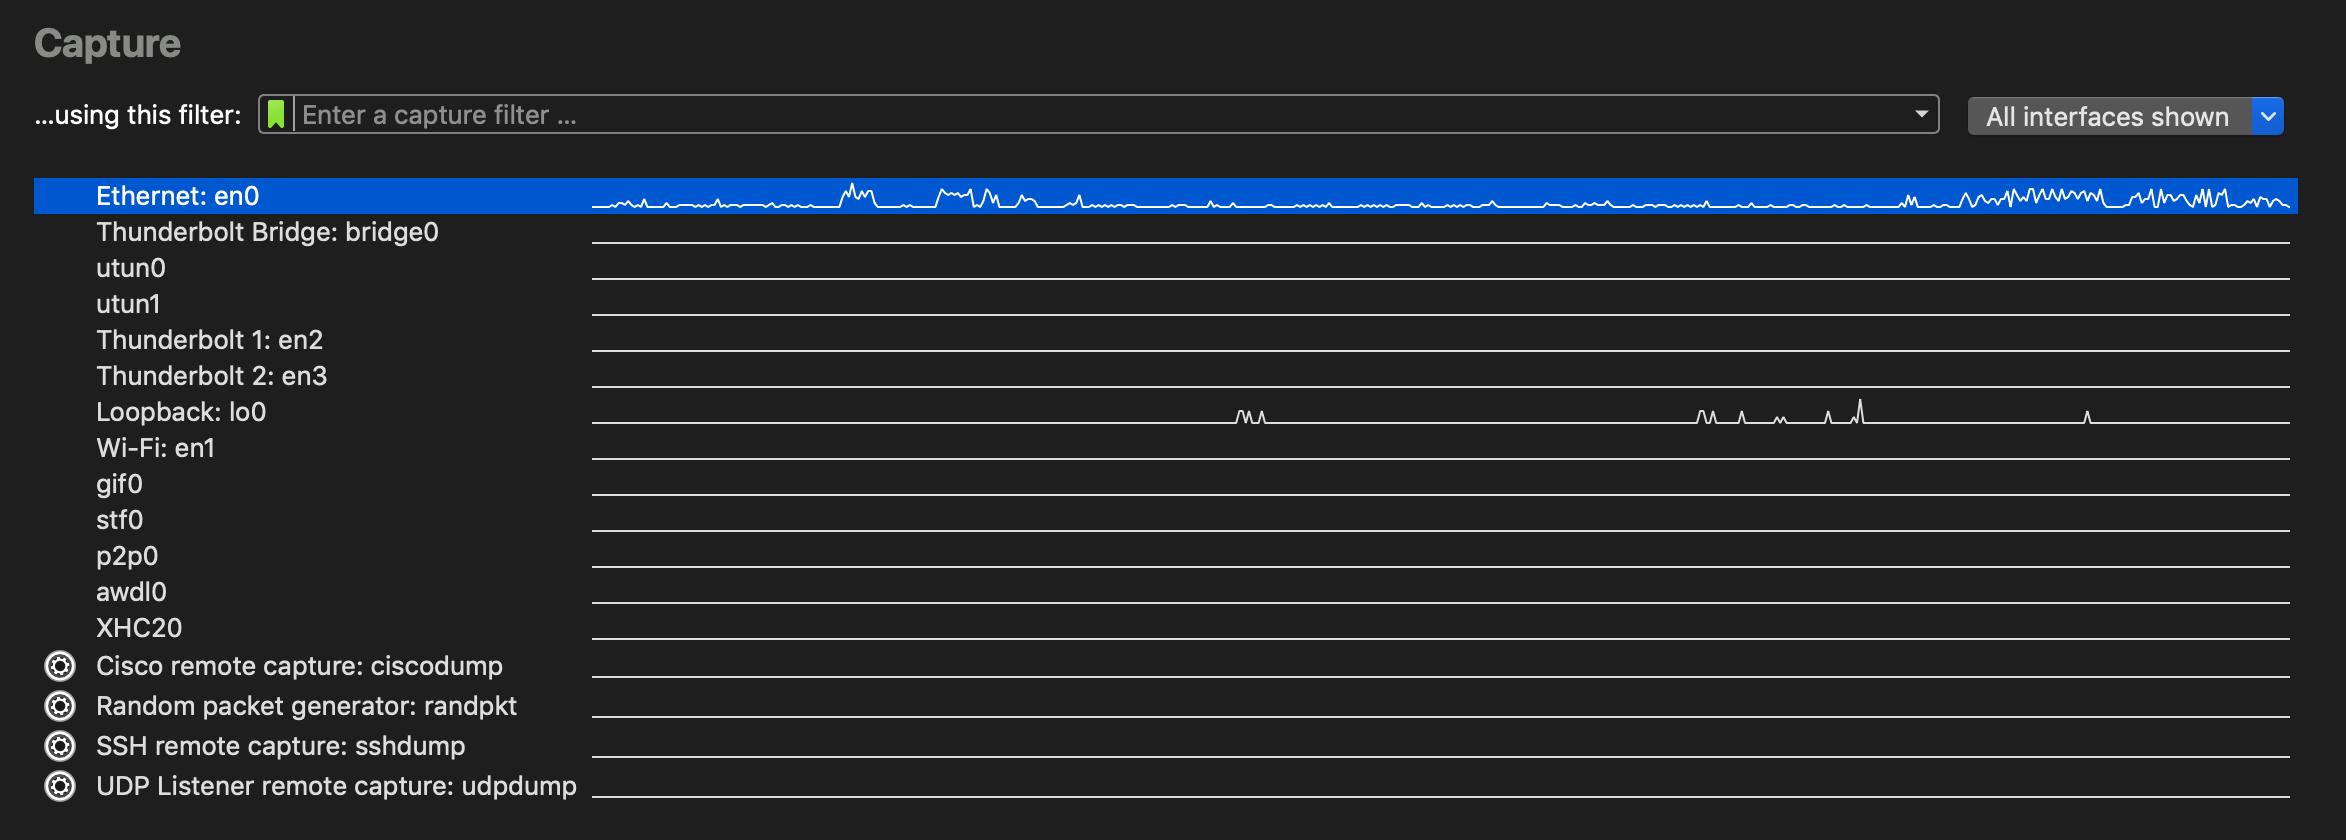
Some interfaces allow or require configuration prior to capture.
This will be indicated by a configuration icon
(![]() )
to the left of the interface name.
Clicking on the icon will show the configuration dialog for that interface.
)
to the left of the interface name.
Clicking on the icon will show the configuration dialog for that interface.
Hovering over an interface will show any associated IPv4 and IPv6 addresses and its capture filter.
Wireshark isn’t limited to just network interfaces — on most systems you can also capture USB, Bluetooth, and other types of packets. Note also that an interface might be hidden if it’s inaccessible to Wireshark or if it has been hidden as described in Section 4.6, “The “Manage Interfaces” Dialog Box”.
When you select → (or use the corresponding item in the main toolbar), Wireshark pops up the “Capture Options” dialog box as shown in Figure 4.3, “The “Capture Options” input tab”. If you are unsure which options to choose in this dialog box, leaving the defaults settings as they are should work well in many cases.
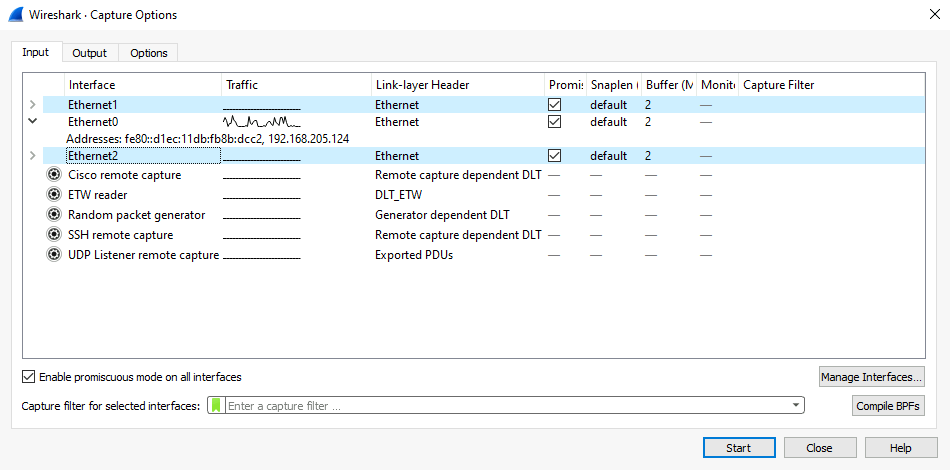
The “Input” tab contains the “Interface” table, which shows the following columns:
- Interface
-
The interface name.
Some interfaces allow or require configuration prior to capture. This will be indicated by a configuration icon (
 )
to the left of the interface name.
Clicking on the icon will show the configuration dialog for that interface.
)
to the left of the interface name.
Clicking on the icon will show the configuration dialog for that interface. - Traffic
- A sparkline showing network activity over time.
- Link-layer Header
- The type of packet captured by this interface. In some cases it is possible to change this. See Section 4.9, “Link-layer header type” for more details.
- Promiscuous
- Lets you put this interface in promiscuous mode while capturing. Note that another application might override this setting.
- Snaplen
- The snapshot length, or the number of bytes to capture for each packet. You can set an explicit length if needed, e.g., for performance or privacy reasons.
- Buffer
- The size of the kernel buffer that is reserved for capturing packets. You can increase or decrease this as needed, but the default is usually sufficient.
- Monitor Mode
- Lets you capture full, raw 802.11 headers. Support depends on the interface type, hardware, driver, and OS. Note that enabling this might disconnect you from your wireless network.
- Optimize
- Allows disabling the optimization applied by default when compiling the capture filter into bytecode. This affects both the actual capture and the bytecode shown in the Compiled Filter Output dialog. This should usually be left enabled, but might be useful if you suspect a bug in the optimizer, or for instructive purposes.
- Capture Filter
- The capture filter applied to this interface. You can edit the filter by double-clicking on it. See Section 4.10, “Filtering while capturing” for more details about capture filters.
Hovering over an interface or expanding it will show any associated IPv4 and IPv6 addresses.
If “Enable promiscuous mode on all interfaces” is enabled, the individual promiscuous mode settings above will be overridden.
“Capture filter for selected interfaces” can be used to set a filter for more than one interface at the same time.
opens the Figure 4.6, “The “Manage Interfaces” dialog box” where pipes can be defined, local interfaces scanned or hidden, or remote interfaces added.
opens Figure 4.7, “The “Compiled Filter Output” dialog box”, which shows you the compiled bytecode for your capture filter. This can help to better understand the capture filter you created.
|
Linux power user tip |
|---|---|
|
The execution of BPFs can be sped up on Linux by turning on BPF Just In Time compilation by executing $ echo 1 >/proc/sys/net/core/bpf_jit_enable if it is not enabled already. To make the change persistent you can use sysfsutils. |
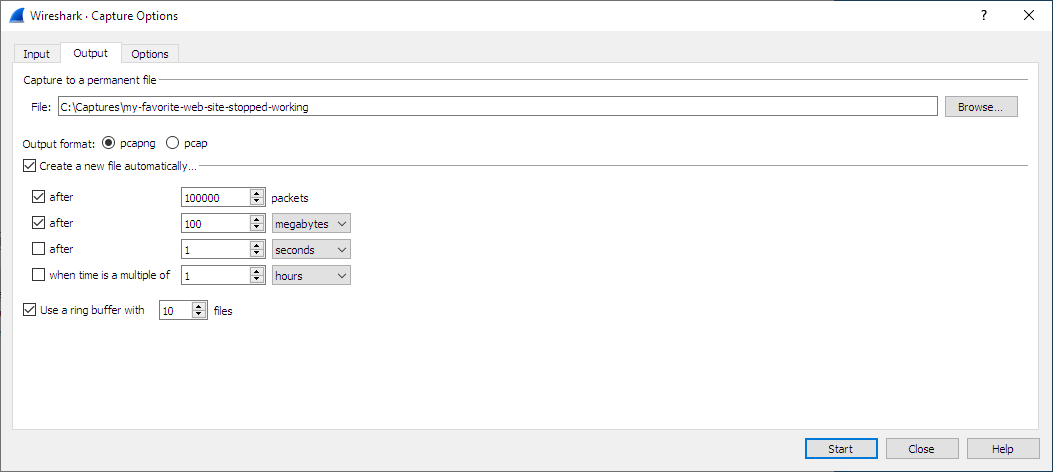
The “Output” tab shows the following information:
- Capture to a permanent file
-
- File
- This field allows you to specify the file name that will be used for the capture file. It is left blank by default. If left blank, the capture data will be stored in a temporary file. See Section 4.8, “Capture files and file modes” for details. You can also click on the button to the right of this field to browse through the filesystem.
- Output format
- Allows you to set the format of the capture file. pcapng is the default and is more flexible than pcap. pcapng might be required, e.g., if more than one interface is chosen for capturing. See https://wiki.wireshark.org/Development/PcapNg for more details on pcapng.
- Create a new file automatically…
-
Sets the conditions for switching a new capture file. A new capture file can be created based on the following conditions:
- The number of packets in the capture file.
- The size of the capture file.
- The duration of the capture file.
- The wall clock time.
- Use a ring buffer with
- Multiple files only. Form a ring buffer of the capture files with the given number of files.
More details about capture files can be found in Section 4.8, “Capture files and file modes”.
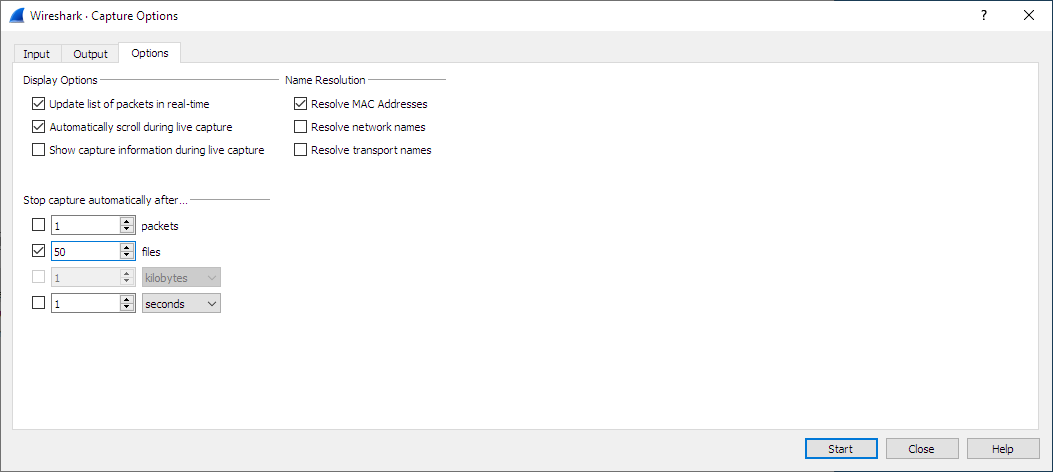
The “Options” tab shows the following information:
- Display Options
-
- Update list of packets in real-time
- Updates the packet list pane in real time during capture. If you do not enable this, Wireshark will not display any packets until you stop the capture. When you check this, Wireshark captures in a separate process and feeds the captures to the display process.
- Automatically scroll during live capture
- Scroll the packet list pane as new packets come in, so you are always looking at the most recent packet. Automatic scrolling is temporarily disabled when manually scrolling upwards or performing a "Go" action so that the selected packet can be examined. It will resume upon manually scrolling to the end of the packet list. If you do not specify this Wireshark adds new packets to the packet list but does not scroll the packet list pane. This option has no effect if “Update list of packets in real-time” is disabled.
- Show capture information during capture
- If this option is enabled, the capture information dialog described in Section 4.11, “While a Capture is running …” will be shown while packets are captured.
- Name Resolution
-
- Resolve MAC addresses
- Translate MAC addresses into names.
- Resolve network names
- Translate network addresses into names.
- Resolve transport names
- Translate transport names (port numbers).
See Section 7.9, “Name Resolution” for more details on each of these options.
- Stop capture automatically after…
-
Capturing can be stopped based on the following conditions:
- The number of packets in the capture file.
- The number of capture files.
- The capture file size.
- The capture file duration.
You can double-click on an interface row in the “Input“ tab or click from any tab to commence the capture. You can click to apply your changes and close the dialog.
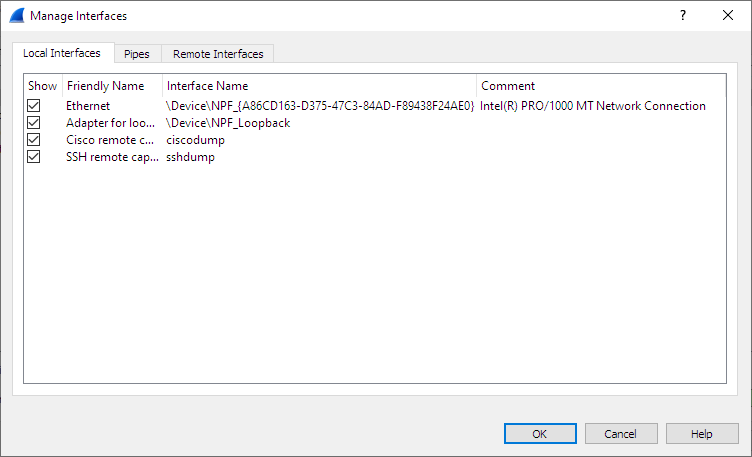
The “Manage Interfaces” dialog box initially shows the “Local Interfaces” tab, which lets you manage the following:
- Show
- Whether or not to show or hide this interface in the welcome screen and the “Capture Options” dialog.
- Friendly Name
- A name for the interface that is human readable.
- Interface Name
- The device name of the interface.
- Comment
- Can be used to add a descriptive comment for the interface.
The “Pipes” tab lets you capture from a named pipe. To successfully add a pipe, its associated named pipe must have already been created. Click and type the name of the pipe including its path. Alternatively, can be used to locate the pipe.
To remove a pipe from the list of interfaces, select it and press .
On Microsoft Windows, the “Remote Interfaces” tab lets you capture from an interface on a different machine. The Remote Packet Capture Protocol service must first be running on the target platform before Wireshark can connect to it.
On Linux or Unix you can capture (and do so more securely) through an SSH tunnel.
To add a new remote capture interface, click and specify the following:
- Host
- The IP address or host name of the target platform where the Remote Packet Capture Protocol service is listening. The drop-down list contains the hosts that have previously been successfully contacted. The list can be emptied by choosing “Clear list” from the drop-down list.
- Port
- Set the port number where the Remote Packet Capture Protocol service is listening on. Leave blank to use the default port (2002).
- Null authentication
- Select this if you don’t need authentication to take place for a remote capture to be started. This depends on the target platform. This is exactly as secure as it appears, i.e., it is not secure at all.
- Password authentication
- Lets you specify the username and password required to connect to the Remote Packet Capture Protocol service.
Each interface can optionally be hidden.
In contrast to the local interfaces, they are not saved in the preferences file.
|
Note |
|---|---|
|
Make sure you have outside access to port 2002 on the target platform. This is the default port used by the Remote Packet Capture Protocol service. |
To remove a host including all its interfaces from the list, select it and click the button.
This figure shows the results of compiling the BPF filter for the selected interfaces.
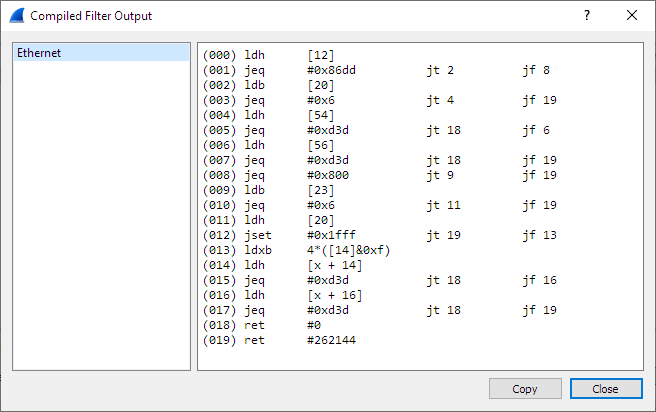
In the list on the left the interface names are listed. The results of compiling a filter for the selected interface are shown on the right.
While capturing, the underlying libpcap capturing engine will grab the packets from the network card and keep the packet data in a (relatively) small kernel buffer. This data is read by Wireshark and saved into a capture file.
By default, Wireshark saves packets to a temporary file. You can also tell Wireshark to save to a specific (“permanent”) file and switch to a different file after a given time has elapsed or a given number of packets have been captured. These options are controlled in the “Capture Options” dialog’s “Output” tab.
|
Tip |
|---|---|
|
Working with large files (several hundred MB) can be quite slow. If you plan to do a long-term capture or capturing from a high traffic network, think about using one of the “Multiple files” options. This will spread the captured packets over several smaller files which can be much more pleasant to work with. |
Using the “Multiple files” option may cut context related information. Wireshark keeps context information of the loaded packet data, so it can report context related problems (like a stream error) and keeps information about context related protocols (e.g., where data is exchanged at the establishing phase and only referred to in later packets). As it keeps this information only for the loaded file, using one of the multiple file modes may cut these contexts. If the establishing phase is saved in one file and the things you would like to see is in another, you might not see some of the valuable context related information.
Information about the folders used for capture files can be found in Section A.2.4, “[Stream setup by PROTOCOL (frame 123)]”.
Table 4.1. Capture file mode selected by capture options
| File Name | “Create a new file…” | “Use a ring buffer…” | Mode | Resulting filename(s) used |
|---|---|---|---|---|
- |
- |
- |
Single temporary file |
wireshark_<interface name>XXXXXX.pcap[ng] (<interface name> is the "friendly name" of the capture interface if available and the system name if not, when capturing on a single interface, and "N_interfaces" where N is the number of interfaces, when capturing on multiple interfaces; XXXXXX is a unique 6 character alphanumeric sequence.) |
foo.cap |
- |
- |
Single named file |
foo.cap |
foo.cap |
x |
- |
Multiple files, continuous |
foo_00001_20260714110102.cap, foo_00002_20260714110318.cap, … |
foo.cap |
x |
x |
Multiple files, ring buffer |
foo_00001_20260714110102.cap, foo_00002_20260714110318.cap, … |
- Single temporary file
- A temporary file will be created and used (this is the default). After capturing is stopped this file can be saved later under a user specified name.
- Single named file
- A single capture file will be used. Choose this mode if you want to place the new capture file in a specific folder.
- Multiple files, continuous
- Like the “Single named file” mode, but a new file is created and used after reaching one of the multiple file switch conditions (one of the “Next file every…” values).
- Multiple files, ring buffer
-
Much like “Multiple files continuous”, reaching one of the multiple files switch conditions (one of the “Next file every …” values) will switch to the next file. This will be a newly created file if value of “Ring buffer with n files” is not reached, otherwise it will replace the oldest of the formerly used files (thus forming a “ring”).
This mode will limit the maximum disk usage, even for an unlimited amount of capture input data, only keeping the latest captured data.
In most cases you won’t have to modify link-layer header type. Some exceptions are as follows:
If you are capturing on an Ethernet device you might be offered a choice of “Ethernet” or “DOCSIS”. If you are capturing traffic from a Cisco Cable Modem Termination System that is putting DOCSIS traffic onto the Ethernet to be captured, select “DOCSIS”, otherwise select “Ethernet”.
If you are capturing on an 802.11 device on some versions of BSD you might be offered a choice of “Ethernet” or “802.11”. “Ethernet” will cause the captured packets to have fake (“cooked”) Ethernet headers. “802.11” will cause them to have full IEEE 802.11 headers. Unless the capture needs to be read by an application that doesn’t support 802.11 headers you should select “802.11”.
If you are capturing on an Endace DAG card connected to a synchronous serial line you might be offered a choice of “PPP over serial” or “Cisco HDLC”. If the protocol on the serial line is PPP, select “PPP over serial” and if the protocol on the serial line is Cisco HDLC, select “Cisco HDLC”.
If you are capturing on an Endace DAG card connected to an ATM network you might be offered a choice of “RFC 1483 IP-over-ATM” or “Sun raw ATM”. If the only traffic being captured is RFC 1483 LLC-encapsulated IP, or if the capture needs to be read by an application that doesn’t support SunATM headers, select “RFC 1483 IP-over-ATM”, otherwise select “Sun raw ATM”.
Wireshark supports limiting the packet capture to packets that match a capture filter. Wireshark capture filters are written in libpcap filter language. Below is a brief overview of the libpcap filter language’s syntax. Complete documentation can be found at the pcap-filter man page. You can find many Capture Filter examples at https://wiki.wireshark.org/CaptureFilters.
You enter the capture filter into the “Filter” field of the Wireshark “Capture Options” dialog box, as shown in Figure 4.3, “The “Capture Options” input tab”.
A capture filter takes the form of a series of primitive expressions connected by conjunctions (and/or) and optionally preceded by not:
[not] primitive [and|or [not] primitive ...]
An example is shown in Example 4.1, “A capture filter for telnet that captures traffic to and from a particular host”.
Example 4.1. A capture filter for telnet that captures traffic to and from a particular host
tcp port 23 and host 10.0.0.5
This example captures telnet traffic to and from the host 10.0.0.5, and shows how to use two primitives and the and conjunction. Another example is shown in Example 4.2, “Capturing all telnet traffic not from 10.0.0.5”, and shows how to capture all telnet traffic except that from 10.0.0.5.
- A primitive is simply one of the following: [src|dst] host <host>
- This primitive allows you to filter on a host IP address or name. You can optionally precede the primitive with the keyword src|dst to specify that you are only interested in source or destination addresses. If these are not present, packets where the specified address appears as either the source or the destination address will be selected.
- ether [src|dst] host <ehost>
- This primitive allows you to filter on Ethernet host addresses. You can optionally include the keyword src|dst between the keywords ether and host to specify that you are only interested in source or destination addresses. If these are not present, packets where the specified address appears in either the source or destination address will be selected.
- gateway host <host>
- This primitive allows you to filter on packets that used host as a gateway. That is, where the Ethernet source or destination was host but neither the source nor destination IP address was host.
- [src|dst] net <net> [{mask <mask>}|{len <len>}]
- This primitive allows you to filter on network numbers. You can optionally precede this primitive with the keyword src|dst to specify that you are only interested in a source or destination network. If neither of these are present, packets will be selected that have the specified network in either the source or destination address. In addition, you can specify either the netmask or the CIDR prefix for the network if they are different from your own.
- [tcp|udp] [src|dst] port <port>
-
This primitive allows you to filter on TCP and UDP port numbers. You can optionally precede this primitive with the keywords src|dst and tcp|udp which allow you to specify that you are only interested in source or destination ports and TCP or UDP packets respectively. The keywords tcp|udp must appear before src|dst.
If these are not specified, packets will be selected for both the TCP and UDP protocols and when the specified address appears in either the source or destination port field.
- less|greater <length>
- This primitive allows you to filter on packets whose length was less than or equal to the specified length, or greater than or equal to the specified length, respectively.
- ip|ether proto <protocol>
- This primitive allows you to filter on the specified protocol at either the Ethernet layer or the IP layer.
- ether|ip broadcast|multicast
- This primitive allows you to filter on either Ethernet or IP broadcasts or multicasts.
- <expr> relop <expr>
- This primitive allows you to create complex filter expressions that select bytes or ranges of bytes in packets. Please see the pcap-filter man page at https://www.tcpdump.org/manpages/pcap-filter.7.html for more details.
If Wireshark is running remotely (using e.g., SSH, an exported X11 window, a terminal server, …), the remote content has to be transported over the network, adding a lot of (usually unimportant) packets to the actually interesting traffic.
To avoid this, Wireshark tries to figure out if it’s remotely connected (by looking at some specific environment variables) and automatically creates a capture filter that matches aspects of the connection.
The following environment variables are analyzed:
SSH_CONNECTION(ssh)- <remote IP> <remote port> <local IP> <local port>
SSH_CLIENT(ssh)- <remote IP> <remote port> <local port>
REMOTEHOST(tcsh, others?)- <remote name>
DISPLAY(x11)- [remote name]:<display num>
SESSIONNAME(terminal server)- <remote name>
On Windows it asks the operating system if it’s running in a Remote Desktop Services environment.
You might see the following dialog box while a capture is running:
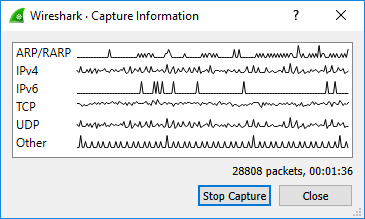
This dialog box shows a list of protocols and their activity over time. It can be enabled via the “capture.show_info” setting in the “Advanced” preferences.
A running capture session will be stopped in one of the following ways:
- The button in the “Capture Information” dialog box.
- The → menu item.
- The toolbar button.
- Pressing Ctrl+E.
- The capture will be automatically stopped if one of the Stop Conditions is met, e.g., the maximum amount of data was captured.
A running capture session can be restarted with the same capture options as the last time, this will remove all packets previously captured. This can be useful, if some uninteresting packets are captured and there’s no need to keep them.
Restart is a convenience function and equivalent to a capture stop following by an immediate capture start. A restart can be triggered in one of the following ways:
- Using the → menu item.
- Using the toolbar button.
Table of Contents
- 5.1. Introduction
- 5.2. Open Capture Files
- 5.3. Saving Captured Packets
- 5.4. Merging Capture Files
- 5.5. Import Hex Dump
- 5.6. File Sets
- 5.7. Exporting Data
- 5.7.1. The “Export Specified Packets” Dialog Box
- 5.7.2. The “Export Packet Dissections” Dialog Box
- 5.7.3. The “Export Selected Packet Bytes” Dialog Box
- 5.7.4. The “Export PDUs to File…” Dialog Box
- 5.7.5. The “Strip Headers…” Dialog Box
- 5.7.6. The “Export TLS Session Keys…” Dialog Box
- 5.7.7. The “Export Objects” Dialog Box
- 5.8. Printing Packets
- 5.9. The “Packet Range” Frame
- 5.10. The Packet Format Frame
This chapter will describe input and output of capture data.
- Open capture files in various capture file formats
- Save and export capture files in various formats
- Merge capture files together
- Import text files containing hex dumps of packets
- Print packets
Wireshark can read in previously saved capture files. To read them, simply select the → menu or toolbar item. Wireshark will then pop up the “File Open” dialog box, which is discussed in more detail in Section 5.2.1, “The “Open Capture File” Dialog Box”.
|
You can use drag and drop to open files |
|---|---|
|
On most systems you can open a file by simply dragging it in your file manager and dropping it onto Wireshark’s main window. |
If you haven’t previously saved the current capture file you will be asked to do so to prevent data loss. This warning can be disabled in the preferences.
In addition to its native file format (pcapng), Wireshark can read and write capture files from a large number of other packet capture programs as well. See Section 5.2.2, “Input File Formats” for the list of capture formats Wireshark understands.
The “Open Capture File” dialog box allows you to search for a capture file containing previously captured packets for display in Wireshark. The following sections show some examples of the Wireshark “Open File” dialog box. The appearance of this dialog depends on the system. However, the functionality should be the same across systems.
Common dialog behavior on all systems:
- Select files and directories.
- Click the button to accept your selected file and open it.
- Click the button to go back to Wireshark and not load a capture file.
- The button will take you to this section of the “User’s Guide”.
Wireshark adds the following controls:
- View file preview information such as the size and the number of packets in a selected a capture file.
- Specify a read filter with the “Read filter” field. This filter will be used when opening the new file. The text field background will turn green for a valid filter string and red for an invalid one. Read filters can be used to exclude various types of traffic, which can be useful for large capture files. They use the same syntax as display filters, which are discussed in detail in Section 6.3, “Filtering Packets While Viewing”.
- Optionally force Wireshark to read a file as a particular type using the “Automatically detect file type” drop-down.
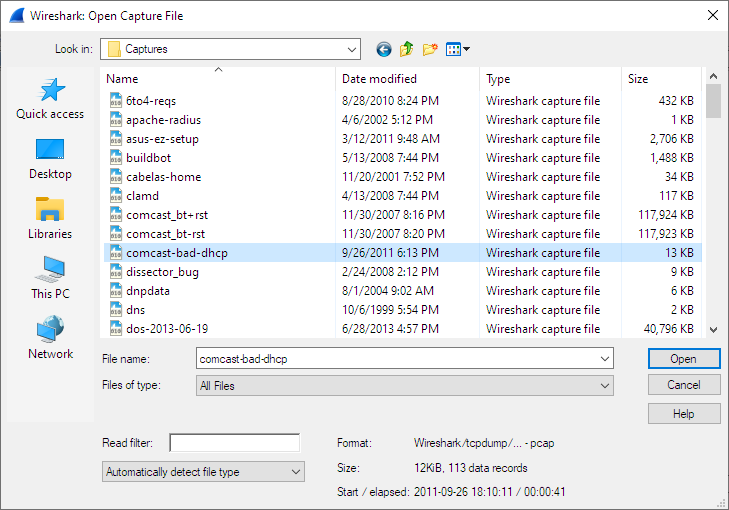
This is the common Windows file open dialog along with some Wireshark extensions.
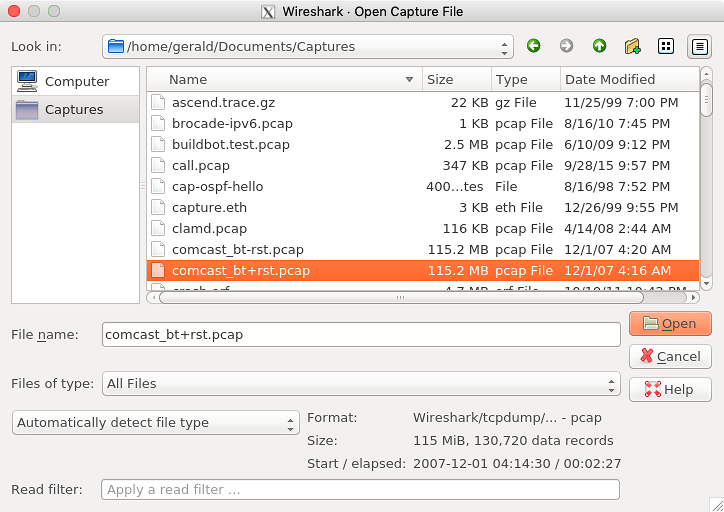
This is the common Qt file open dialog along with some Wireshark extensions.
The native capture file formats used by Wireshark are:
- pcap. The default format used by the libpcap packet capture library. Used by tcpdump, _Snort, Nmap, Ntop, and many other tools.
- pcapng. A flexible, extensible successor to the pcap format. Wireshark 1.8 and later save files as pcapng by default. Versions prior to 1.8 used pcap. Used by Wireshark and by tcpdump in newer versions of macOS.
The following file formats from other capture tools can be opened by Wireshark:
- Oracle (previously Sun) snoop and atmsnoop captures
- Finisar (previously Shomiti) Surveyor captures
- Microsoft Network Monitor captures
- Novell LANalyzer captures
- AIX iptrace captures
- Cinco Networks NetXray captures
- NETSCOUT (previously Network Associates/Network General) Windows-based Sniffer and Sniffer Pro captures
- Network General/Network Associates DOS-based Sniffer captures (compressed or uncompressed) captures
- LiveAction (previously WildPackets/Savvius) *Peek/EtherHelp/PacketGrabber captures
- RADCOM’s WAN/LAN Analyzer captures
- Viavi (previously Network Instruments) Observer captures
- Lucent/Ascend router debug output
- captures from HP-UX nettl
- Toshiba’s ISDN routers dump output
- output from i4btrace from the ISDN4BSD project
- traces from the EyeSDN USB S0
- the IPLog format output from the Cisco Secure Intrusion Detection System
- pppd logs (pppdump format)
- the output from VMS’s TCPIPtrace/TCPtrace/UCX$TRACE utilities
- the text output from the DBS Etherwatch VMS utility
- Visual Networks’ Visual UpTime traffic capture
- the output from CoSine L2 debug
- the output from InfoVista (previously Accellent) 5Views LAN agents
- Endace Measurement Systems’ ERF format captures
- Linux Bluez Bluetooth stack hcidump -w traces
- Catapult (now Ixia/Keysight) DCT2000 .out files
- Gammu generated text output from Nokia DCT3 phones in Netmonitor mode
- IBM Series (OS/400) Comm traces (ASCII & UNICODE)
- Juniper Netscreen snoop captures
- Symbian OS btsnoop captures
- Tamosoft CommView captures
- Tektronix K12xx 32bit .rf5 format captures
- Tektronix K12 text file format captures
- Apple PacketLogger captures
- Captures from Aethra Telecommunications’ PC108 software for their test instruments
- Citrix NetScaler Trace files
- Android Logcat binary and text format logs
- Colasoft Capsa and PacketBuilder captures
- Micropross mplog files
- Unigraf DPA-400 DisplayPort AUX channel monitor traces
- 802.15.4 traces from Daintree’s Sensor Network Analyzer
- MPEG-2 Transport Streams as defined in ISO/IEC 13818-1
- Log files from the candump utility
- Logs from the BUSMASTER tool
- Ixia IxVeriWave raw captures
- Rabbit Labs CAM Inspector files
- systemd journal files
- 3GPP TS 32.423 trace files
New file formats are added from time to time.
It may not be possible to read some formats dependent on the packet types captured. Ethernet captures are usually supported for most file formats but it may not be possible to read other packet types such as PPP or IEEE 802.11 from all file formats.
You can save captured packets by using the → or → menu items. You can choose which packets to save and which file format to be used.
Not all information will be saved in a capture file. For example, most file formats don’t record the number of dropped packets. See Section B.1, “Capture Files” for details.
The “Save Capture File As” dialog box allows you to save the current capture to a file. The exact appearance of this dialog depends on your system. However, the functionality is the same across systems. Examples are shown below.
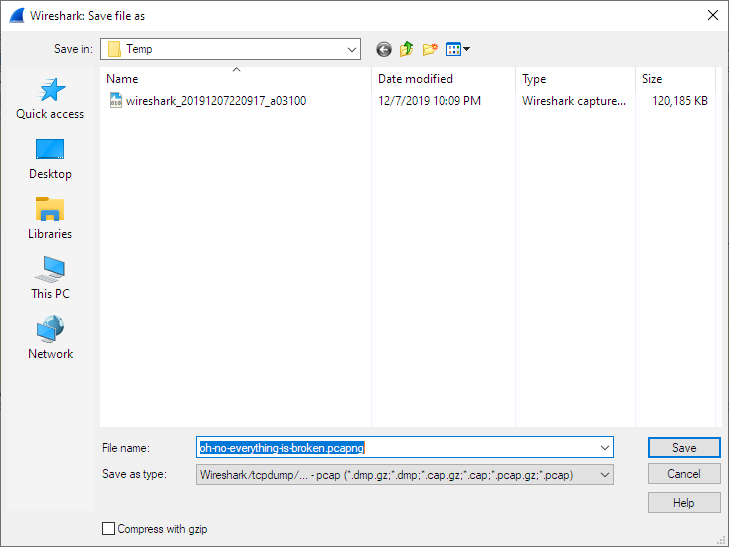
This is the common Windows file save dialog with some additional Wireshark extensions.
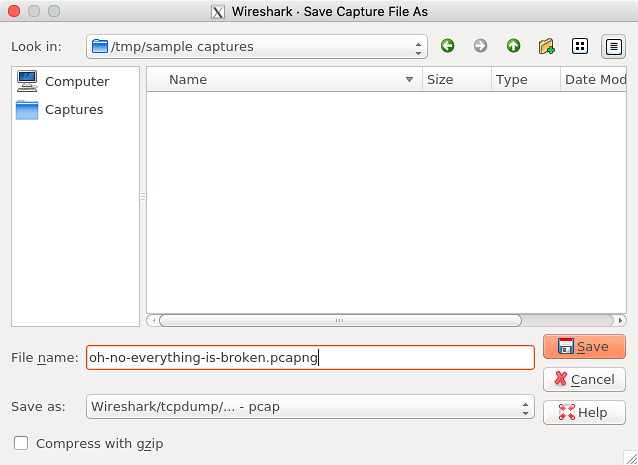
This is the common Qt file save dialog with additional Wireshark extensions.
You can perform the following actions:
- Type in the name of the file in which you wish to save the captured packets.
- Select the directory to save the file into.
- Specify the format of the saved capture file by clicking on the “Save as” drop-down box. You can choose from the types described in Section 5.3.2, “Output File Formats”. Some capture formats may not be available depending on the packet types captured.
- The button will take you to this section of the “User’s Guide”.
- “Compress with gzip” will compress the capture file as it is being written to disk.
- Click the button to accept your selected file and save it.
- Click on the button to go back to Wireshark without saving any packets.
If you don’t provide a file extension to the filename (e.g., .pcap) Wireshark will append the standard file extension for that file format.
|
Wireshark can convert file formats |
|---|---|
|
You can convert capture files from one format to another by opening a capture and saving it as a different format. |
If you wish to save some of the packets in your capture file you can do so via Section 5.7.1, “The “Export Specified Packets” Dialog Box”.
Wireshark can save the packet data in its native file format (pcapng) and in the file formats of other protocol analyzers so other tools can read the capture data.
|
Saving in a different format might lose data |
|---|---|
|
Saving your file in a different format might lose information such as comments, name resolution, and time stamp resolution. See Section 7.6, “Time Stamps” for more information on time stamps. |
The following file formats can be saved by Wireshark (with the known file extensions):
- pcapng (*.pcapng). A flexible, extensible successor to the libpcap format. Wireshark 1.8 and later save files as pcapng by default. Versions prior to 1.8 used libpcap.
- pcap (*.pcap). The default format used by the libpcap packet capture library. Used by tcpdump, _Snort, Nmap, Ntop, and many other tools.
- Accellent 5Views (*.5vw)
- captures from HP-UX nettl ({asterisktrc0,*.trc1)
- Microsoft Network Monitor - NetMon (*.cap)
- Network Associates Sniffer - DOS (*.cap,*.enc,*.trc,*.fdc,*.syc)
- Cinco Networks NetXray captures (*.cap)
- Network Associates Sniffer - Windows (*.cap)
- Network Instruments/Viavi Observer (*.bfr)
- Novell LANalyzer (*.tr1)
- Oracle (previously Sun) snoop (*.snoop,*.cap)
- Visual Networks Visual UpTime traffic (*.*)
- Symbian OS btsnoop captures (*.log)
- Tamosoft CommView captures (*.ncf)
- Catapult (now Ixia/Keysight) DCT2000 .out files (*.out)
- Endace Measurement Systems’ ERF format capture(*.erf)
- EyeSDN USB S0 traces (*.trc)
- Tektronix K12 text file format captures (*.txt)
- Tektronix K12xx 32bit .rf5 format captures (*.rf5)
- Android Logcat binary logs (*.logcat)
- Android Logcat text logs (*.*)
- Citrix NetScaler Trace files (*.cap)
New file formats are added from time to time.
Whether or not the above tools will be more helpful than Wireshark is a different question ;-)
|
Third party protocol analyzers may require specific file extensions |
|---|---|
|
Wireshark examines a file’s contents to determine its type. Some other protocol
analyzers only look at a file’s extension. For example, you might need to use
the |
Sometimes you need to merge several capture files into one. For example, this can be useful if you have captured simultaneously from multiple interfaces at once (e.g., using multiple instances of Wireshark).
There are three ways to merge capture files using Wireshark:
- Use the → menu to open the “Merge” dialog. See Section 5.4.1, “The “Merge With Capture File” Dialog Box” for details. This menu item will be disabled unless you have loaded a capture file.
- Use drag and drop to drop multiple files on the main window. Wireshark will try to merge the packets in chronological order from the dropped files into a newly created temporary file. If you drop a single file, it will simply replace the existing capture.
-
Use the
mergecaptool from the command line to merge capture files. This tool provides the most options to merge capture files. See Section D.9, “mergecap: Merging multiple capture files into one” for details.
This lets you select a file to be merged into the currently loaded file. If your current data has not been saved you will be asked to save it first.
Most controls of this dialog will work the same way as described in the “Open Capture File” dialog box. See Section 5.2.1, “The “Open Capture File” Dialog Box” for details.
Specific controls of this merge dialog are:
- Prepend packets
- Prepend the packets from the selected file before the currently loaded packets.
- Merge chronologically
- Merge both the packets from the selected and currently loaded file in chronological order.
- Append packets
- Append the packets from the selected file after the currently loaded packets.
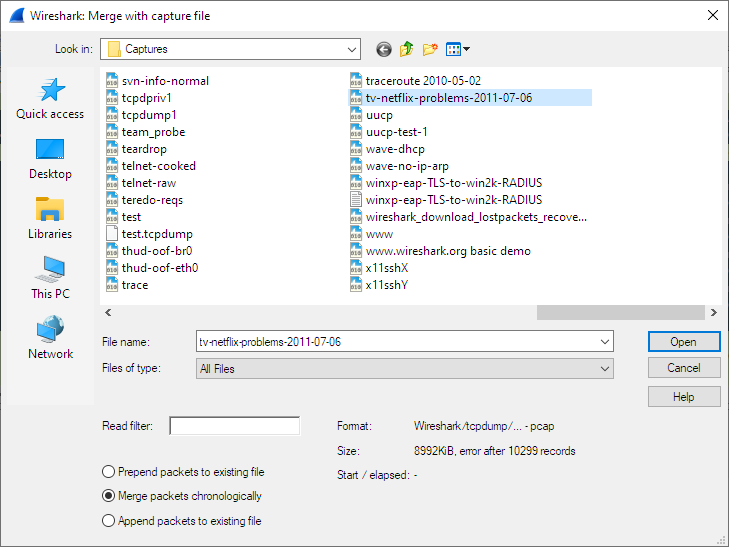
This is the common Windows file open dialog with additional Wireshark extensions.
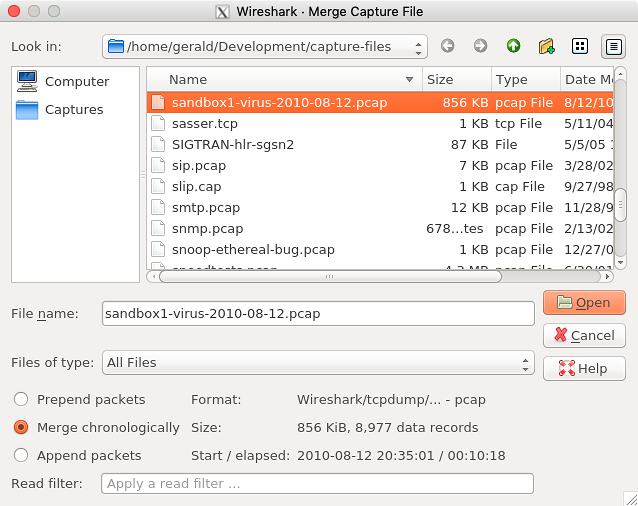
This is the Qt file open dialog with additional Wireshark extensions.
Wireshark can read in a hex dump and write the data described into a temporary libpcap capture file. It can read hex dumps with multiple packets in them, and build a capture file of multiple packets. It is also capable of generating dummy Ethernet, IP and UDP, TCP, or SCTP headers, in order to build fully processable packet dumps from hexdumps of application-level data only. Alternatively, a Dummy PDU header can be added to specify a dissector the data should be passed to initially.
Two methods for converting the input are supported:
Wireshark understands many different hex dump formats. The native format
that Wireshark displays in the Packet Bytes pane, copies to the clipboard,
prints, and saves is that generated by od -Ax -tx1 -v or hexdump -X -v.
That is, each line begins with an offset describing the position in the packet,
each byte is individually displayed, with spaces separating the bytes from
each other, and repeated or all NUL ('\0') lines are not omitted. Hex digits
can be upper or lowercase. Wireshark can handle other hex dump formats, some
of which can be automatically detected and some of which require enabling
options to properly recognize.
Offsets are followed by one or more spaces or tabs separating them from the
bytes. Offsets optionally can be followed by a single colon after the digits.
Offsets can be between 3 and 8 digits; hexadecimal base (radix) is assumed by
default, but they can also be in octal or decimal. If offsets are in hex,
they can be preceded by 0x or 0X. Each packet must begin with offset zero,
and an offset zero indicates the beginning of a new packet. Offset values must
be correct; an unexpected value causes the current packet to be aborted and the
next packet start awaited. There is also a single packet mode with no offsets.
There is no limit on the width or number of bytes per line, but lines with only hex bytes without a leading offset are ignored (i.e., line breaks should not be inserted in long lines that wrap.) Bytes must be in hex; unlike with offsets, other bases such as octal, decimal, or binary are unsupported. Byte groups of two to four bytes are also supported. By default byte groups are assumed to be in network (big-endian) byte order; the “Little-endian” option can be used to support little-endian byte order.
Packets may be preceded by a direction indicator ('I' or 'O') and/or a timestamp if indicated. If both are present, the direction indicator precedes the timestamp. The format of the timestamps must be specified. If no timestamp is parsed, in the case of the first packet the current system time is used, while subsequent packets are written with timestamps one microsecond later than that of the previous packet.
Other text in the input data is ignored. Any text before the offset is ignored, including email forwarding characters '>'. Any text on a line after the bytes is ignored, e.g. an ASCII character dump (but enable the “ASCII identification” option to ensure that hex digits in the character dump are ignored if there is no delimiter between the hex dump and the ASCII character translation). Any line where the first non-whitespace character is a '#' will be ignored as a comment. Some hex dump utilities use a line containing a single '*' to indicate omitted lines, either duplicating the previous line or entirely consisting of NUL ('\0') bytes; this is not supported. Any lines of text between the bytestring lines are considered preamble; the beginning of the preamble is scanned for the direction indicator and timestamp as mentioned above and otherwise ignored.
Here is a sample dump that can be imported, including optional directional indicator and timestamp:
I 2019-05-14T19:04:57Z 000000 00 e0 1e a7 05 6f 00 10 ........ 000008 5a a0 b9 12 08 00 46 00 ........ 000010 03 68 00 00 00 00 0a 2e ........ 000018 ee 33 0f 19 08 7f 0f 19 ........ 000020 03 80 94 04 00 00 10 01 ........ 000028 16 a2 0a 00 03 50 00 0c ........ 000030 01 01 0f 19 03 80 11 01 ........
Wireshark is also capable of scanning the input using a custom Perl regular
expression as specified by GLib’s GRegex here.
Using a regex capturing a single packet in the given file
Wireshark will search the given file from start to the second to last character
(the last character has to be \n and is ignored)
for non-overlapping (and non-empty) strings matching the given regex and then
identify the fields to import using named capturing subgroups. Using provided
format information for each field they are then decoded and translated into a
standard libpcap file retaining packet order.
Note that each named capturing subgroup has to match exactly once a packet, but they may be present multiple times in the regex.
For example, the following dump:
> 0:00:00.265620 a130368b000000080060 > 0:00:00.280836 a1216c8b00000000000089086b0b82020407 < 0:00:00.295459 a2010800000000000000000800000000 > 0:00:00.296982 a1303c8b00000008007088286b0bc1ffcbf0f9ff > 0:00:00.305644 a121718b0000000000008ba86a0b8008 < 0:00:00.319061 a2010900000000000000001000600000 > 0:00:00.330937 a130428b00000008007589186b0bb9ffd9f0fdfa3eb4295e99f3aaffd2f005 > 0:00:00.356037 a121788b0000000000008a18
could be imported using these settings:
regex: ^(?<dir>[<>])\s(?<time>\d+:\d\d:\d\d.\d+)\s(?<data>[0-9a-fA-F]+)$ timestamp: %H:%M:%S.%f dir: in: < out: > encoding: HEX
Caution has to be applied when discarding the anchors ^ and $, as the input
is searched, not parsed, meaning even most incorrect regexes will produce valid
looking results when not anchored (however, anchors are not guaranteed to prevent
this). It is generally recommended to sanity check any files created using
this conversion.
Supported fields:
-
data: Actual captured frame data
The only mandatory field. This should match the encoded binary data captured and is used as the actual frame data to import.
-
time: timestamp for the packet
The captured field will be parsed according to the given timestamp format into a timestamp.
If no timestamp is present an arbitrary counter will count up seconds and nanoseconds by one each packet.
-
dir: the direction the packet was sent over the wire
The captured field is expected to be one character in length, any remaining characters are ignored (e.g., given "Input" only the 'I' is looked at). This character is compared to lists of characters corresponding to inbound and outbound and the packet is assigned the corresponding direction. If neither list yields a match, the direction is set to unknown.
If this field is not specified the entire file has no directional information.
-
seqno: an ID for this packet
Each packet can be assigned an arbitrary ID that can used as field by Wireshark. This field is assumed to be a positive integer base 10. This field can e.g. be used to reorder out of order captures after the import.
If this field is not given, no IDs will be present in the resulting file.
This dialog box lets you select a text file, containing a hex dump of packet data, to be imported and set import parameters.
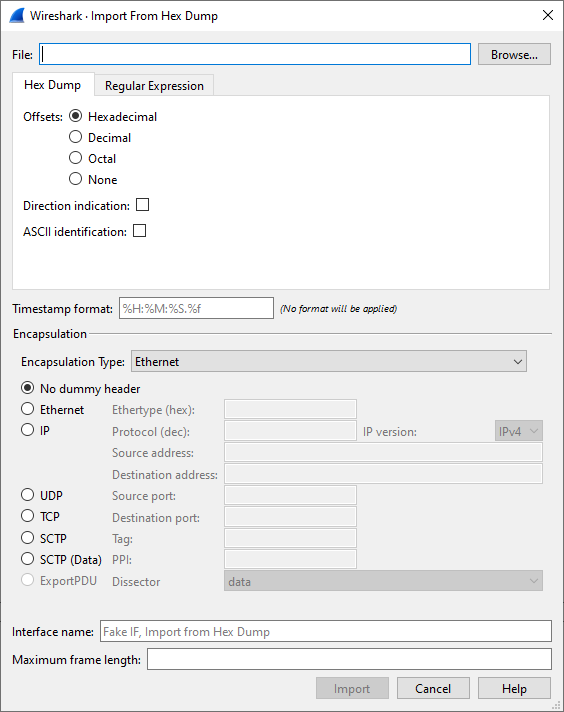
Specific controls of this import dialog are split in three sections:
- File Source
- Determine which input file has to be imported
- Input Format
- Determine how the input file has to be interpreted.
- Encapsulation
- Determine how the data is to be encapsulated.
- Filename / Browse
- Enter the name of the text file to import. You can use Browse to browse for a file.
This section is split in the two alternatives for input conversion, accessible in the two Tabs "Hex Dump" and "Regular Expression"
In addition to the conversion mode specific inputs, there are also common parameters, currently only the timestamp format.
- Offsets
- Select the radix of the offsets given in the text file to import. This is usually hexadecimal, but decimal and octal are also supported. Select None when only the bytes are present. These will be imported as a single packet.
- Direction indication
- Tick this box if the text file to import has direction indicators before each frame. These are on a separate line before each frame and start with either I or i for input and O or o for output.
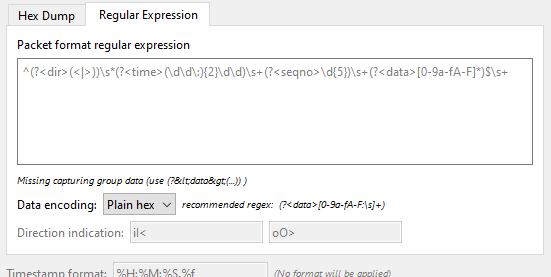
- Packet format regular expression
-
This is the regex used for searching packets and metadata inside the input file.
Named capturing subgroups are used to find the individual fields. Anchors
^and$are set to match directly before and after newlines\nor\r\n. See GRegex for a full documentation. - Data encoding
-
The Encoding used for the binary data. Supported encodings are plain-hexadecimal, -octal, -binary and base64. Plain here means no additional characters are present in the data field beyond whitespaces, which are ignored. Any unexpected characters abort the import process.
Ignored whitespaces are
\r,\n,\t,\v, ` ` and only for hex:, only for base64=.Any incomplete bytes at the field’s end are assumed to be padding to fill the last complete byte. These bits should be zero, however, this is not checked.
- Direction indication
-
The lists of characters indicating incoming vs. outgoing packets. These fields
are only available when the regex contains a
(?<dir>…)group.
- Timestamp Format
-
This is the format specifier used to parse the timestamps in the text file to import. It uses the same format as
strptime(3)with the addition of%ffor zero padded fractions of seconds. The precision of%fis determined from its length. The most common fields are%H,%Mand%Sfor hours, minutes and seconds. The straightforward HH:MM:SS format is covered by %T. For a full definition of the syntax look forstrptime(3),In Regex mode this field is only available when a
(?<time>…)group is present.In Hex Dump mode if there are no timestamps in the text file to import, leave this field empty and timestamps will be generated based on the time of import.
- Encapsulation type
- Here you can select which type of frames you are importing. This all depends on from what type of medium the dump to import was taken. It lists all types that Wireshark understands, so as to pass the capture file contents to the right dissector.
- Dummy header
- When Ethernet encapsulation is selected you have to option to prepend dummy headers to the frames to import. These headers can provide artificial Ethernet, IP, UDP, TCP or SCTP headers or SCTP data chunks. When selecting a type of dummy header, the applicable entries are enabled, others are greyed out and default values are used. When the Wireshark Upper PDU export encapsulation is selected the option ExportPDU becomes available. This allows you to select the name of the dissector these frames are to be directed to.
- Maximum frame length
- You may not be interested in the full frames from the text file, just the first part. Here you can define how much data from the start of the frame you want to import. If you leave this open the maximum is set to 256kiB.
Once all input and import parameters are setup click to start the import. If your current data wasn’t saved before you will be asked to save it first.
If the import button doesn’t unlock, make sure all encapsulation parameters are in the expected range and all unlocked fields are populated when using regex mode (the placeholder text is not used as default).
When completed there will be a new capture file loaded with the frames imported from the text file.
When using the “Multiple Files” option while doing a capture (see: Section 4.8, “Capture files and file modes”), the capture data is spread over several capture files, called a file set.
As it can become tedious to work with a file set by hand, Wireshark provides some features to handle these file sets in a convenient way.
The following features in the → submenu are available to work with file sets in a convenient way:
- The “List Files” dialog box will list the files Wireshark has recognized as being part of the current file set.
- closes the current and opens the next file in the file set.
- closes the current and opens the previous file in the file set.
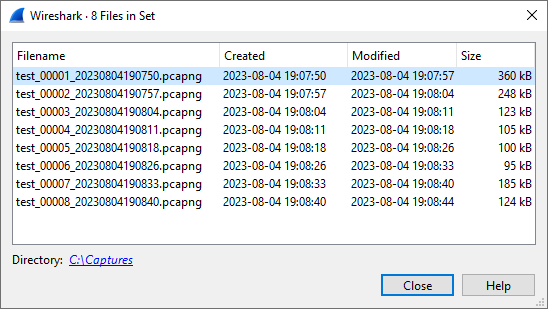
Each line contains information about a file of the file set:
- Filename
- The name of the file. If you click on the filename (or the radio button left to it), the current file will be closed and the corresponding capture file will be opened.
- Created
- The creation time of the file.
- Last Modified
- The last time the file was modified.
- Size
- The size of the file.
The last line will contain info about the currently used directory where all of the files in the file set can be found.
The content of this dialog box is updated each time a capture file is opened/closed.
The button will, well, close the dialog box.
Wireshark provides a variety of options for exporting packet data. This section describes general ways to export data from the main Wireshark application. There are many other ways to export or extract data from capture files, including processing tshark output and customizing Wireshark and TShark using Lua scripts.
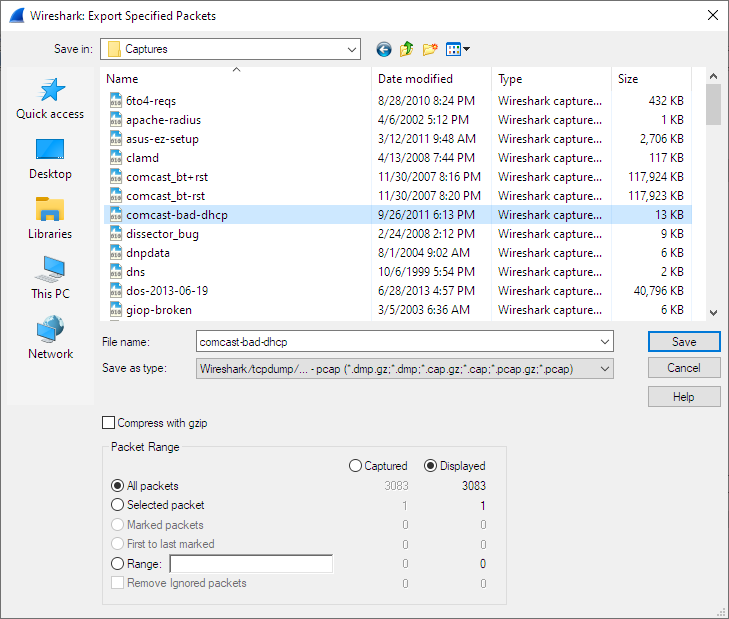
This is similar to the “Save” dialog box, but it lets you save specific packets. This can be useful for trimming irrelevant or unwanted packets from a capture file. See Packet Range for details on the range controls.
This lets you save the packet list, packet details, and packet bytes as plain text, CSV, JSON, and other formats.
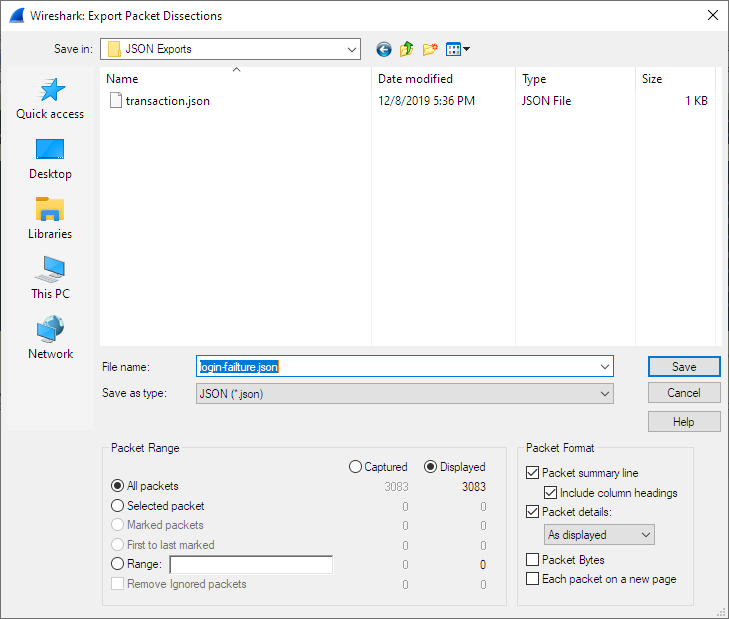
The format can be selected from the “Export As” drop-down and further customized using the “Packet Range” and “Packet Format” controls. Some controls are unavailable for some formats, notably CSV and JSON. The following formats are supported:
- Plain text as shown in the main window
- Comma-separated values (CSV)
- C-compatible byte arrays
- PSML (summary XML)
- PDML (detailed XML)
- JavaScript Object Notation (JSON)
Here are some examples of exported data:
Plain text.
No. Time Source Destination Protocol Length SSID Info
1 0.000000 200.121.1.131 172.16.0.122 TCP 1454 10554 → 80 [ACK] Seq=1 Ack=1 Win=65535 Len=1400 [TCP segment of a reassembled PDU]
Frame 1: 1454 bytes on wire (11632 bits), 1454 bytes captured (11632 bits)
Ethernet II, Src: 00:50:56:c0:00:01, Dst: 00:0c:29:42:12:13
Internet Protocol Version 4, Src: 200.121.1.131 (200.121.1.131), Dst: 172.16.0.122 (172.16.0.122)
0100 .... = Version: 4
.... 0101 = Header Length: 20 bytes (5)
Differentiated Services Field: 0x00 (DSCP: CS0, ECN: Not-ECT)
Total Length: 1440
Identification: 0x0141 (321)
Flags: 0x0000
...0 0000 0000 0000 = Fragment offset: 0
Time to live: 106
Protocol: TCP (6)
Header checksum: 0xd390 [validation disabled]
[Header checksum status: Unverified]
Source: 200.121.1.131 (200.121.1.131)
Destination: 172.16.0.122 (172.16.0.122)
[Source GeoIP: PE, ASN 6147, Telefonica del Peru S.A.A.]
Transmission Control Protocol, Src Port: 10554, Dst Port: 80, Seq: 1, Ack: 1, Len: 1400
|
Tip |
|---|---|
|
If you would like to be able to import any previously exported packets from a plain text file it is recommended that you do the following:
|
CSV.
"No.","Time","Source","Destination","Protocol","Length","SSID","Info","Win Size" "1","0.000000","200.121.1.131","172.16.0.122","TCP","1454","","10554 > 80 [ACK] Seq=1 Ack=1 Win=65535 Len=1400 [TCP segment of a reassembled PDU]","65535" "2","0.000011","172.16.0.122","200.121.1.131","TCP","54","","[TCP ACKed unseen segment] 80 > 10554 [ACK] Seq=1 Ack=11201 Win=53200 Len=0","53200" "3","0.025738","200.121.1.131","172.16.0.122","TCP","1454","","[TCP Spurious Retransmission] 10554 > 80 [ACK] Seq=1401 Ack=1 Win=65535 Len=1400 [TCP segment of a reassembled PDU]","65535" "4","0.025749","172.16.0.122","200.121.1.131","TCP","54","","[TCP Window Update] [TCP ACKed unseen segment] 80 > 10554 [ACK] Seq=1 Ack=11201 Win=63000 Len=0","63000" "5","0.076967","200.121.1.131","172.16.0.122","TCP","1454","","[TCP Previous segment not captured] [TCP Spurious Retransmission] 10554 > 80 [ACK] Seq=4201 Ack=1 Win=65535 Len=1400 [TCP segment of a reassembled PDU]","65535"
JSON.
{
"_index": "packets-2014-06-22",
"_type": "doc",
"_score": null,
"_source": {
"layers": {
"frame": {
"frame.encap_type": "1",
"frame.time": "Jun 22, 2014 13:29:41.834477000 PDT",
"frame.offset_shift": "0.000000000",
"frame.time_epoch": "1403468981.834477000",
"frame.time_delta": "0.450535000",
"frame.time_delta_displayed": "0.450535000",
"frame.time_relative": "0.450535000",
"frame.number": "2",
"frame.len": "86",
"frame.cap_len": "86",
"frame.marked": "0",
"frame.ignored": "0",
"frame.protocols": "eth:ethertype:ipv6:icmpv6",
"frame.coloring_rule.name": "ICMP",
"frame.coloring_rule.string": "icmp || icmpv6"
},
"eth": {
"eth.dst": "33:33:ff:9e:e3:8e",
"eth.dst_tree": {
"eth.dst_resolved": "33:33:ff:9e:e3:8e",
"eth.dst.oui": "3355647",
"eth.addr": "33:33:ff:9e:e3:8e",
"eth.addr_resolved": "33:33:ff:9e:e3:8e",
"eth.addr.oui": "3355647",
"eth.dst.lg": "1",
"eth.lg": "1",
"eth.dst.ig": "1",
"eth.ig": "1"
},
"eth.src": "00:01:5c:62:8c:46",
"eth.src_tree": {
"eth.src_resolved": "00:01:5c:62:8c:46",
"eth.src.oui": "348",
"eth.src.oui_resolved": "Cadant Inc.",
"eth.addr": "00:01:5c:62:8c:46",
"eth.addr_resolved": "00:01:5c:62:8c:46",
"eth.addr.oui": "348",
"eth.addr.oui_resolved": "Cadant Inc.",
"eth.src.lg": "0",
"eth.lg": "0",
"eth.src.ig": "0",
"eth.ig": "0"
},
"eth.type": "0x000086dd"
},
"ipv6": {
"ipv6.version": "6",
"ip.version": "6",
"ipv6.tclass": "0x00000000",
"ipv6.tclass_tree": {
"ipv6.tclass.dscp": "0",
"ipv6.tclass.ecn": "0"
},
"ipv6.flow": "0x00000000",
"ipv6.plen": "32",
"ipv6.nxt": "58",
"ipv6.hlim": "255",
"ipv6.src": "2001:558:4080:16::1",
"ipv6.addr": "2001:558:4080:16::1",
"ipv6.src_host": "2001:558:4080:16::1",
"ipv6.host": "2001:558:4080:16::1",
"ipv6.dst": "ff02::1:ff9e:e38e",
"ipv6.addr": "ff02::1:ff9e:e38e",
"ipv6.dst_host": "ff02::1:ff9e:e38e",
"ipv6.host": "ff02::1:ff9e:e38e",
"ipv6.geoip.src_summary": "US, ASN 7922, Comcast Cable Communications, LLC",
"ipv6.geoip.src_summary_tree": {
"ipv6.geoip.src_country": "United States",
"ipv6.geoip.country": "United States",
"ipv6.geoip.src_country_iso": "US",
"ipv6.geoip.country_iso": "US",
"ipv6.geoip.src_asnum": "7922",
"ipv6.geoip.asnum": "7922",
"ipv6.geoip.src_org": "Comcast Cable Communications, LLC",
"ipv6.geoip.org": "Comcast Cable Communications, LLC",
"ipv6.geoip.src_lat": "37.751",
"ipv6.geoip.lat": "37.751",
"ipv6.geoip.src_lon": "-97.822",
"ipv6.geoip.lon": "-97.822"
}
},
"icmpv6": {
"icmpv6.type": "135",
"icmpv6.code": "0",
"icmpv6.checksum": "0x00005b84",
"icmpv6.checksum.status": "1",
"icmpv6.reserved": "00:00:00:00",
"icmpv6.nd.ns.target_address": "2001:558:4080:16:be36:e4ff:fe9e:e38e",
"icmpv6.opt": {
"icmpv6.opt.type": "1",
"icmpv6.opt.length": "1",
"icmpv6.opt.linkaddr": "00:01:5c:62:8c:46",
"icmpv6.opt.src_linkaddr": "00:01:5c:62:8c:46"
}
}
}
}
}
]
Export the bytes selected in the “Packet Bytes” pane into a raw binary file.
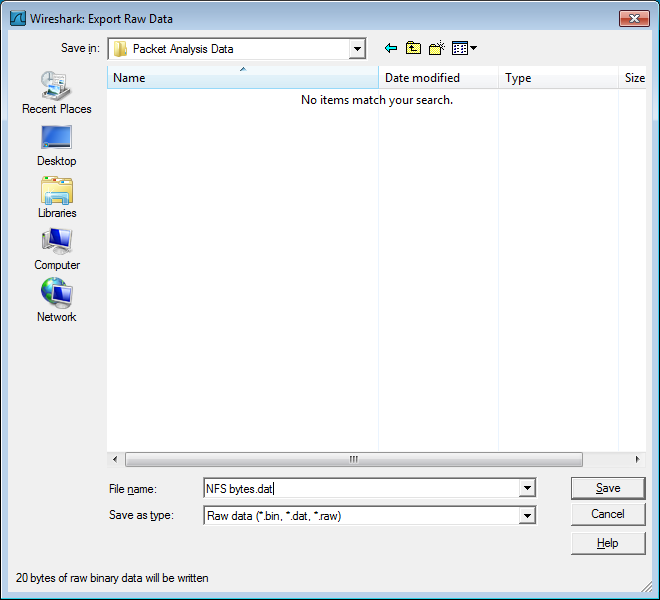
- File name
- The file name to export the packet data to.
- Save as type
- The file extension.
The “Export PDUs to File…” dialog box allows you to filter the captured Protocol Data Units (PDUs) and export them into the file. It allows you to export reassembled PDUs avoiding lower layers such as HTTP without TCP, and decrypted PDUs without the lower protocols such as HTTP without TLS and TCP.
-
In the main menu select → . Wireshark will open a corresponding dialog Figure 5.13, “Export PDUs to File window”.
-
To select the data according to your needs, optionally type a filter value into the
Display Filterfield. For more information about filter syntax, see the Wireshark Filters man page. -
In the field below the
Display Filterfield you can choose the level from which you want to export the PDUs to the file. There are seven levels:-
DLT User. You can export a protocol, which is framed in the user data link type table without the need to reconfigure the DLT user table. For more information, see the How to Dissect Anything page. -
DVB-CI. You can use it for the Digital Video Broadcasting (DVB) protocol. -
LogcatandLogcat Text. You can use them for the Android logs. -
OSI layer 3. You can use it to export PDUs encapsulated in the IPSec or SCTP protocols. -
OSI layer 4. You can use it to export PDUs encapsulated in the TCP or UDP protocols. -
OSI layer 7. You can use it to export the following protocols: CredSSP over TLS, Diameter, protocols encapsulated in TLS and DTLS, H.248, Megaco, RELOAD framing, SIP, SMPP.Note As a developer you can add any dissector to the existing list or define a new entry in the list by using the functions in
epan/exported_pdu.h.
-
- To finish exporting PDUs to file, click the button in the bottom-right corner. This will close the originally captured file and open the exported results instead as a temporary file in the main Wireshark window.
-
You may save the temporary file just like any captured file. See Section 5.3, “Saving Captured Packets” for details.
Note The file produced has a
Wireshark Upper PDUencapsulation type that has somewhat limited support outside of Wireshark, but is very flexible and can contain PDUs for any protocol for which there is a Wireshark dissector.
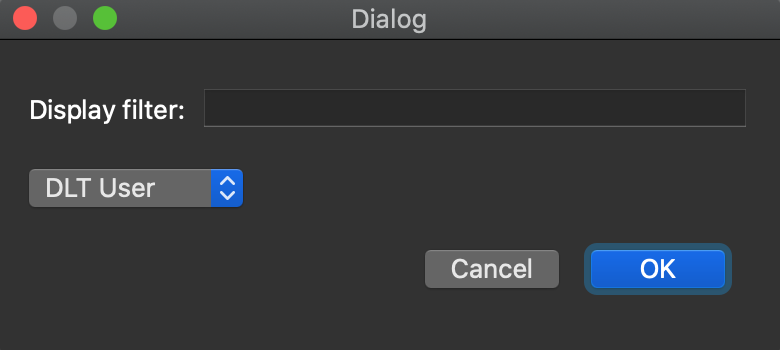
The “Strip Headers…” dialog box allows you to filter known encapsulation types on whatever protocol layer they appear and export them into a new capture file, removing lower-level protocols. It allows you to export reassembled packets and frames without lower layers such as GPF, GRE, GSE, GTP-U, MPLS, MPE, PPP, and more. If Wireshark has performed decryption, then you can export decrypted IP from protocols like IEEE 802.11 or IPSec without having to save encryption keys.
The procedure is similar to that of Section 5.7.4, “The “Export PDUs to File…” Dialog Box”:
- In the main menu select → . Wireshark will open a corresponding dialog.
-
To select the data according to your needs, optionally type a filter value into the
Display Filterfield. For more information about filter syntax, see the Wireshark Filters man page. -
In the field below the
Display Filterfield you can choose the encapsulation type you want to find and export to the file. There are two encapsulations supported:-
Ethernet. You can use it to export Ethernet encapsulated in other protocols. -
IP. You can use it to export IPv4 and IPv6 encapsulated in other protocols.Note As a developer you can add encapsulations to the list by using the functions in
epan/exported_pdu.h.
-
- To finish exporting to file, click the button in the bottom-right corner. This will close the originally captured file and open the exported results instead as a temporary file in the main Wireshark window.
-
You may save the temporary file just like any captured file. See Section 5.3, “Saving Captured Packets” for details.
Note The new capture files produced have standard encapsulation types and can be read in nearly any tool.
Transport Layer Security (TLS) encrypts the communication between a client and a server. The most common use for it is web browsing via HTTPS.
Decryption of TLS traffic requires TLS secrets. You can get them in the form of stored session keys in a "key log file", or by using an RSA private key file. For more details, see the TLS wiki page.
The → menu option generates a new "key log file" which contains TLS session secrets known by Wireshark. This feature is useful if you typically decrypt TLS sessions using the RSA private key file. The RSA private key is very sensitive because it can be used to decrypt other TLS sessions and impersonate the server. Session keys can be used only to decrypt sessions from the packet capture file. However, session keys are the preferred mechanism for sharing data over the Internet.
To export captured TLS session keys, follow the steps below:
-
In the main menu select → . Wireshark will open a corresponding dialog Figure 5.14, “Export TLS Session Keys window”.
-
Type the desired file name in the
Save Asfield. -
Choose the destination folder for your file in the
Wherefield. - Press the button to complete the export file procedure.
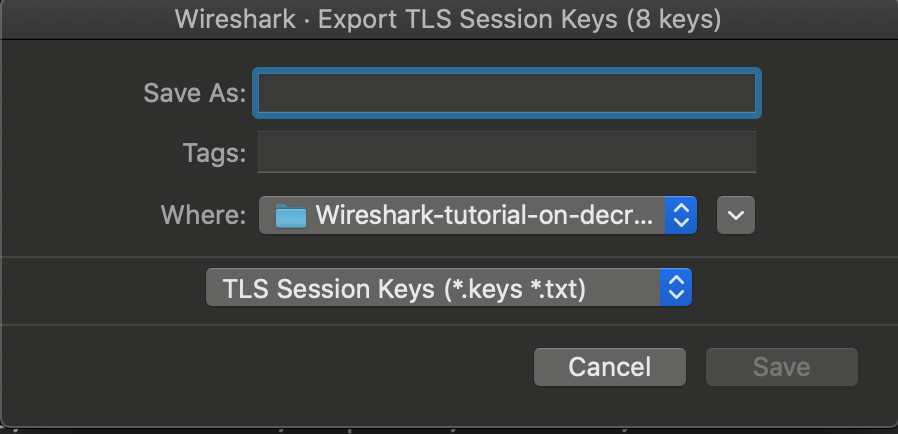
This feature scans through the selected protocol’s streams in the currently open capture file or running capture and allows the user to export reassembled objects to the disk. For example, if you select HTTP, you can export HTML documents, images, executables, and any other files transferred over HTTP to the disk. If you have a capture running, this list is automatically updated every few seconds with any new objects seen. The saved objects can then be opened or examined independently of Wireshark.
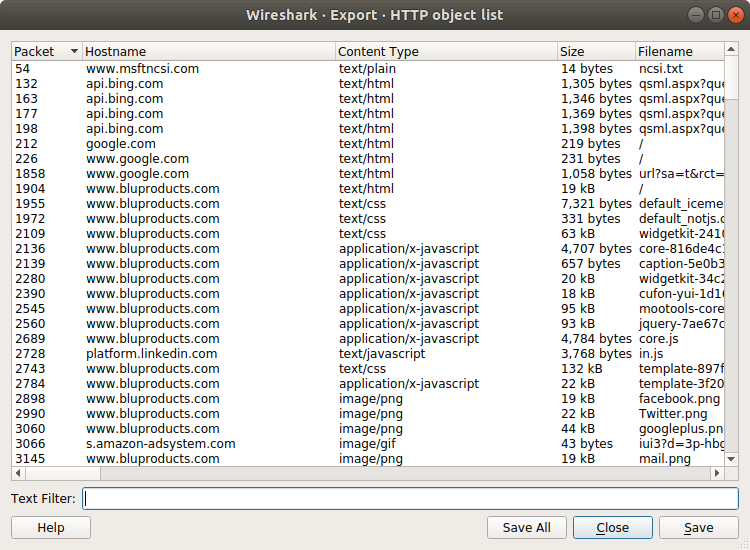
Columns:
- Packet
- The packet number in which this object was found. In some cases, there can be multiple objects in the same packet.
- Hostname
- The hostname of the server that sent this object.
- Content Type
- The content type of this object.
- Size
- The size of this object in bytes.
Filename: The filename for this object. Each protocol generates the filename differently. For example, HTTP uses the final part of the URI and IMF uses the subject of the email.
Inputs:
- Text Filter
- Only displays objects containing the specified text string.
- Help
- Opens this section of the “User’s Guide”.
- Save All
- Saves all objects (including those not displayed) using the filename from the filename column. You will be asked what directory or folder to save them in.
- Close
- Closes the dialog without exporting.
- Save
- Saves the currently selected object as a filename you specify. The default filename to save as is taken from the filename column of the objects list.
To print packets, select the → menu item. Wireshark will display the “Print” dialog box as shown below.
|
It’s easy to waste paper doing this |
|---|---|
|
Printed output can contain lots of text, particularly if you print packet details and bytes. |
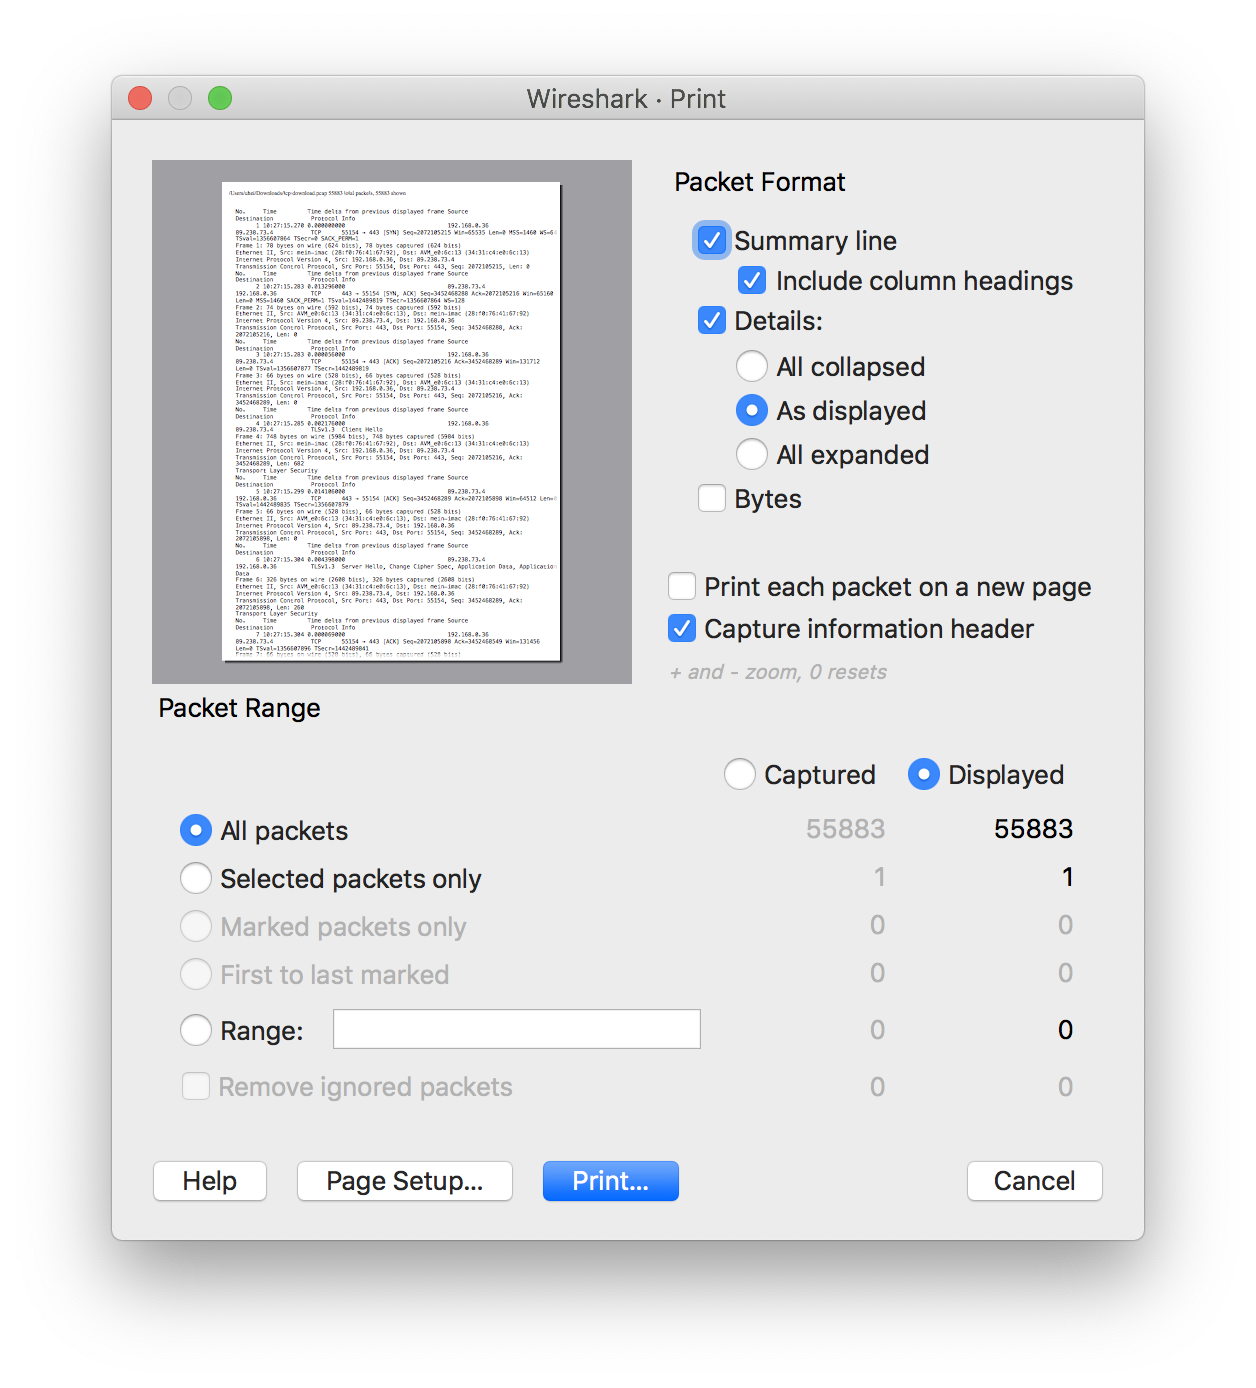
The “Print” dialog box shows a preview area which shows the result of changing the packet format settings. You can zoom in and out using the + (or =) and - keys and reset the zoom level using the 0 key. The following settings are available in the Print dialog box:
- Packet Format
-
Lets you specify what gets printed. See Figure 5.18, “The “Packet Format” frame” for details.
- Summary line
- Include a summary line for each packet. The line will contain the same fields as the packet list.
- Details
- Print details for each packet.
- Bytes
- Print a hex dump of each packet.
- Packet Range
- Select the packets to be printed. See Section 5.9, “The “Packet Range” Frame” for details.
lets you select the page size and orientation.
prints to your default printer.
will close the dialog without printing.
will display this section of the “User’s Guide”.
The packet range frame is a part of the “Export Specified Packets,” “Export Packet Dissections,” and “Print” dialog boxes. You can use it to specify which packets will be exported or printed.
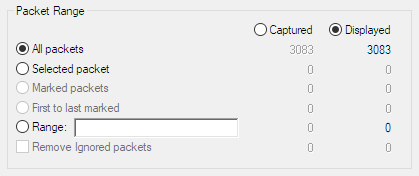
By default, the button is set, which only exports or prints the packets that match the current display filter. Selecting will export or print all packets. You can further limit what you export or print to the following:
- All packets
- All captured or displayed packets depending on the primary selection above.
- Selected packet
- Only the selected packet.
- Marked packets
- Only marked packets. See Section 6.10, “Marking Packets”.
- First to last marked
- Lets you mark an inclusive range of packets.
- Range
- Lets you manually specify a range of packets, e.g., 5,10-15,20- will process the packet number five, the packets from packet number ten to fifteen (inclusive) and every packet from number twenty to the end of the capture.
- Remove ignored packets
- Don’t export or print ignored packets. See Section 6.11, “Ignoring Packets”.
The packet format frame is also a part of the “Export Packet Dissections” and “Print” dialog boxes. You can use it to specify which parts of dissection are exported or printed.
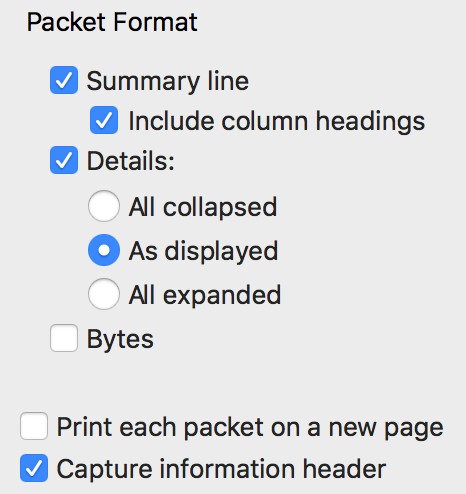
Each of the settings below correspond to the packet list, packet detail, and packet bytes in the main window.
- Packet summary line
-
Export or print each summary line as shown in the “Packet List” pane.
- Include column headings
- Include the column headers before each packet summary line.
- Packet details
-
Export or print the contents of the “Packet Details” tree.
- All collapsed
- Export or print as if the “Packet Details” tree is in the “all collapsed” state.
- As displayed
- Export or print each packet as if its “Packet Details” tree were expanded in the same way as the most recently selected packet.
- All expanded
- Export or print as if the “Packet Details” tree is in the “all expanded” state.
- Packet Bytes
-
Export or print the contents of the “Packet Bytes” pane.
- Include secondary data sources
- Export or print the contents of all tabs of “Packet Bytes” pane, each preceded by the tab label. When unchecked, export or print only the first tab, which contains the frame data directly from the capture file, and not the other tabs, which contain secondary data sources such as decrypted, reassembled, or aligned data.
- Include timestamp preamble
- Export or print each packet timestamp on a line before the “Packet Bytes” contents, using the time format from → .
- Each packet on a new page
- For printing and some export formats, put each packet on a separate page. For example, when exporting to a text file this will put a form feed character between each packet.
- Capture information header
- Add a header to each page with capture filename and the number of total packets and shown packets.
Table of Contents
- 6.1. Viewing Packets You Have Captured
- 6.2. Pop-up Menus
- 6.3. Filtering Packets While Viewing
- 6.4. Building Display Filter Expressions
- 6.4.1. Display Filter Fields
- 6.4.2. Comparing Values
- 6.4.3. Combining Expressions
- 6.4.4. Slice Operator
- 6.4.5. The Layer Operator
- 6.4.6. The At Operator
- 6.4.7. Membership Operator
- 6.4.8. Arithmetic operators
- 6.4.9. Functions
- 6.4.10. Field References
- 6.4.11. Implicit type conversions
- 6.4.12. Sometimes Fields Change Names
- 6.4.13. Some protocol names can be ambiguous
- 6.5. The “Display Filter Expression” Dialog Box
- 6.6. Defining And Saving Filters
- 6.7. Defining And Saving Filter Macros
- 6.8. Finding Packets
- 6.9. Go To A Specific Packet
- 6.10. Marking Packets
- 6.11. Ignoring Packets
- 6.12. Time Display Formats And Time References
- 6.13. Time Shifting Packets
Once you have captured some packets or you have opened a previously saved capture file, you can view the packets that are displayed in the packet list pane by simply clicking on a packet in the packet list pane, which will bring up the selected packet in the tree view and byte view panes.
You can then expand any part of the tree to view detailed information about each protocol in each packet. Clicking on an item in the tree will highlight the corresponding bytes in the byte view. An example with a TCP packet selected is shown in Figure 6.1, “Wireshark with a TCP packet selected for viewing”. It also has the Acknowledgment number in the TCP header selected, which shows up in the byte view as the selected bytes.
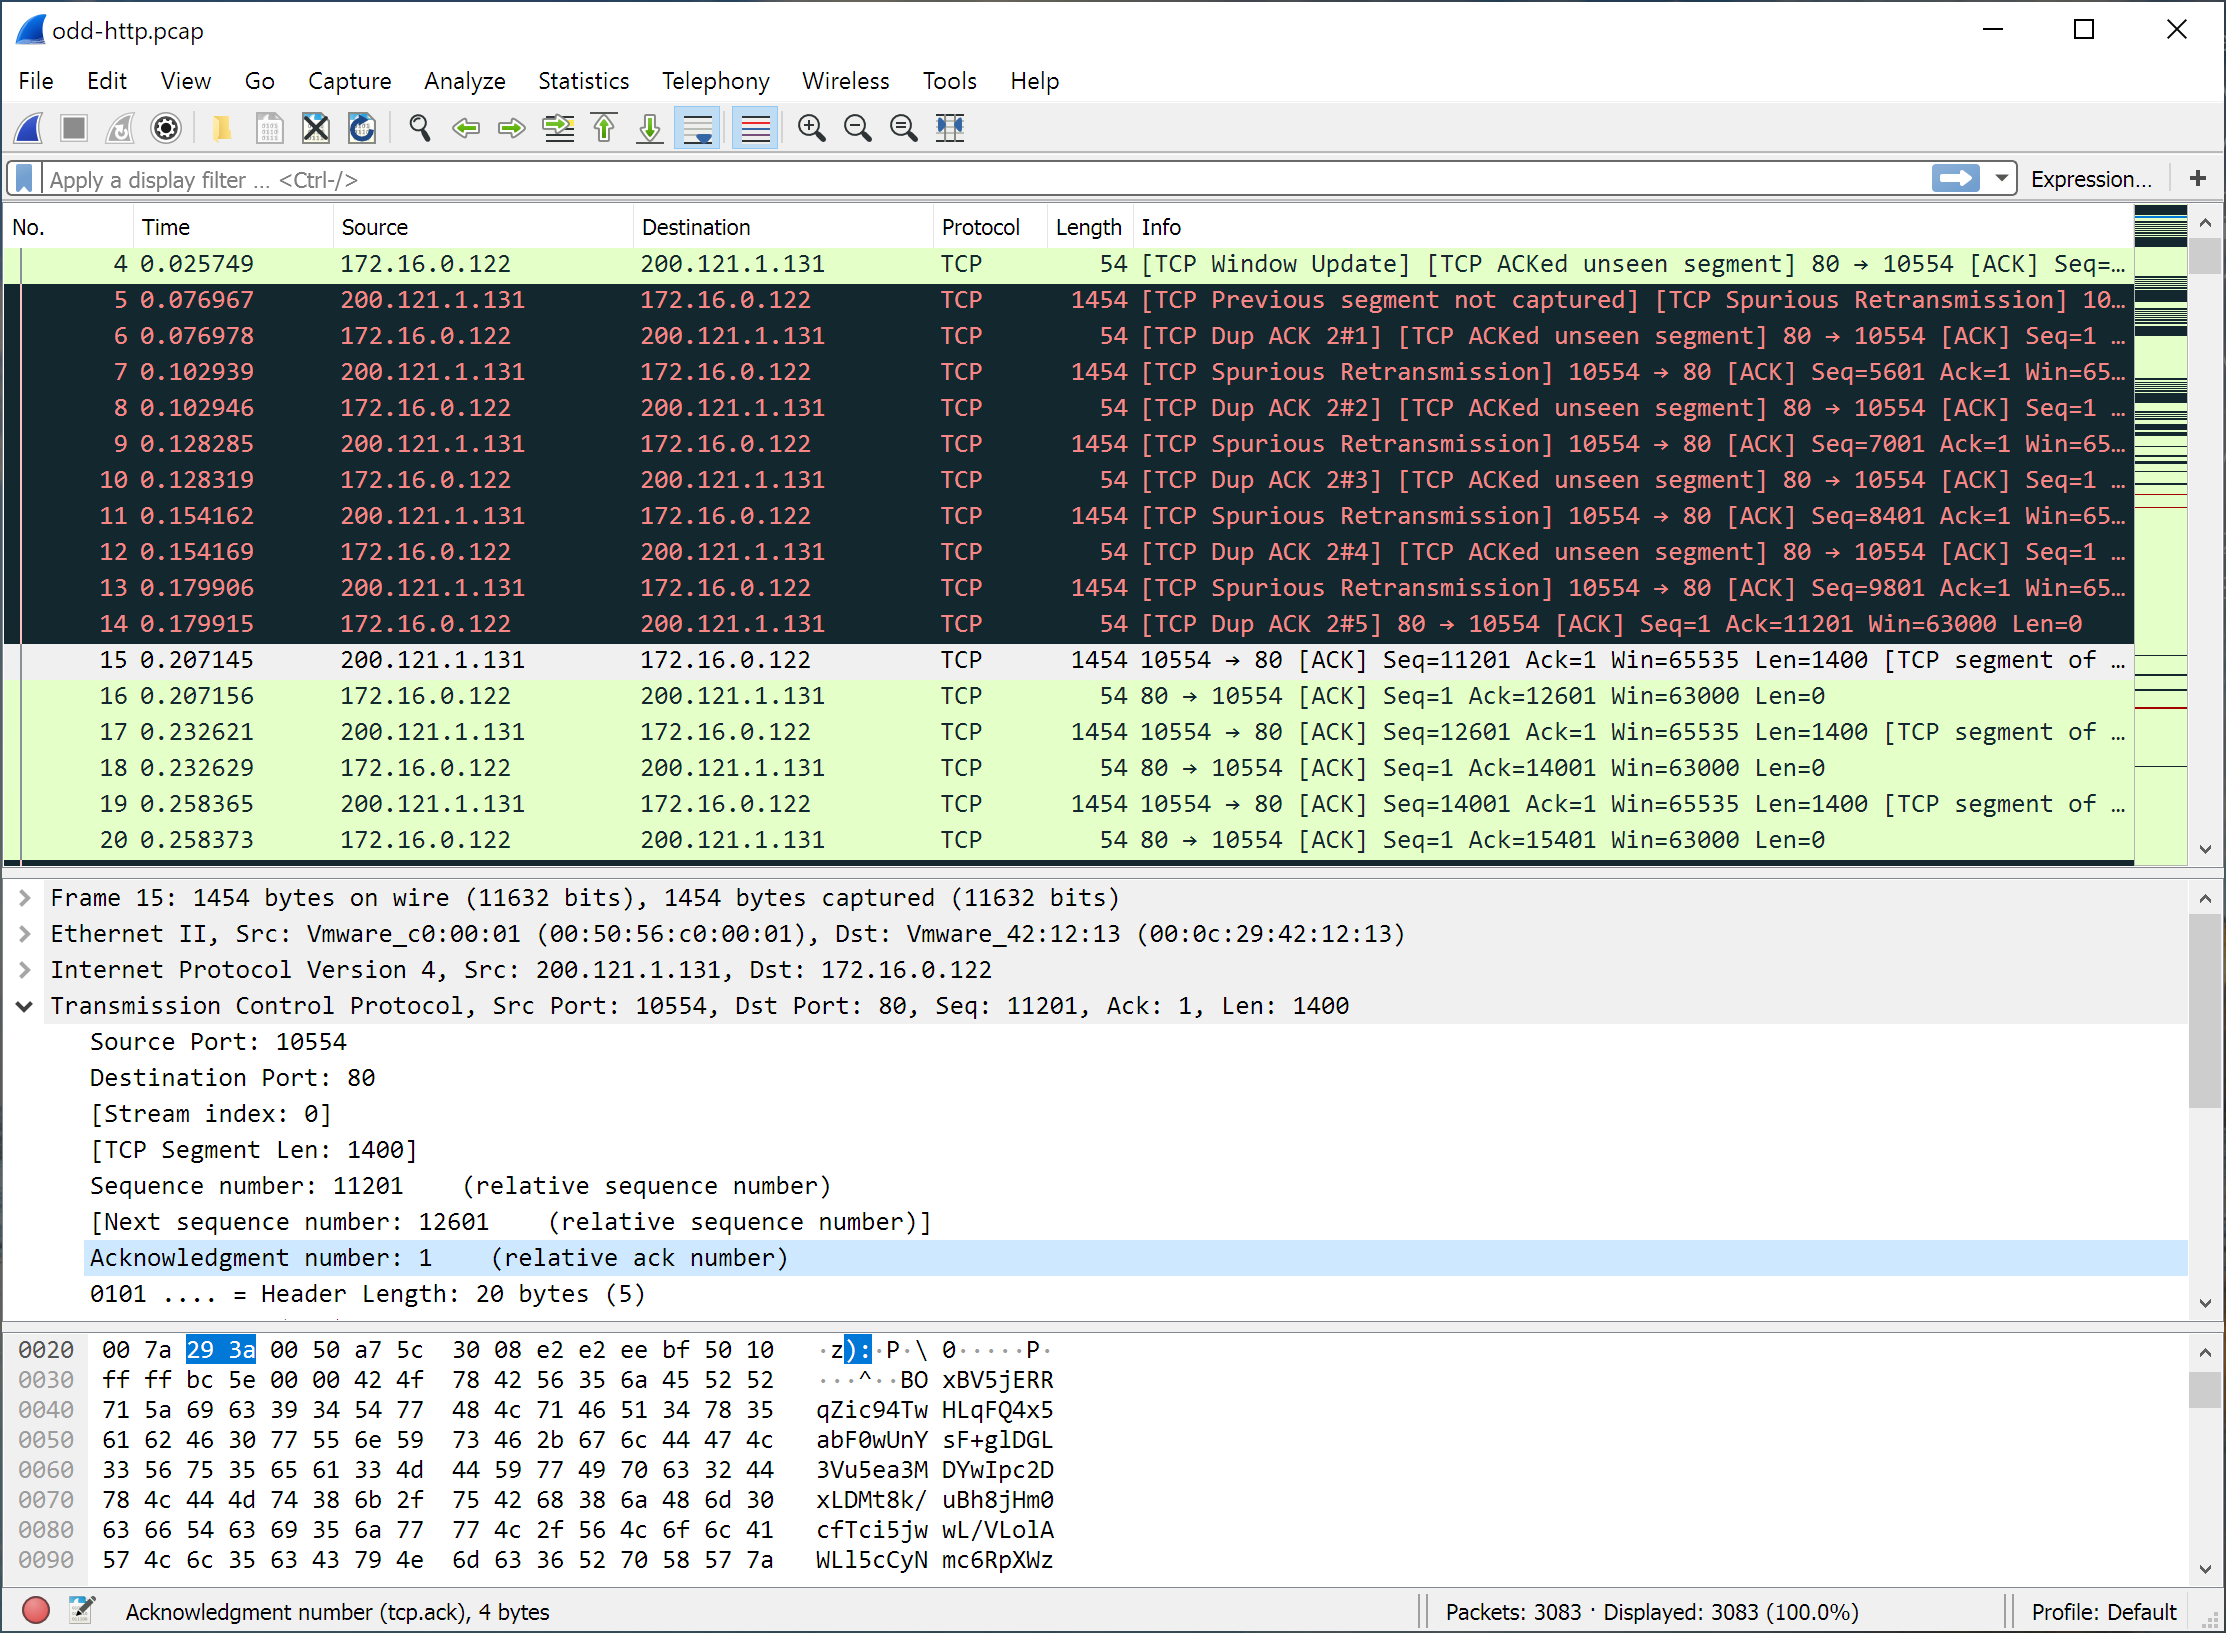
You can also select and view packets the same way while Wireshark is capturing if you selected “Update list of packets in real time” in the “Capture Preferences” dialog box.
In addition you can view individual packets in a separate window as shown in Figure 6.2, “Viewing a packet in a separate window”. You can do this by double-clicking on an item in the packet list or by selecting the packet in which you are interested in the packet list pane and selecting → . This allows you to easily compare two or more packets, even across multiple files.
The single-packet window also has its own find bar for searching within that packet’s protocol tree: see Section 6.8.3, “Finding Text in the Single-Packet Window”.
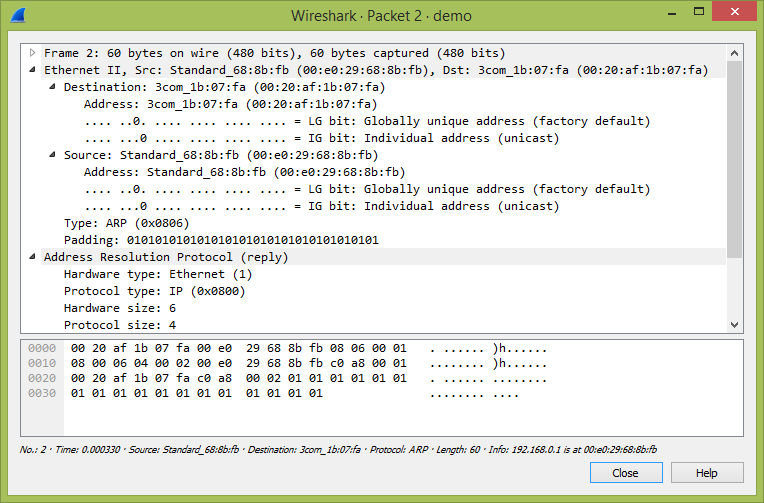
Along with double-clicking the packet list and using the main menu there are a number of other ways to open a new packet window:
- Hold down the shift key and double-click on a frame link in the packet details.
- From Table 6.2, “The menu items of the “Packet List” pop-up menu”.
- From Table 6.3, “The menu items of the “Packet Details” pop-up menu”.
You can open a pop-up menu over the “Packet List”, its column heading, “Packet Details”, or “Packet Bytes” by clicking your right mouse button on the corresponding item.
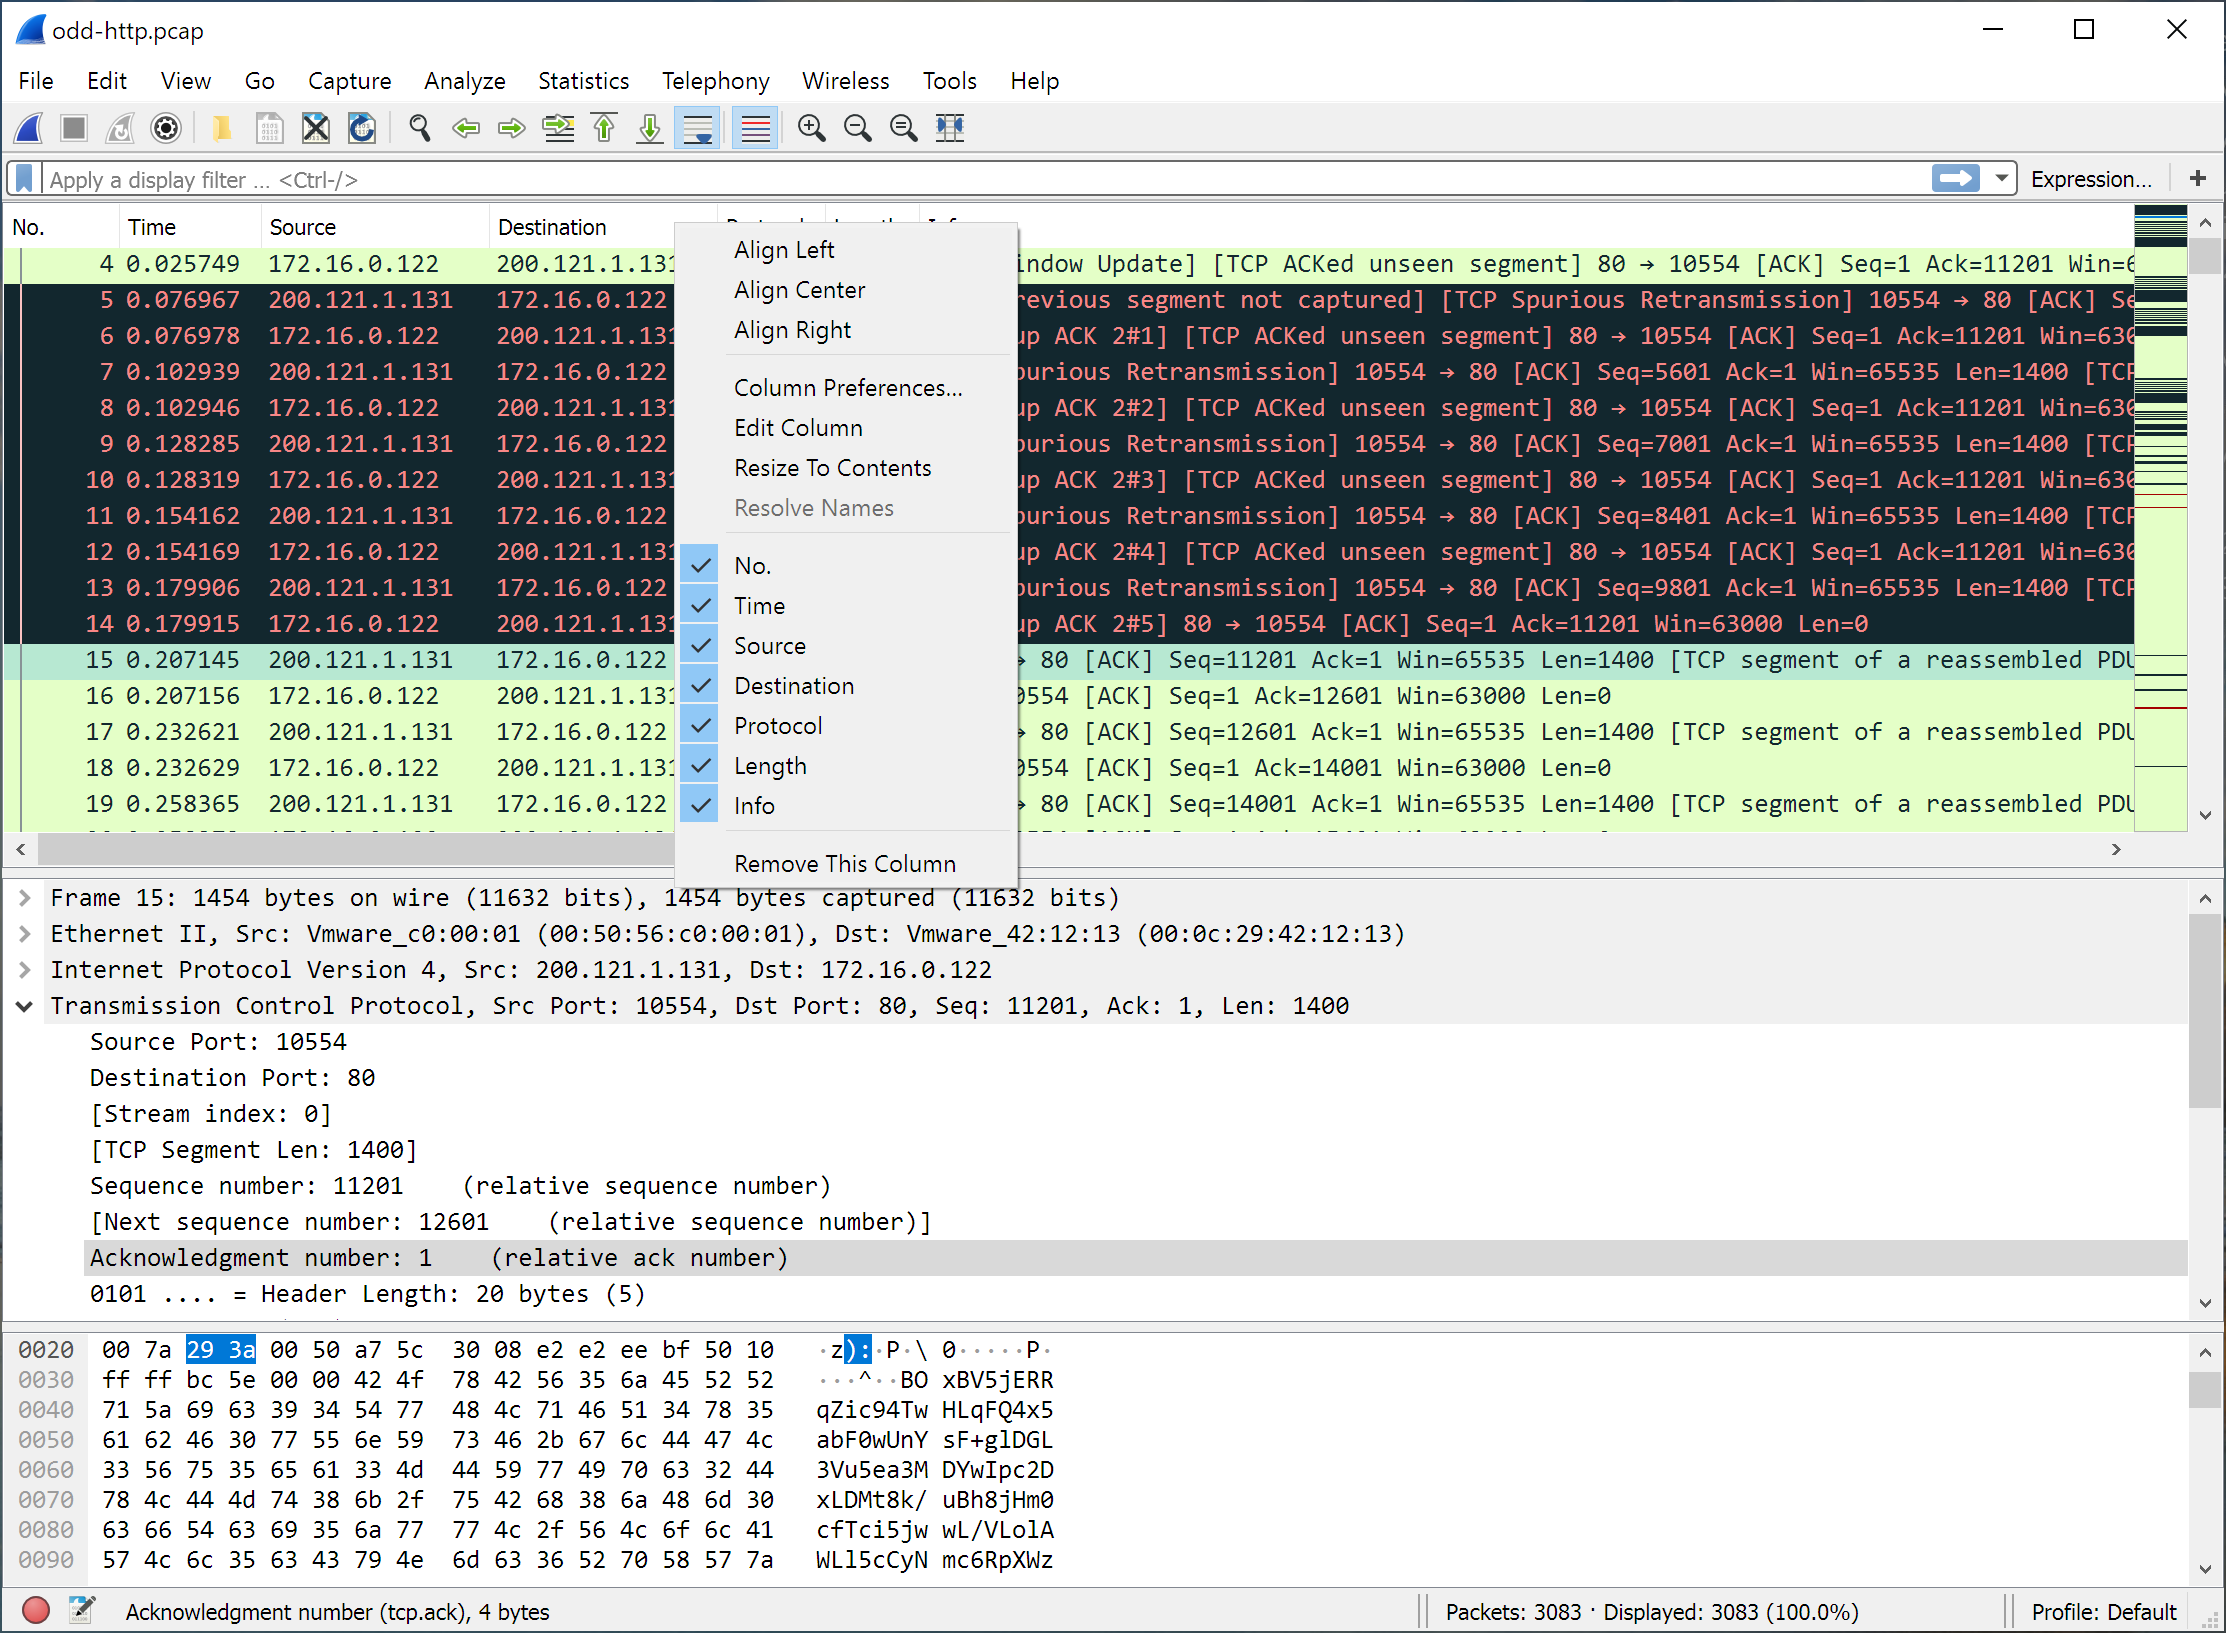
The following table gives an overview of which functions are available in this header, where to find the corresponding function in the main menu, and a description of each item.
Table 6.1. The menu items of the “Packet List” column header pop-up menu
| Item | Description |
|---|---|
Left-align values in this column. |
|
Center-align values in this column. |
|
Right-align values in this column. |
|
Open the “Preferences” dialog for this column. |
|
Open the column editor toolbar for this column. |
|
Resize the column to fit its values. |
|
Display the raw values for fields. |
|
Display human-readable strings instead of raw values for fields. Only applicable to custom columns with fields that have value strings and custom columns which can be resolved to strings. |
|
Display the values using the same format as in Packet Details. Only applicable to custom columns. |
|
No., Time, Source, et al. |
Show or hide a column by selecting its item. |
Remove this column, similar to deleting it in the “Preferences” dialog. |
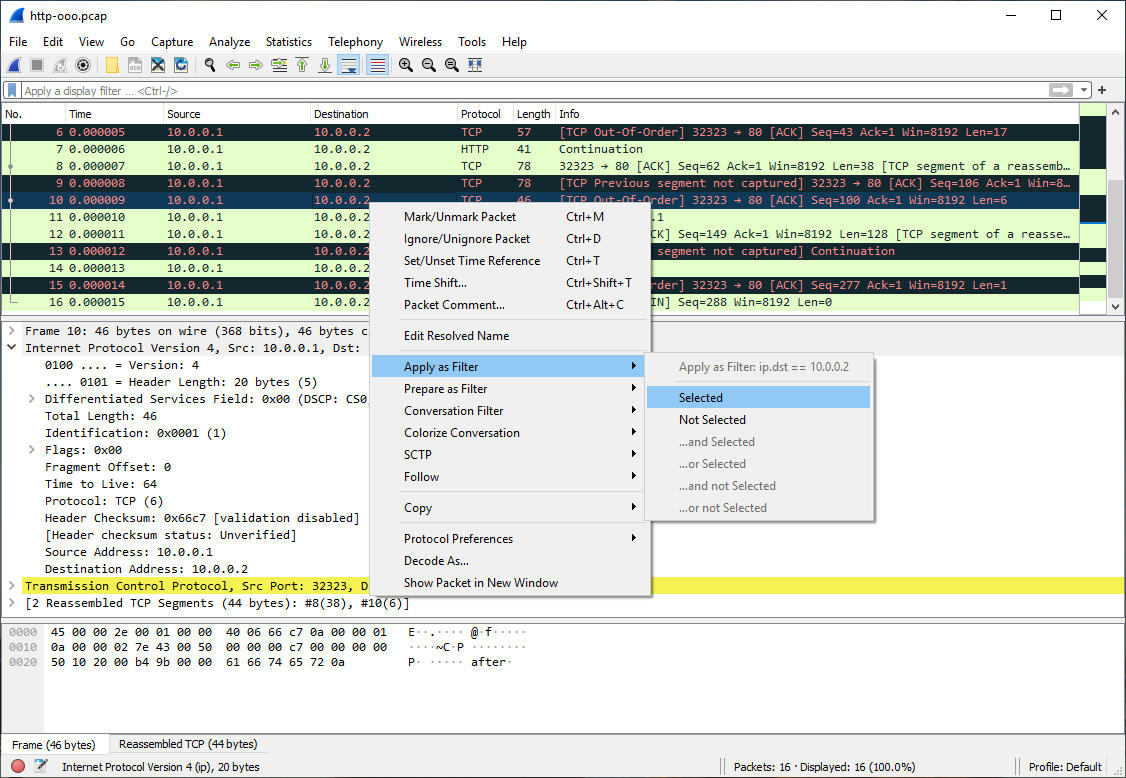
The following table gives an overview of which functions are available in this pane, where to find the corresponding function in the main menu, and a short description of each item.
Table 6.2. The menu items of the “Packet List” pop-up menu
| Item | Corresponding main menu item | Description |
|---|---|---|
Mark or unmark a packet. |
||
Ignore or inspect this packet while dissecting the capture file. |
||
Set or reset a time reference. |
||
Opens the “Time Shift” dialog, which allows you to adjust the timestamps of some or all packets. |
||
Opens the “Packet Comment” dialog, which lets you add a comment to a single packet. Note that the ability to save packet comments depends on your file format. E.g., pcapng supports comments, pcap does not. |
||
Allows you to enter a name to resolve for the selected address. |
||
Immediately replace or append the current display filter based on the most recent packet list or packet details item selected. The first submenu item shows the filter and subsequent items show the different ways that the filter can be applied. |
||
Change the current display filter based on the most recent packet list or packet details item selected, but don’t apply it. The first submenu item shows the filter and subsequent items show the different ways that the filter can be changed. |
||
Apply a display filter with the address information from the selected packet. For example, the IP menu entry will set a filter to show the traffic between the two IP addresses of the current packet. |
||
Create a new colorizing rule based on address information from the selected packet. |
||
Allows you to analyze and prepare a filter for this SCTP association. See Section 9.13, “SCTP Windows”. |
||
Opens a sub-menu with options of various types of protocol streams to follow. The entries for protocols which aren’t found in the currently selected packet will not be shown. See Section 7.2, “Following Protocol Streams”. |
||
→ |
Copy the summary fields as displayed to the clipboard as tab-separated text. |
|
→ |
Copy the summary fields as displayed to the clipboard as comma-separated text. |
|
→ |
Copy the summary fields as displayed to the clipboard as YAML data. |
|
→ |
Prepare a display filter based on the currently selected item and copy that filter to the clipboard. |
|
→ |
Copy the packet bytes to the clipboard in full “hexdump” format. |
|
→ |
Copy the packet bytes to the clipboard in “hexdump” format without the ASCII portion. |
|
→ |
Copy the packet bytes to the clipboard as ASCII text, excluding non-printable characters. |
|
→ |
Copy the packet bytes to the clipboard as an unpunctuated list of hex digits. |
|
→ |
Copy the packet bytes to the clipboard as raw binary. The data is stored in the clipboard using the MIME type “application/octet-stream”. |
|
Adjust the preferences for the selected protocol, or disable it entirely. (You can re-enable it with the “Enabled Protocols” dialog box.) |
||
Change or apply a new relation between two dissectors. |
||
Shows the selected packet in a separate window. The separate window shows only the packet details and bytes. See Figure 6.2, “Viewing a packet in a separate window” for details. |
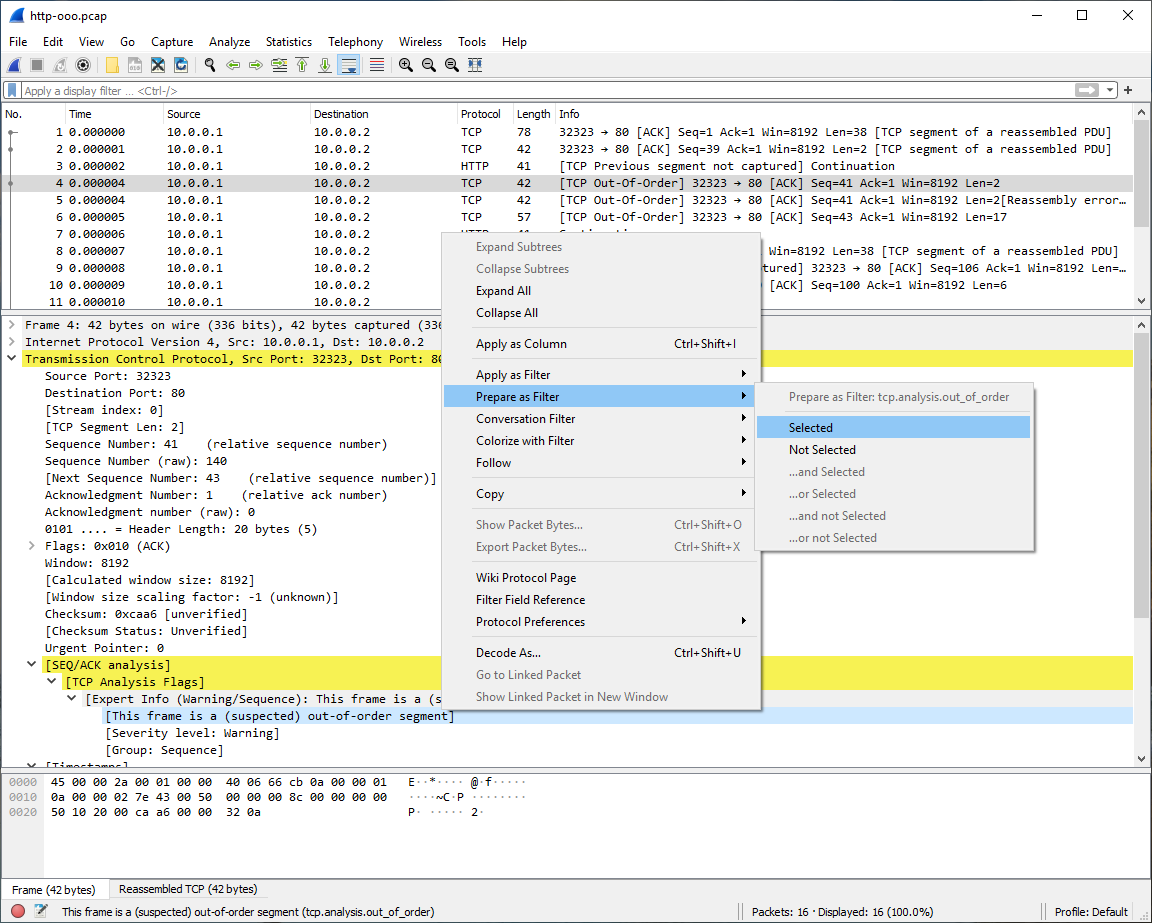
The following table gives an overview of which functions are available in this pane, where to find the corresponding function in the main menu, and a short description of each item.
Table 6.3. The menu items of the “Packet Details” pop-up menu
| Item | Corresponding main menu item | Description |
|---|---|---|
Expand the currently selected subtree. |
||
Collapse the currently selected subtree. |
||
Expand all subtrees in all packets in the capture. |
||
Wireshark keeps a list of all the protocol subtrees that are expanded, and uses it to ensure that the correct subtrees are expanded when you display a packet. This menu item collapses the tree view of all packets in the capture list. |
||
Allows you to enter a name to resolve for the selected address. |
||
Use the selected protocol item to create a new column in the packet list. |
||
Immediately replace or append the current display filter based on the most recent packet list or packet details item selected. The first submenu item shows the filter and subsequent items show the different ways that the filter can be applied. |
||
Change the current display filter based on the most recent packet list or packet details item selected, but don’t apply it. The first submenu item shows the filter and subsequent items show the different ways that the filter can be changed. |
||
This menu item uses a display filter with the information from the selected protocol item to build a new colorizing rule. |
||
Opens a sub-menu with options of various types of protocol streams to follow. The entries for protocols which aren’t found in the currently selected packet will not be shown. See Section 7.2, “Following Protocol Streams”. |
||
→ |
Copy the packet details as displayed. |
|
→ |
Copy the selected packet detail and its children as displayed. |
|
→ |
Copy the displayed text of the selected field to the system clipboard. |
|
→ |
Copy the name of the selected field to the system clipboard. |
|
→ |
Copy the value of the selected field to the system clipboard. |
|
→ |
Prepare a display filter based on the currently selected item and copy it to the clipboard. |
|
→ |
Copy the packet bytes to the clipboard in full “hexdump” format. |
|
→ |
Copy the packet bytes to the clipboard in “hexdump” format without the ASCII portion. |
|
→ |
Copy the packet bytes to the clipboard as ASCII text, excluding non-printable characters. |
|
→ |
Copy the packet bytes to the clipboard as an unpunctuated list of hex digits. |
|
→ |
Copy the packet bytes to the clipboard as raw binary. The data is stored in the clipboard using the MIME type “application/octet-stream”. |
|
→ |
Copy the packet bytes to the clipboard as C-style escape sequences. |
|
This menu item is the same as the File menu item of the same name. It allows you to export raw packet bytes to a binary file. |
||
Open the wiki page for the selected protocol in your web browser. |
||
Open the filter field reference web page for the selected protocol in your web browser. |
||
Adjust the preferences for the selected protocol, or disable it entirely. (You can re-enable it with the “Enabled Protocols” dialog box.) |
||
Change or apply a new relation between two dissectors. |
||
If the selected field has a corresponding packet such as the matching request for a DNS response, go to it. |
||
If the selected field has a corresponding packet such as the matching request for a DNS response, show the selected packet in a separate window. See Figure 6.2, “Viewing a packet in a separate window” for details. |
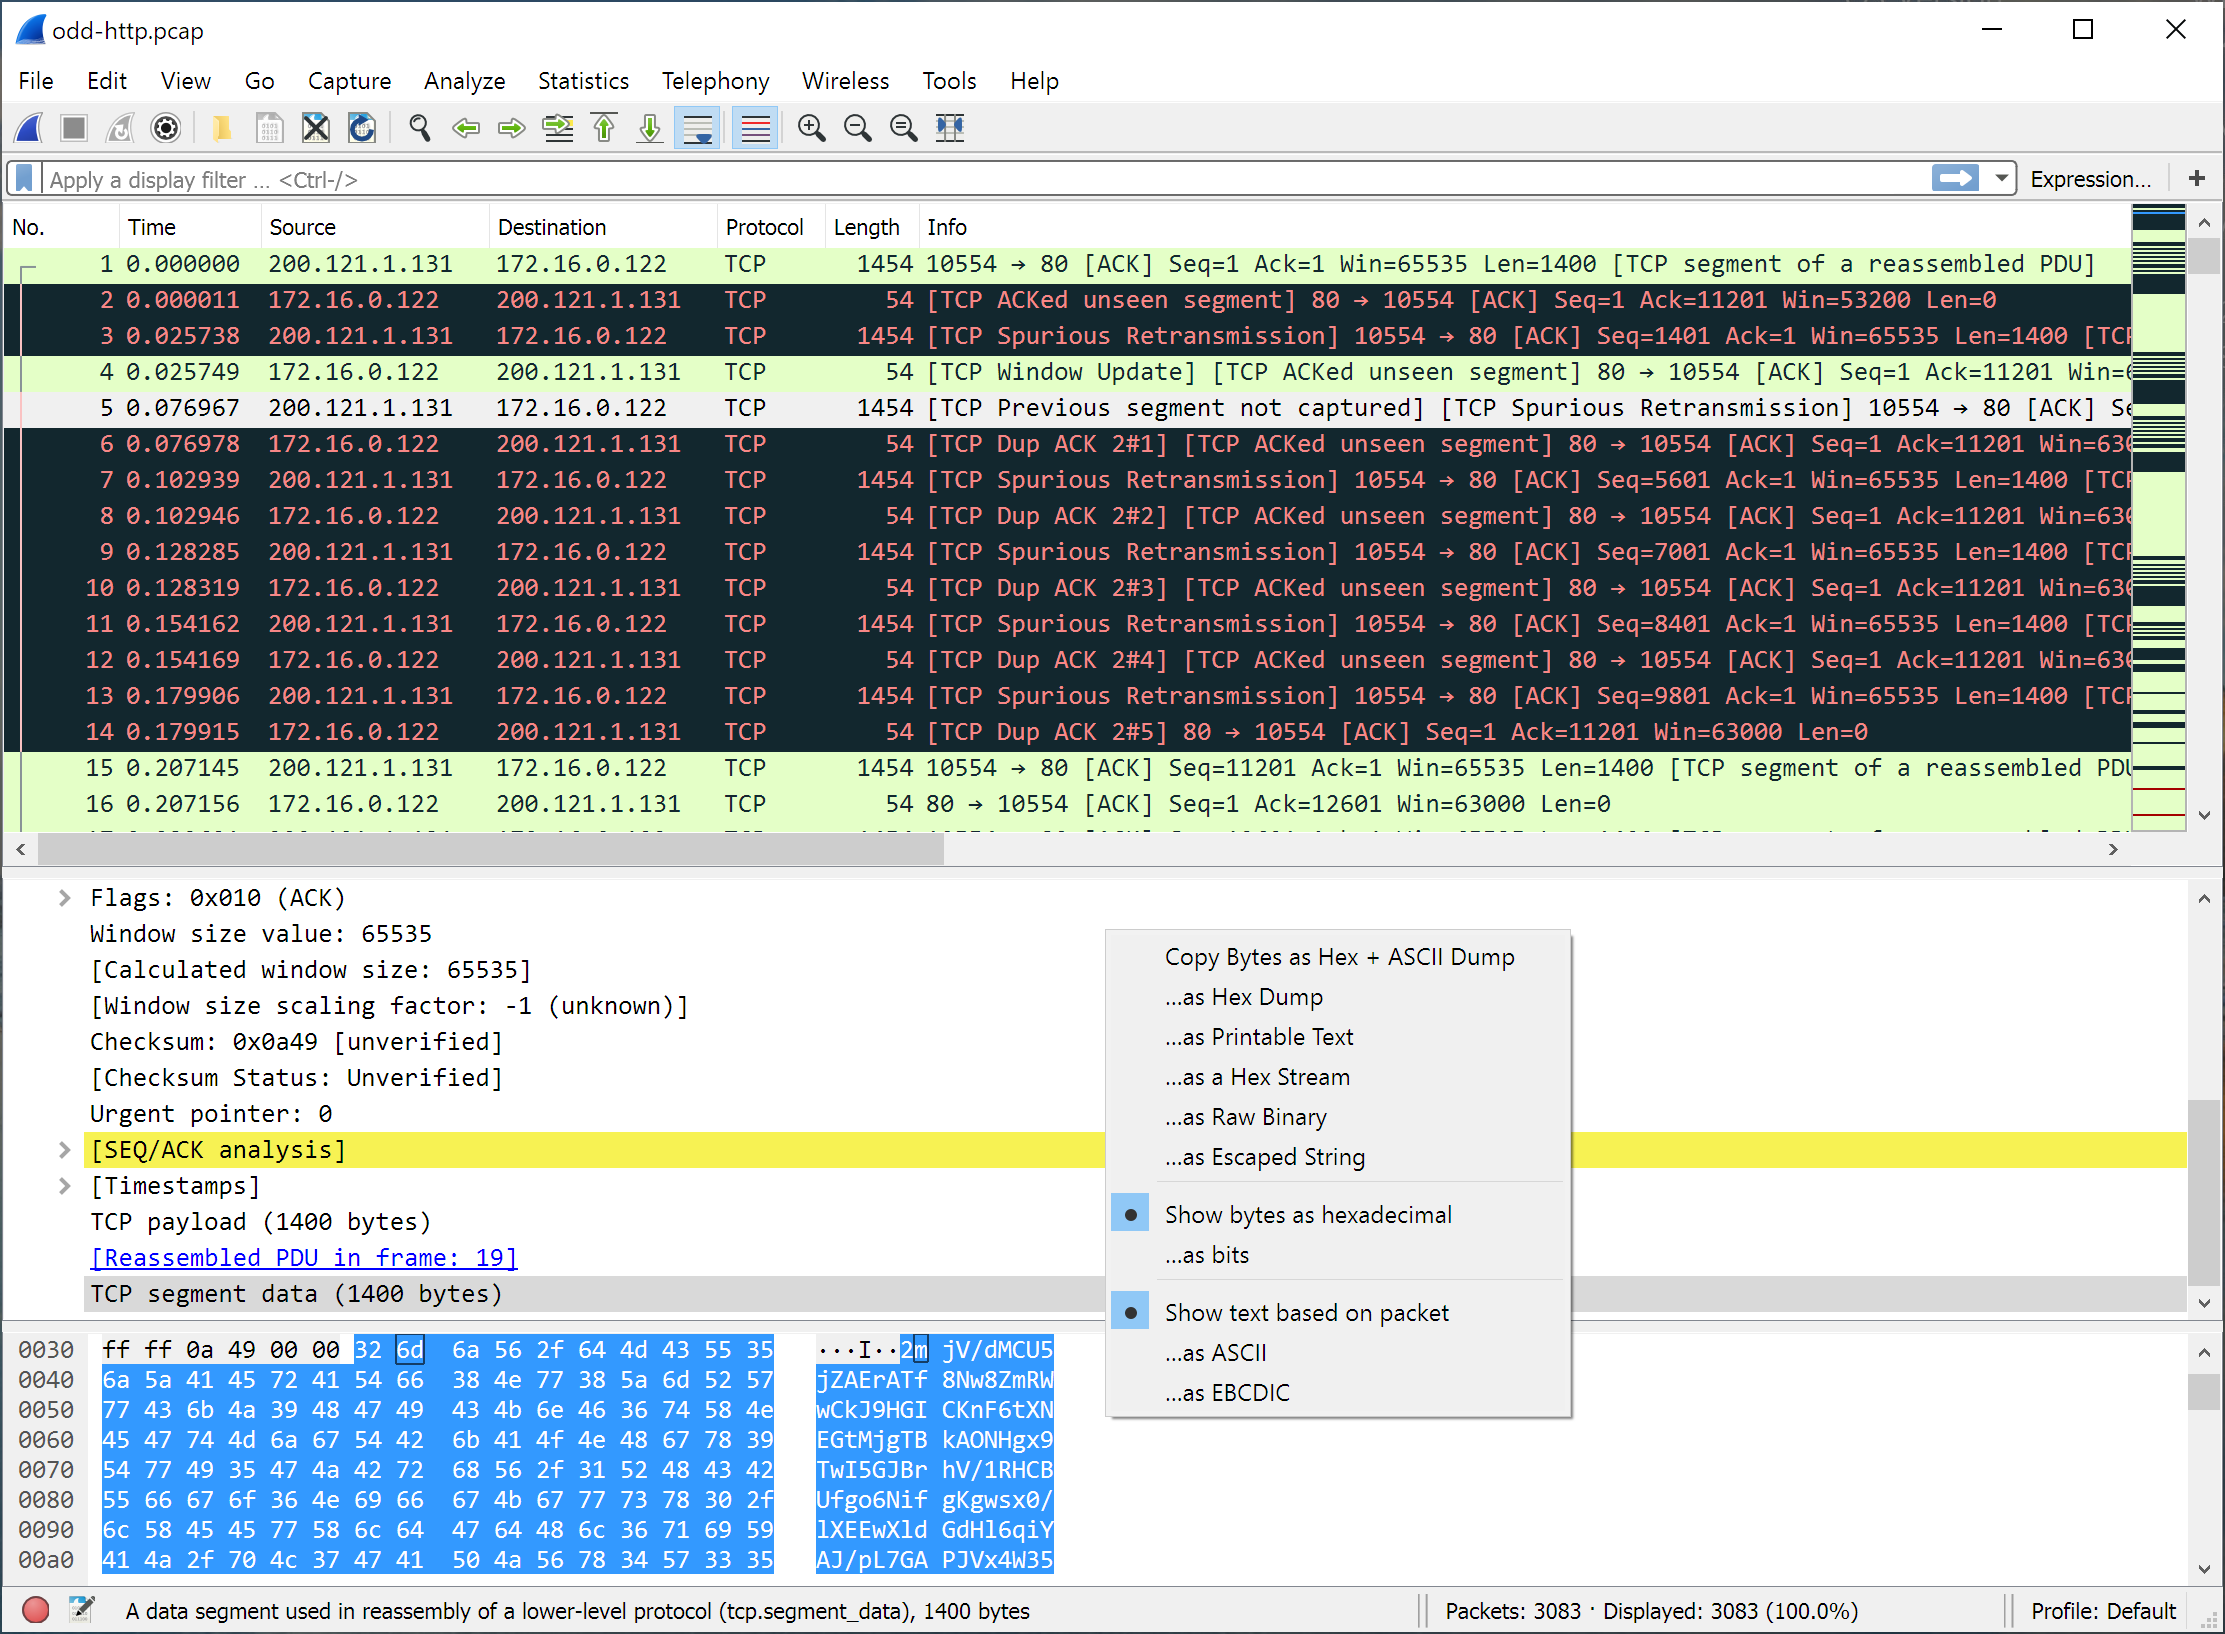
The following table gives an overview of which functions are available in this pane along with a short description of each item.
Table 6.4. The menu items of the “Packet Bytes” pop-up menu
| Item | Description |
|---|---|
Copy the packet bytes to the clipboard in full “hexdump” format. |
|
Copy the packet bytes to the clipboard in “hexdump” format without the ASCII portion. |
|
Copy the packet bytes to the clipboard as ASCII text, excluding non-printable characters. |
|
Copy the packet bytes to the clipboard as an unpunctuated list of hex digits. |
|
Copy the packet bytes to the clipboard as raw binary. The data is stored in the clipboard using the MIME type “application/octet-stream”. |
|
Copy the packet bytes to the clipboard as C-style escape sequences. |
|
Display the byte data as hexadecimal digits. |
|
Display the byte data as binary digits. |
|
Show the “hexdump” data with text. |
|
Use ASCII encoding when displaying “hexdump” text. |
|
Use EBCDIC encoding when displaying “hexdump” text. |
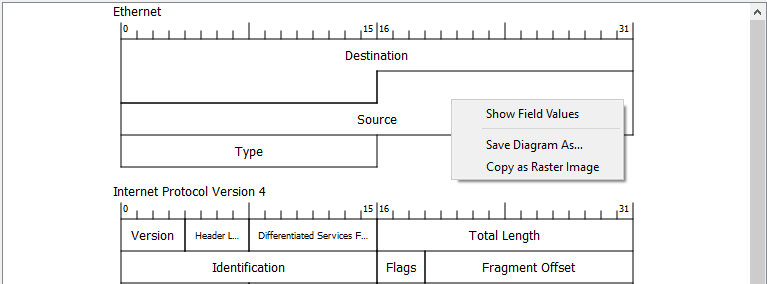
The following table gives an overview of which functions are available in this pane along with a short description of each item.
Table 6.5. The menu items of the “Packet Diagram” pop-up menu
| Item | Description |
|---|---|
Display current value for each field on the packet diagram. |
|
Save the packet diagram to an image file (PNG, BMP, JPEG). |
|
Copy the packet diagram to the clipboard in raster (ARGB32) format. |
Wireshark has two filtering languages: capture filters and display filters. Capture filters are used for filtering when capturing packets and are discussed in Section 4.10, “Filtering while capturing”. Display filters are used for filtering which packets are displayed and are discussed below. For more information about display filter syntax, see the wireshark-filter(4) man page.
Display filters allow you to concentrate on the packets you are interested in while hiding the currently uninteresting ones. They allow you to only display packets based on:
- Protocol
- The presence of a field
- The values of fields
- A comparison between fields
- … and a lot more!
To only display packets containing a particular protocol, type the protocol name in the display filter toolbar of the Wireshark window and press enter to apply the filter. Figure 6.8, “Filtering on the TCP protocol” shows an example of what happens when you type tcp in the display filter toolbar.
|
Note |
|---|---|
|
Protocol and field names are usually in lowercase. |
|
Note |
|---|---|
|
Don’t forget to press enter or click on the apply display filter button after entering the filter expression. |
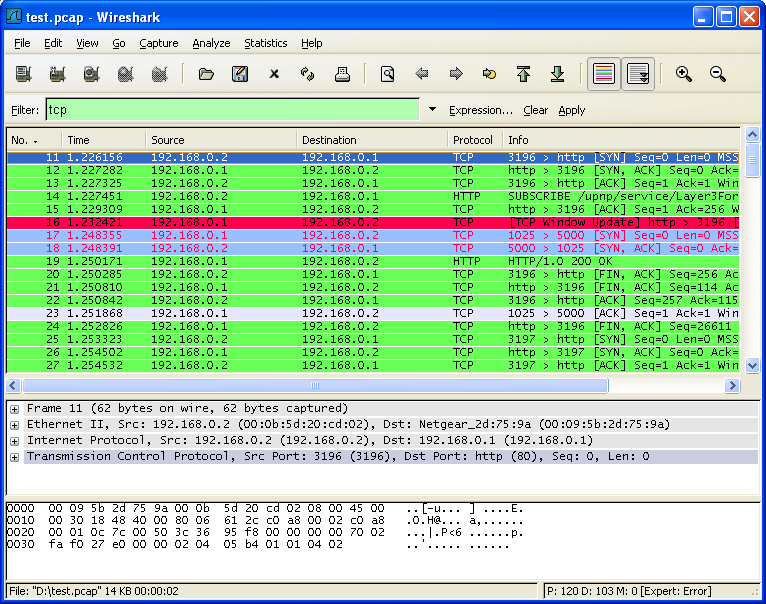
As you may have noticed, only packets containing the TCP protocol are now displayed, so packets 1-10 are hidden and packet number 11 is the first packet displayed.
|
Note |
|---|---|
|
When using a display filter, all packets remain in the capture file. The display filter only changes the display of the capture file but not its content! |
To remove the filter, click on the button to the right of the display filter field. All packets will become visible again.
Display filters can be very powerful and are discussed in further detail in Section 6.4, “Building Display Filter Expressions”
It’s also possible to create display filters with the Display Filter Expression dialog box. More information about the Display Filter Expression dialog box is available in Section 6.5, “The “Display Filter Expression” Dialog Box”.
Wireshark provides a display filter language that enables you
to precisely control which packets are displayed. They can be used
to check for the presence of a protocol or field, the value of a field, or
even compare two fields to each other. These comparisons can be combined
with logical operators, like and and or, and parentheses
into complex expressions.
The following sections will go into the display filter functionality in more detail.
|
Tip |
|---|---|
|
There are many display filter examples on the Wireshark Wiki Display Filter page at: https://wiki.wireshark.org/DisplayFilters. |
The simplest display filter is one that displays a single protocol.
To only display packets containing a particular protocol, type the protocol
into Wireshark’s display filter toolbar. For example, to only
display TCP packets, type tcp into Wireshark’s display filter toolbar.
Similarly, to only display
packets containing a particular field, type the field
into Wireshark’s display filter toolbar. For example, to only display
HTTP requests, type http.request into Wireshark’s display filter toolbar.
You can filter on any protocol that Wireshark supports. You can also filter on any field that a dissector adds to the tree view, if the dissector has added an abbreviation for that field. A full list of the available protocols and fields is available through the menu item → → .
You can build display filters that compare values using a number of different
comparison operators. For example, to only display packets to or
from the IP address 192.168.0.1, use ip.addr==192.168.0.1.
A complete list of available comparison operators is shown in Table 6.6, “Display Filter comparison operators”.
|
Tip |
|---|---|
|
English and C-like operators are interchangeable and can be mixed within a filter string. Beginning in Wireshark 5.0, the English forms of operators (but not field, function, or macro names, or the first characters in escape sequences) are case-insensitive. |
Table 6.6. Display Filter comparison operators
| English | Alias | C-like | Description | Example |
|---|---|---|---|---|
|
|
|
Equal (any if more than one) |
|
|
|
|
Not equal (all if more than one) |
|
|
|
Equal (all if more than one) |
|
|
|
|
Not equal (any if more than one) |
|
|
|
|
Greater than |
|
|
|
|
Less than |
|
|
|
|
Greater than or equal to |
|
|
|
|
Less than or equal to |
|
|
|
Protocol, field or slice contains a value |
|
||
|
|
Protocol or text field matches a Perl-compatible regular expression |
|
|
Note |
|---|---|
|
The meaning of |
All protocol fields have a type. Section 6.4.2.1, “Display Filter Field Types” provides a list of the types with examples of how to use them in display filters.
- Unsigned integer
-
Can be 8, 16, 24, 32, or 64 bits. You can express integers in decimal, octal, hexadecimal or binary. The following display filters are equivalent:
ip.len le 1500ip.len le 02734ip.len le 0x5dcip.len le 0b10111011100 - Signed integer
- Can be 8, 16, 24, 32, or 64 bits. As with unsigned integers you can use decimal, octal, hexadecimal or binary.
- Boolean
-
Can be
1orTrue,0orFalse.A Boolean field is present regardless if its value is true or false. For example,
tcp.flags.synis present in all TCP packets containing the flag, whether the SYN flag is 0 or 1. To only match TCP packets with the SYN flag set, you need to usetcp.flags.syn == 1ortcp.flags.syn == True. - Ethernet address
-
6 bytes separated by a colon (:), dot (.), or dash (-) with one or two bytes between separators:
eth.dst == ff:ff:ff:ff:ff:ffeth.dst == ff-ff-ff-ff-ff-ffeth.dst == ffff.ffff.ffff - IPv4 address
-
ip.addr == 192.168.0.1Classless InterDomain Routing (CIDR) notation can be used to test if an IPv4 address is in a certain subnet. For example, this display filter will find all packets in the 129.111 Class-B network:
ip.addr == 129.111.0.0/16 - IPv6 address
-
ipv6.addr == ::1As with IPv4 addresses, IPv6 addresses can match a subnet.
- Text string
-
http.request.uri == "https://www.wireshark.org/"Strings are a sequence of bytes. Functions like
lower()use ASCII, otherwise no particular encoding is assumed. String literals are specified with double quotes. Characters can also be specified using escape sequences as in C or C++:Table 6.7. Display Filter Escape Sequences in Character and String Literals
\'single quote
\"double quote
\\backslash
\aaudible bell
\bbackspace
\fform feed
\nline feed
\rcarriage return
\thorizontal tab
\vvertical tab
\dddarbitrary octal value
\xhharbitrary hexadecimal value
\uhhhhUnicode codepoint U+hhhh
\UhhhhhhhhUnicode codepoint U+hhhhhhhh
where
handdare hex and octal numerical digits respectively:dns.qry.name contains "www.\x77\x69\x72\x65\x73\x68\x61\x72\x6b.org"Alternatively, a raw string syntax can be used. Such strings are prefixed with
rorRand treat backslash as a literal character.http.user_agent matches r"\(X11;"Paired directional ("smart" or "curly") double quotes can be used in lieu of straight double quotes. This is mostly to handle example filters copied from webpages that helpfully replace straight quotes, but it possible to include straight double quotes unescaped in directional double quote enclosed raw string literals. A right directional double quote can be escaped in a string literal opened by a left directional double quote.
- Date and time
-
frame.time == "Sep 26, 2004 23:18:04.954975"ntp.xmt ge "2020-07-04 12:34:56"The value of an absolute time field is expressed as a string, using one of the two formats above. Fractional seconds can be omitted or specified up to nanosecond precision; extra trailing zeros are allowed but not other digits. The string cannot take a time zone suffix, and is always parsed as in the local time zone, even for fields that are displayed in UTC.
In the first format, the abbreviated month names must be in English regardless of locale. In the second format, any number of time fields may be omitted, in the order from least significant (seconds) to most, but at least the entire date must be specified:
frame.time < "2022-01-01"In the second format, a
Tmay appear between the date and time as in ISO 8601, but not when less significant times are dropped.
udp contains 81:60:03
The display filter above matches packets that contains the 3-byte sequence 0x81, 0x60, 0x03 anywhere in the UDP header or payload.
sip.To contains "a1762"
The display filter above matches packets where the SIP To-header contains the string "a1762" anywhere in the header.
http.host matches "acme\\.(org|com|net)"
The display filter above matches HTTP packets where the HOST header contains acme.org, acme.com, or acme.net. Comparisons are case-insensitive.
tcp.flags & 0x02
That display filter will match all packets that contain the “tcp.flags” field with the 0x02 bit, i.e., the SYN bit, set.
String literals containing regular expressions are parsed twice. Once by Wireshark’s display
filter engine and again by the PCRE2 library. It’s important to keep this in mind when using
the matches operator with regex escape sequences and special characters.
For example, the filter expression frame matches "AB\x43" uses the string "ABC" as input
pattern to PCRE. However, the expression frame matches "AB\\x43" uses the string "AB\x43"
as the pattern. In this case both expressions give the same result because Wireshark and PCRE
both support the same byte escape sequence (0x43 is the ASCII hex code for C).
An example where this fails badly is foo matches "bar\x28". Because 0x28 is the ASCII
code for ( the pattern input to PCRE is "bar(". This regular expression is syntactically
invalid (missing closing parenthesis). To match a literal parenthesis in a display filter regular
expression it must be escaped (twice) with backslashes.
|
Tip |
|---|---|
|
Using raw strings avoids most problems with the |
You can combine filter expressions in Wireshark using the logical operators shown in Table 6.8, “Display Filter Logical Operations”
Table 6.8. Display Filter Logical Operations
| English | C-like | Description | Example |
|---|---|---|---|
|
|
Logical AND |
|
|
|
Logical OR |
|
|
|
Logical XOR |
|
|
|
Logical NOT |
|
|
Subsequence |
See “Slice Operator” below. |
|
|
Set Membership |
|
Wireshark allows you to select a subsequence of byte arrays (including
protocols) or text strings in rather elaborate ways. After a label you can
place a pair of brackets [] containing a comma separated list of range
specifiers.
eth.src[0:3] == 00:00:83
The example above uses the n:m format to specify a single range. In this case n
is the beginning offset and m is the length of the range being specified.
eth.src[1-2] == 00:83
The example above uses the n-m format to specify a single range. In this case n
is the beginning offset and m is the ending offset.
eth.src[:4] == 00:00:83:00
The example above uses the :m format, which takes everything from the beginning
of a sequence to offset m. It is equivalent to 0:m.
eth.src[4:] == 20:20
The example above uses the n: format, which takes everything from offset n to
the end of the sequence.
eth.src[2] == 83
The example above uses the n format to specify a single range. In this case the
element in the sequence at offset n is selected. This is equivalent to n:1.
eth.src[0:3,1-2,:4,4:,2] == 00:00:83:00:83:00:00:83:00:20:20:83
Wireshark allows you to string together single ranges in a comma separated list to form compound ranges as shown above.
You can use the slice operator on a protocol name, too, to slice the
bytes associated with that protocol. The frame protocol can be useful,
encompassing all the captured data (not including secondary data sources
like decrypted data.)
Offsets can be negative, indicating an offset from the end of a field.
frame[-4:4] == 0.1.2.3 frame[-4:] == 0.1.2.3
The two examples above both check the last four bytes of a frame.
Slices of string fields yield strings, and are indexed on codepoint boundaries after conversion of the string to UTF-8, not bytes.
http.content_type[0:4] == "text" smpp.message_text[:10] == "Абвгдеёжзи"
The second example above will match regardless of whether the original string was in Windows-1251, UTF-8, or UTF-16, so long as the converted string starts with those ten characters.
Byte slices can be directly compared to strings; this converts the
string to the corresponding UTF-8 byte sequence. To compare string
slices with byte sequences, use the @ operator, below.
A field can be restricted to a certain layer in the protocol stack using the
layer operator (#), followed by a decimal number:
ip.addr#2 == 192.168.30.40
matches only the inner (second) layer in the packet.
Layers use simple stacking semantics and protocol layers are counted sequentially starting from 1.
For example, in a packet that contains two IPv4 headers, the outer (first) source address can be matched with ip.src#1 and the inner (second) source address can be matched with ip.src#2.
For more complicated ranges the same syntax used with slices is valid:
tcp.port#[2-4]
means layers number 2, 3 or 4 inclusive. The hash symbol is required to distinguish a layer range from a slice.
By prefixing the field name with an at sign (@) the comparison is done against
the raw packet data for the field.
A character string must be decoded from a source encoding during dissection. If there are decoding errors the resulting string will usually contain replacement characters:
browser.comment == "string is ����"
The at operator allows testing the raw undecoded data:
@browser.comment == 73:74:72:69:6e:67:20:69:73:20:aa:aa:aa:aa
The syntactical rules for a bytes field type apply to the second example.
|
Note |
|---|---|
|
When a bytes field is compared with a literal string, it is compared with the UTF-8 representation of that string. The at operator compares a string field with the actual byte representation in the original encoding, which may not be UTF-8. As an example, SMPP has a bytes field, smpp.message[:8] == 00:54:00:65:00:73:00:74 smpp.message[:8] == "\x00T\x00e\x00s\x00t" smpp.message_text[:4] == "Test" smpp.message_text[:4] == "\x54\x65\x73\x74" @smpp.message_text[:8] == 00:54:00:65:00:73:00:74 @smpp.message_text[:8] == "\x00T\x00e\x00s\x00t" The following filters do NOT match. @smpp.message_text[:4] == "\x00T\x00e\x00s\x00t" smpp.message[:4] == "Test" smpp.message[:8] == "Test" @smpp.message_text[:4] == "Test" @smpp.message_text[:8] == "Test" The first filter above does not match because of operator precedence
left-to-right; |
Wireshark allows you to test a field for membership in a set of values or
fields. After the field name, use the in operator followed by the set items
surrounded by braces {}. For example, to display packets with a TCP source or
destination port of 80, 443, or 8080, you can use tcp.port in {80, 443, 8080}.
Set elements must be separated by commas.
The set of values can also contain ranges: tcp.port in {443,4430..4434}.
|
Note |
|---|---|
|
The display filter tcp.port in {80, 443, 8080}
is equivalent to tcp.port == 80 || tcp.port == 443 || tcp.port == 8080 However, the display filter tcp.port in {443, 4430..4434}
is not equivalent to tcp.port == 443 || (tcp.port >= 4430 && tcp.port <= 4434) This is because comparison operators are satisfied when any field
matches the filter, so a packet with a source port of 56789 and
destination port of port 80 would also match the second filter
since |
Sets are not just limited to numbers, other types can be used as well:
http.request.method in {"HEAD", "GET"}
ip.addr in {10.0.0.5 .. 10.0.0.9, 192.168.1.1..192.168.1.9}
frame.time_delta in {10 .. 10.5}
You can perform the arithmetic operations on numeric fields shown in Table 6.9, “Display Filter Arithmetic Operations”
Table 6.9. Display Filter Arithmetic Operations
| Name | Syntax | Alternative | Description |
|---|---|---|---|
Unary minus |
|
Negation of A |
|
Addition |
|
Add B to A |
|
Subtraction |
|
Subtract B from A |
|
Multiplication |
|
Multiply A times B |
|
Division |
|
Divide A by B |
|
Modulo |
|
Remainder of A divided by B |
|
Bitwise AND |
|
|
Bitwise AND of A and B |
An unfortunate quirk in the filter syntax is that the subtraction
operator must be preceded by a space character, so "A-B" must be
written as "A -B" or "A - B".
Arithmetic expressions can be grouped using curly braces.
For example, frames where capture length resulted in truncated TCP options:
frame.cap_len < { 14 + ip.hdr_len + tcp.hdr_len }
The display filter language has a number of functions to convert fields, see Table 6.10, “Display Filter Functions”.
Table 6.10. Display Filter Functions
| Function | Description |
|---|---|
|
Converts a string field to uppercase. |
|
Converts a string field to lowercase. |
|
Returns the byte length of a string or bytes field. |
|
Returns the number of field occurrences in a frame. |
|
Converts a non-string field to a string. |
|
Converts a field value to its value string, if it has one. |
|
Converts an unsigned integer field to a decimal string. |
|
Converts an unsigned integer field to a hexadecimal string. |
|
Converts a field to single precision floating point. |
|
Converts a field to double precision floating point. |
|
Return the maximum value for the arguments. |
|
Return the minimum value for the arguments. |
|
Return the absolute value for the argument. |
The upper() and lower() functions can used to force case-insensitive matches:
lower(http.server) contains "apache".
To find HTTP requests with long request URIs: len(http.request.uri) > 100.
Note that the len() function yields the string length in bytes rather than
(multi-byte) characters.
Usually an IP frame has only two addresses (source and destination), but in case
of ICMP errors or tunneling, a single packet might contain even more addresses.
These packets can be found with count(ip.addr) > 2.
The string() function converts a field value to a string, suitable for use with operators
like matches or contains. Integer fields are converted to their decimal representation.
It can be used with IP/Ethernet addresses (as well as others), but not with string or
byte fields.
For example, to match odd frame numbers:
string(frame.number) matches "[13579]$"
To match IP addresses ending in 255 in a block of subnets (172.16 to 172.31):
string(ip.dst) matches r"^172\.(1[6-9]|2[0-9]|3[0-1])\.[0-9]{1,3}\.255"
The vals() function converts an integer or boolean field value to a string
using the field’s associated value string, if it has one.
The double() function converts certain field types to doubles, including
floats, doubles (a no-op), integers, booleans, times (absolute times are
converted to seconds since the UN*X epoch), and the special IEEE 11073
Personal Health Devices floating point formats. The results can be used
with further arithmetic operations and, like other filters, placed in a
custom column.
The functions max() and min() take any number of arguments of the same type
and returns the largest/smallest respectively of the set.
max(tcp.srcport, tcp.dstport) <= 1024
An expression of the form ${proto.field} is called a field reference.
Its value is read from the corresponding field in the currently selected
frame in the GUI. This is a powerful way to build dynamic filters, such
as frames since the last five minutes to the selected frame:
frame.time_relative >= ${frame.time_relative} - 300
or all HTTP packets whose +ip.dst value equals the "A" record of
the DNS response in the current frame:
http && ip.dst eq ${dns.a}
The notation of field references is similar to that of macros but they are syntactically distinct. Field references, like other complex filters, make excellent use cases for macros, saved filters, and filter buttons
In addition to the implicit conversion of string literals for comparison with byte array fields (including protocols) mentioned above, integer and boolean fields with value strings can be compared with one of the strings that corresponds with a value.
If there is a unique reverse mapping from the string literal into a numeric value, the string is converted into that number and the comparison function is applied using arithmetic rules. If the mapping is not unique, then equality and inequality can be tested, but not the ordered comparisons.
This is in contrast with the string() and vals() functions, which
convert the field value to a string and applies string (lexicographic)
comparisons, as well as work with all operators that take strings.
Therefore the following two filters give the same result:
gtpv2.message_type <= 35 gtpv2.message_type <= "Modify Bearer Response"
whereas
vals(gtpv2.message_type) <= "Modify Bearer Response"
matches all messages whose value string precedes "Modify Bearer Response" in lexicographical order, and
string(gtpv2.message_type) <= "35"
matches all messages such that the message type comes before "35" in lexicographical order, i.e. would also match "170" (the message type for "Release Access Bearers Request.")
For the contains and matches operators, which operate on strings
(or byte arrays in the case of contains), fields on the left hand
side are implicitly converted to their value strings for comparison.
(To compare a field with a byte array, use the raw/at (@) operator.)
As protocols evolve they sometimes change names or are superseded by newer standards. For example, DHCP extends and has largely replaced BOOTP and TLS has replaced SSL. If a protocol dissector originally used the older names and fields for a protocol the Wireshark development team might update it to use the newer names and fields. In such cases they will add an alias from the old protocol name to the new one in order to make the transition easier.
For example, the DHCP dissector was originally developed for the BOOTP
protocol but as of Wireshark 3.0 all of the bootp display filter
fields have been renamed to their dhcp equivalents. You can still use
the old filter names for the time being, e.g., bootp.type is equivalent
to dhcp.type but Wireshark will show the warning “"bootp" is deprecated”
when you use it. Support for the deprecated fields may be removed in the future.
In some particular cases relational expressions (equal, less than, etc.)
can be ambiguous. The filter name of a protocol or protocol field can contain
any letter and digit in any order, possibly separated by dots. That can be
indistinguishable from a literal value (usually numerical values in hexadecimal).
For example the semantic value of fc can be the protocol Fibre Channel or the
number 0xFC in hexadecimal because the 0x prefix is optional for hexadecimal numbers.
Any value that matches a registered protocol or protocol field filter name is interpreted semantically as such. If it doesn’t match a protocol name the normal rules for parsing literal values apply.
So in the case of fc the lexical token is interpreted as "Fibre Channel" and
not 0xFC. In the case of fd it would be interpreted as 0xFD because it is a
well-formed hexadecimal literal value (according to the rules of display filter
language syntax) and there is no protocol registered with the filter name fd.
How ambiguous values are interpreted may change in the future. To avoid this problem and resolve the ambiguity there is additional syntax available. Values prefixed with a dot are always treated as a protocol name. The dot stands for the root of the protocol namespace and is optional). Values prefixed with a colon are always interpreted as a byte array.
frame[10:] contains .fc or frame[10] == :fc
If you are writing a script, or you think your expression may not be giving the expected results because of the syntactical ambiguity of some filter expression it is advisable to use the explicit syntax to indicate the correct meaning for that expression.
When you are accustomed to Wireshark’s filtering system and know what labels you wish to use in your filters it can be very quick to simply type a filter string. However, if you are new to Wireshark or are working with a slightly unfamiliar protocol it can be very confusing to try to figure out what to type. The “Display Filter Expression” dialog box helps with this.
|
Tip |
|---|---|
|
The “Display Filter Expression” dialog box is an excellent way to learn how to write Wireshark display filter strings. |
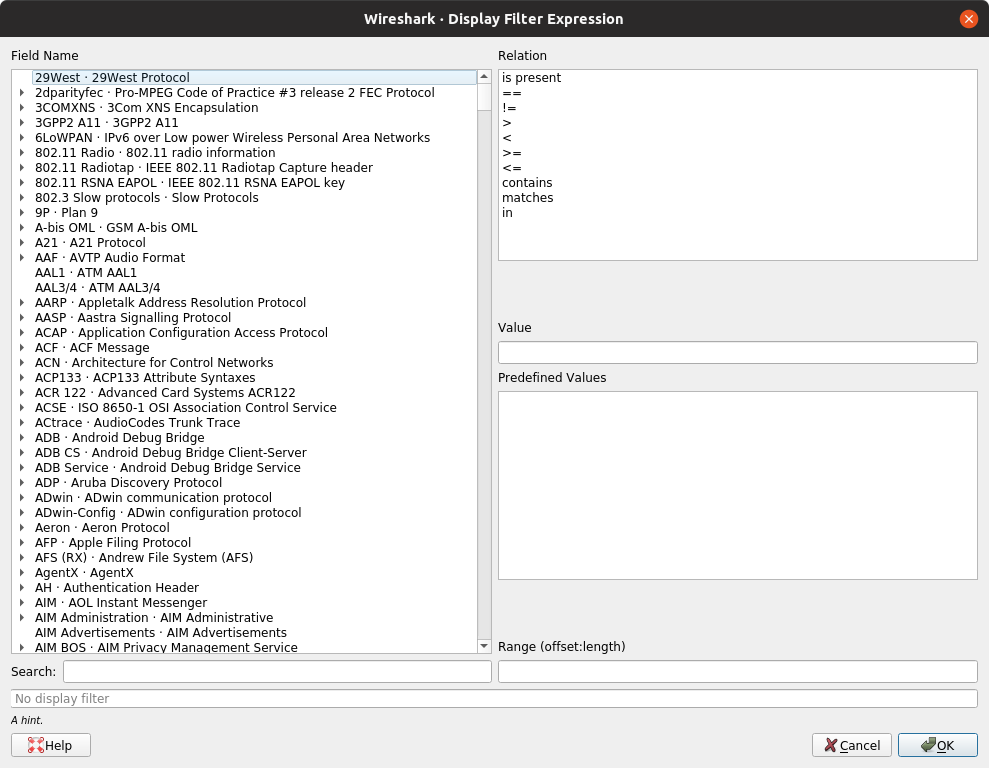
When you first bring up the Display Filter Expression dialog box you are shown a tree of field names, organized by protocol, and a box for selecting a relation.
- Field Name
- Select a protocol field from the protocol field tree. Every protocol with filterable fields is listed at the top level. You can search for a particular protocol entry by entering the first few letters of the protocol name. By expanding a protocol name you can get a list of the field names available for filtering for that protocol.
- Relation
-
Select a relation from the list of available relation. The is present is a unary relation which is true if the selected field is present in a packet. All other listed relations are binary relations which require additional data (e.g. a Value to match) to complete.
When you select a field from the field name list and select a binary relation (such as the equality relation,
==) you will be given the opportunity to enter a value, and possibly some range information. - Value
- You may enter an appropriate value in the Value text box. The Value will also indicate the type of value for the Field Name you have selected (like character string).
- Predefined Values
- Some of the protocol fields have predefined values available, much like enumerations in C. If the selected protocol field has such values defined, you can choose one of them here.
- Search
-
Lets you search for a full or partial field name or description.
Regular expressions are supported.
For example, searching for
tcp.*flagshows the TCP flags fields supported by a wide variety of dissectors, while^tcp.flagshows only the TCP flags fields supported by the TCP dissector. - Range
-
A range of integers or a group of ranges, such as
1-12or39-42,98-2000. - Opens this section of the User’s Guide.
- When you have built a satisfactory expression click and a filter string will be built for you.
- You can leave the “Add Expression…” dialog box without any effect by clicking the button.
You create pre-defined filters that appear in the capture and display filter bookmark menus (![]() ).
This can save time in remembering and retyping some of the more complex filters you use.
).
This can save time in remembering and retyping some of the more complex filters you use.
To create or edit capture filters, select from the capture filter bookmark menu or → from the main menu. Display filters can be created or edited by selecting from the display filter bookmark menu or → from the main menu. Wireshark will open the corresponding dialog as shown in Figure 6.10, “The “Capture Filters” and “Display Filters” dialog boxes”. The two dialogs look and work similar to one another. Both are described here, and the differences are noted as needed.
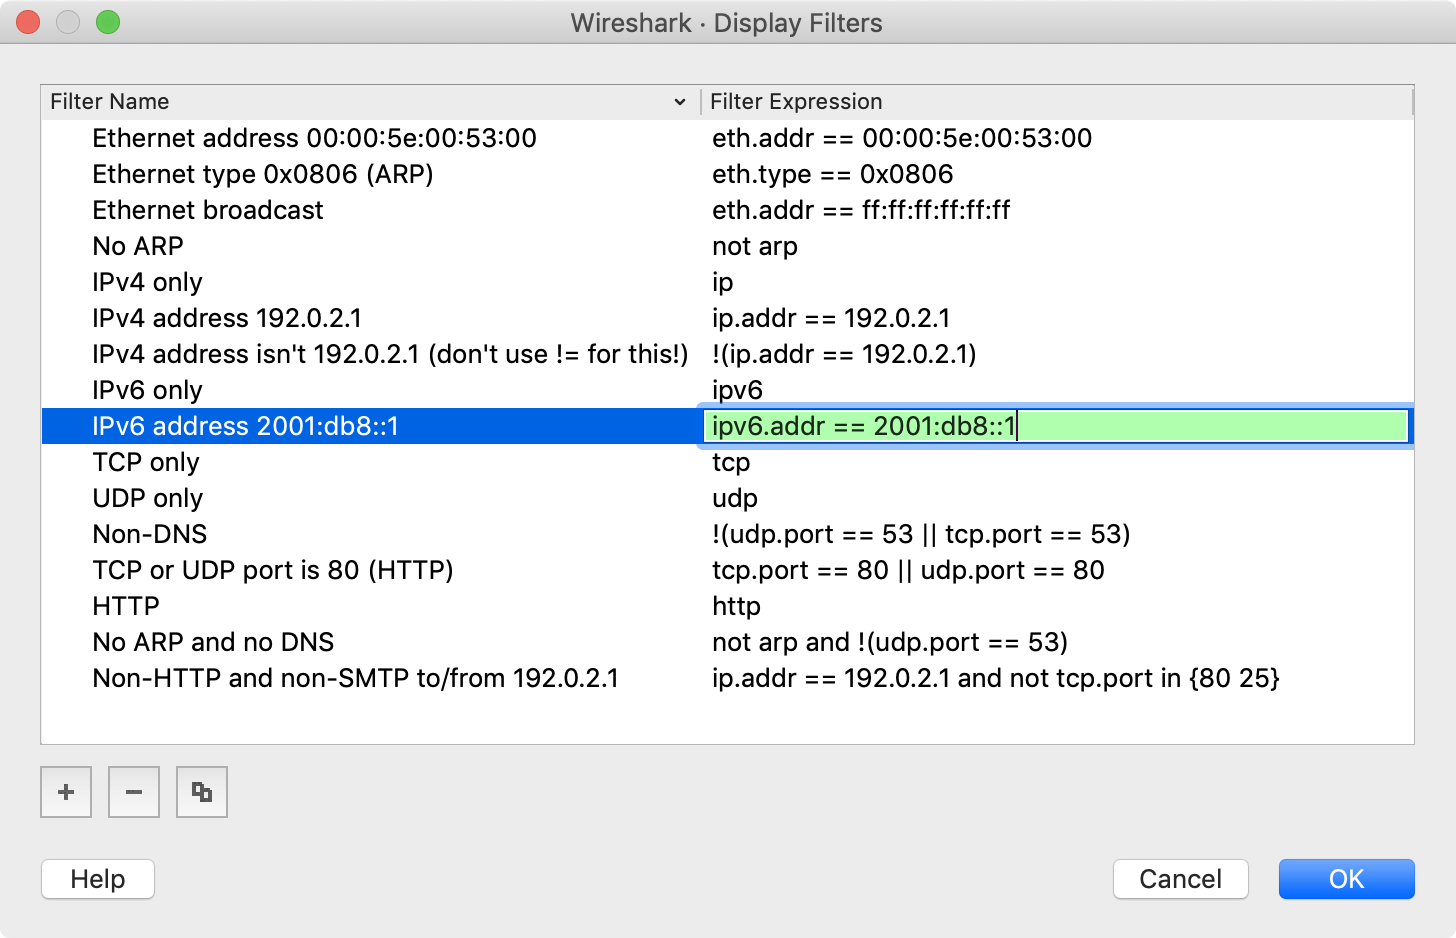
-
Adds a new filter to the list. You can edit the filter name or expression by double-clicking on it.
The filter name is used in this dialog to identify the filter for your convenience and is not used elsewhere. You can create multiple filters with the same name, but this is not very useful.
When typing in a filter string, the background color will change depending on the validity of the filter similar to the main capture and display filter toolbars.
- Delete the selected filter. This will be greyed out if no filter is selected.
- Copy the selected filter. This will be greyed out if no filter is selected.
- Saves the filter settings and closes the dialog.
- Closes the dialog without saving any changes.
Display Filter Macros are a mechanism to create shortcuts for complex filters. You can define a filter macro with Wireshark and label it for later use. This can save time in remembering and retyping some of the more complex filters you use.
To define and save your own filter macros, follow the steps below:
-
In the main menu select → . Wireshark will open a corresponding dialog Figure 6.11, “Display Filter Macros window”.
- To add a new filter macro, click the button in the bottom-left corner. A new row will appear in the Display Filter Macros table above.
-
Enter the name of your macro in the
Macro Namecolumn. Enter your filter macro in theMacro Expressioncolumn. - To save your modifications, click the button in the bottom-right corner of the Figure 6.11, “Display Filter Macros window”.
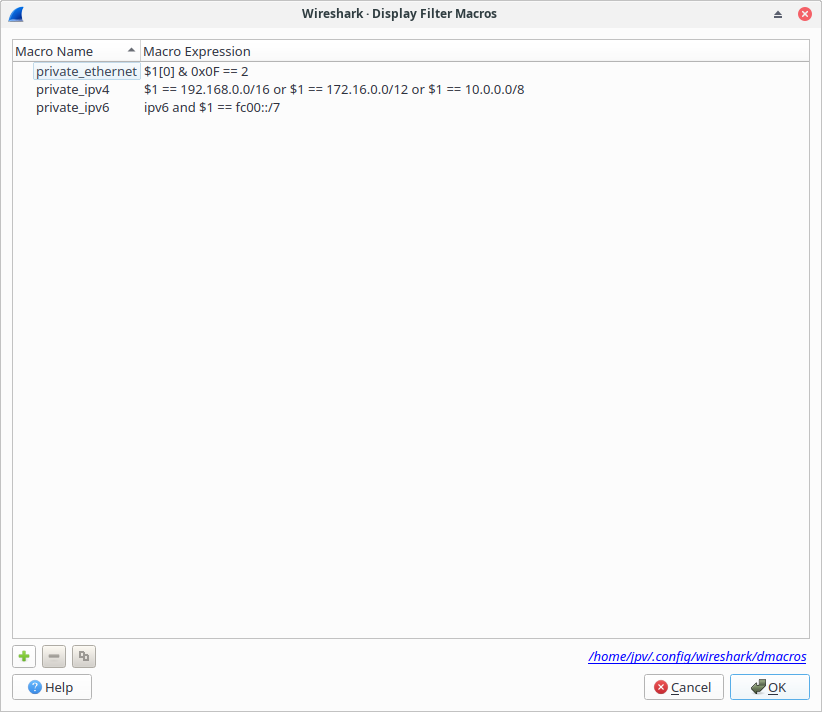
Display filter macros are invoked with the macro name and a number of input arguments. There are several supported syntaxes.
The Macro Name must consist of ASCII alphanumerics or the '_' character.
(Note that the presence of a '.' character would indicate a
field reference.)
The Macro Expression is replacement text for the macro name. It substitutes
$1, $2, $3, … with the input arguments.
For example, defining a display filter macro named tcp_conv whose text is
(ip.src == $1 and ip.dst == $2 and tcp.srcport == $3 and tcp.dstport == $4) or (ip.src == $2 and ip.dst == $1 and tcp.srcport == $4 and tcp.dstport == $3)
would allow to use a display filter like
$tcp_conv(10.1.1.2,10.1.1.3,1200,1400)
or alternatively
${tcp_conv:10.1.1.2;10.1.1.3;1200;1400}
or
${tcp_conv;10.1.1.2;10.1.1.3;1200;1400}
instead of typing the whole filter. Both notations are equivalent. Once defined, a macro can be used in saved display (but not capture) filters and filter buttons.
You can easily find packets once you have captured some packets or have read in a previously saved capture file. Simply select → in the main menu. Wireshark will open a toolbar between the main toolbar and the packet list shown in Figure 6.12, “The “Find Packet” toolbar”. The same toolbar can also search within the currently selected packet: see Section 6.8.2, “Finding Text in the Selected Packet”.
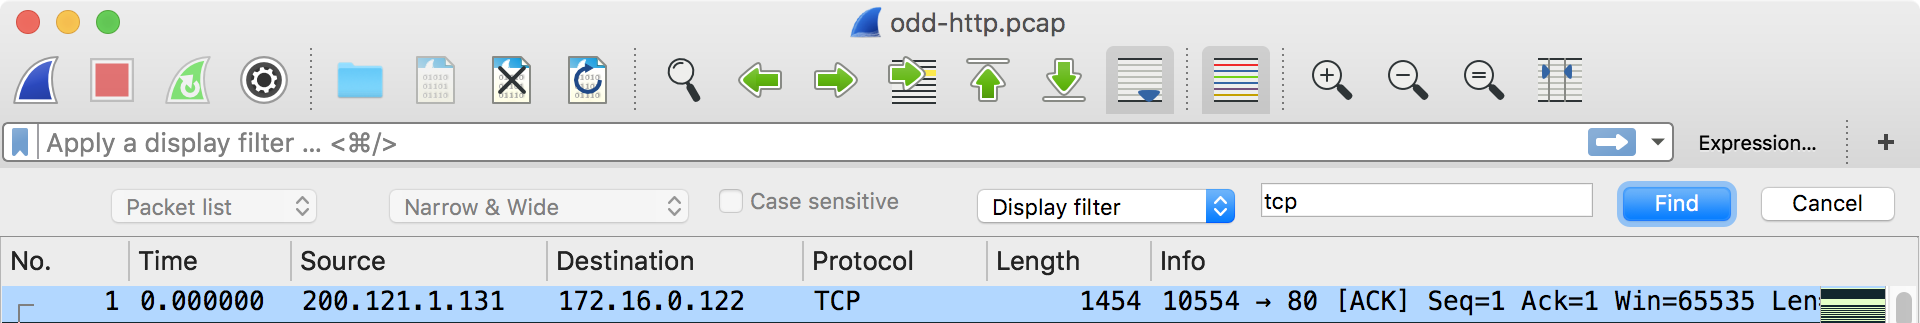
You can search using the following criteria:
- Display filter
-
Enter a display filter string into the text entry field and click the button. + For example, to find the three-way handshake for a connection from host 192.168.0.1, use the following filter string:
ip.src==192.168.0.1 and tcp.flags.syn==1
The value to be found will be syntax checked while you type it in. If the syntax check of your value succeeds, the background of the entry field will turn green, if it fails, it will turn red. For more details see Section 6.3, “Filtering Packets While Viewing”
- Hexadecimal Value
-
Search for a specific byte sequence in the packet data.
For example, use “ef:bb:bf” to find the next packet that contains the UTF-8 byte order mark.
- String
- Find a string in the packet data, with various options.
- Regular Expression
- Search the packet data using Perl-compatible regular expressions. PCRE patterns are beyond the scope of this document, but typing “pcre test” into your favorite search engine should return a number of sites that will help you test and explore your expressions.
When exactly one packet is selected in the packet list, the "Find Packet" toolbar can search within that packet’s protocol tree instead of searching the whole capture file.
Check on the options row at the bottom of the toolbar. Wireshark limits the search type to and and searches only the packet details of the currently selected packet. The , , and options are not used in this mode.
Enter a search string or regular expression in the search field, then click or press Enter to move to the next match. Press Shift+Enter to move to the previous match. You can also use → (Ctrl+N) and → (Ctrl+B). Matching fields are highlighted in the protocol tree.
While a search is active, the status bar can show a match counter such
as [3 of 57] before the description of the selected field. If no
matches are found, Wireshark shows a message in the status bar.
is available only when a single packet is selected. If the selection is cleared or includes more than one packet, the checkbox is disabled and any in-packet highlighting is removed. Click on the toolbar or press Esc to close the Find Packet toolbar and clear the highlighting.
When you view a packet in a separate window (see Figure 6.2, “Viewing a packet in a separate window”), you can search within that window’s protocol tree without using the main Find Packet toolbar.
Check in the row of options below the protocol tree, or select → (Ctrl+Alt+F). Wireshark opens a find bar above the protocol tree. The find bar provides and search, a option, a match counter, and and buttons.
Enter a search string or regular expression, then click or press Enter to move to the next match. Press Shift+Enter to move to the previous match. Matching fields are highlighted in the protocol tree. Uncheck or click to close the find bar and clear the highlighting.
You can easily jump to specific packets with one of the menu items in the menu.
Go back in the packet history, works much like the page history in most web browsers.
Go forward in the packet history, works much like the page history in most web browsers.
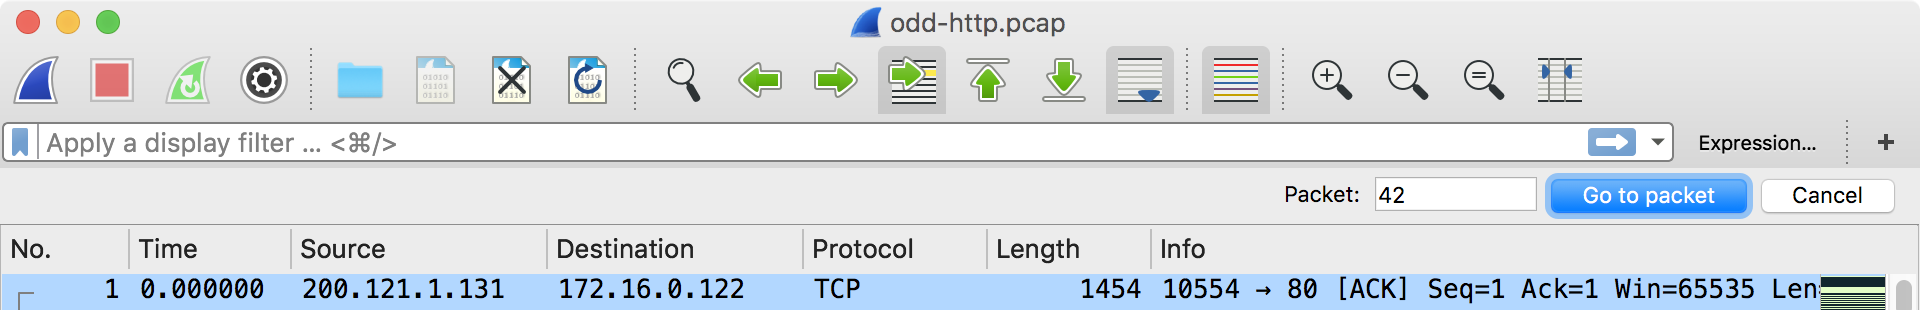
This toolbar can be opened by selecting → from the main menu. It appears between the main toolbar and the packet list, similar to the ”Find Packet” toolbar.
When you enter a packet number and press Wireshark will jump to that packet.
If a protocol field is selected which points to another packet in the capture file, this command will jump to that packet.
As these protocol fields now work like links (just as in your Web browser), it’s easier to simply double-click on the field to jump to the corresponding field.
You can mark packets in the “Packet List” pane. A marked packet will be shown with black background, regardless of the coloring rules set. Marking a packet can be useful to find it later while analyzing in a large capture file.
Marked packet information is not stored in the capture file or anywhere else. It will be lost when the capture file is closed.
You can use packet marking to control the output of packets when saving, exporting, or printing. To do so, an option in the packet range is available, see Section 5.9, “The “Packet Range” Frame”.
There are several ways to mark and unmark packets. From the menu you can select from the following:
- toggles the marked state of the current selection. This option is also available in the packet list context menu.
- set the mark state of all displayed packets.
- reset the mark state of all packets.
You can also mark and unmark a packet by clicking on it in the packet list with the middle mouse button.
You can ignore packets in the “Packet List” pane. Wireshark will then pretend that they not exist in the capture file. An ignored packet will be shown with white background and grey foreground, regardless of the coloring rules set.
Ignored packet information is not stored in the capture file or anywhere else. It will be lost when the capture file is closed.
There are several ways to ignore and unignore packets. From the menu you can select from the following:
- toggles the ignored state of the current selection. This option is also available in the packet list context menu.
- set the ignored state of all displayed packets.
- reset the ignored state of all packets.
While packets are captured, each packet is timestamped. These timestamps will be saved to the capture file, so they will be available for later analysis.
A detailed description of timestamps, timezones and alike can be found at: Section 7.6, “Time Stamps”.
The timestamp presentation format and the precision in the packet list can be chosen using the View menu, see Figure 3.5, “The “View” Menu”.
The available presentation formats are:
- The absolute date and time of the day when the packet was captured.
- The absolute time of the day when the packet was captured.
- The time relative to the start of the capture file or the first “Time Reference” before this packet (see Section 6.12.1, “Packet Time Referencing”).
- The time relative to the previous captured packet.
- The time relative to the previous displayed packet.
- The time relative to epoch (midnight UTC of January 1, 1970).
The available precisions (aka. the number of displayed decimal places) are:
- The timestamp precision of the loaded capture file format will be used (the default).
- , , , , or The timestamp precision will be forced to the given setting. If the actually available precision is smaller, zeros will be appended. If the precision is larger, the remaining decimal places will be cut off.
Precision example: If you have a timestamp and it’s displayed using, “Seconds Since Previous Packet” the value might be 1.123456. This will be displayed using the “Automatic” setting for libpcap files (which is microseconds). If you use Seconds it would show simply 1 and if you use Nanoseconds it shows 1.123456000.
The user can set time references to packets. A time reference is the starting point for all subsequent packet time calculations. It will be useful, if you want to see the time values relative to a special packet, e.g., the start of a new request. It’s possible to set multiple time references in the capture file.
The time references will not be saved permanently and will be lost when you close the capture file.
Time referencing supersedes the value for the time relative to first
capture packet. It affects the default Time column if the time display
format is set to “Seconds Since First Captured Packet”, or a “Relative Time”
column if one has been added. It also affects the frame.time_relative field.
To work with time references, choose one of the items in the menu:[Edit] menu or from the pop-up menu of the “Packet List” pane. See Section 3.6, “The “Edit” Menu”.
- Toggles the time reference state of the currently selected packet to on or off.
- Find the next time referenced packet in the “Packet List” pane.
- Find the previous time referenced packet in the “Packet List” pane.
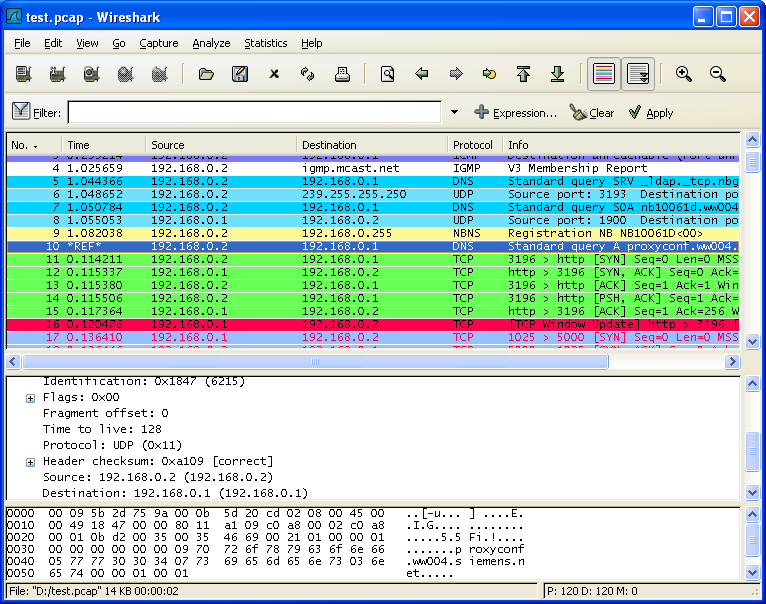
A time referenced packet will be marked with the string *REF* in the Time column (see packet number 10). All subsequent packets will show the time since the last time reference. If there is a column displayed for “Cumulative Bytes” its counter will also reset at every time reference packet. # Somewhat odd that cumulative bytes also resets.
Time referenced packets will always be displayed in the packet list pane. Display filters will not affect or hide these packets.
Sometimes you will want to adjust the timestamps in a capture file. This may be because a machine performing the capture had an inaccurate clock, or because the capture was originally saved with timestamps in local time (perhaps even to a capture file format that only writes times in local time, or only writes the time of day but not the date). One common use is to synchronize timestamps between captures made on different machines with relative clock skew or clock drift before merging them. Selecting → from the main menu opens the "Time Shift" dialog.
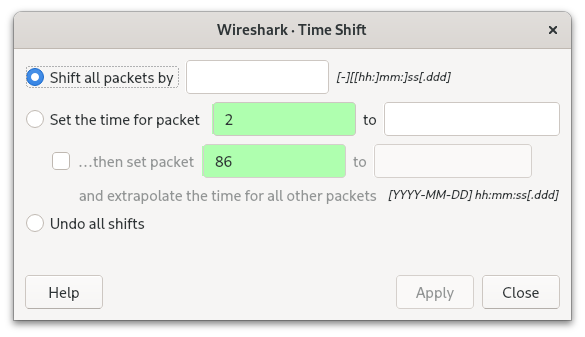
- Shift all packets by…
- Apply a fixed offset, entered as a relative time in hours, minutes, and seconds, to the timestamps for all packets. This is useful for correcting small known errors or timezones.
- Set the time for packet…
- Apply offsets based on one or, if the box is checked, two given packets to the timestamps for all packets. Enter the packet number and absolute date and time for the packet(s). When one packet is used, a fixed offset is applied that can be used to correct for clock skew. When two packets are used, the correction for all other packets is computed linearly, which can be used to correct for clock drift. This is useful when the precise date and time for particular packets are known, e.g. packets containing the NTP or PTP protocols.
- Undo all shifts
- This removes all unsaved time shifts from packets.
|
Time shifts are applied to all packets |
|---|---|
|
Time shifts are applied to all packets in the capture, including ignored packets and packets that are not displayed due to the current filter. Wireshark does not have a method to adjust the timestamps of individual or selected packets. |
The offset currently applied to time shifted packets is in the
frame.offset_shift field, which can be viewed in the packet details.
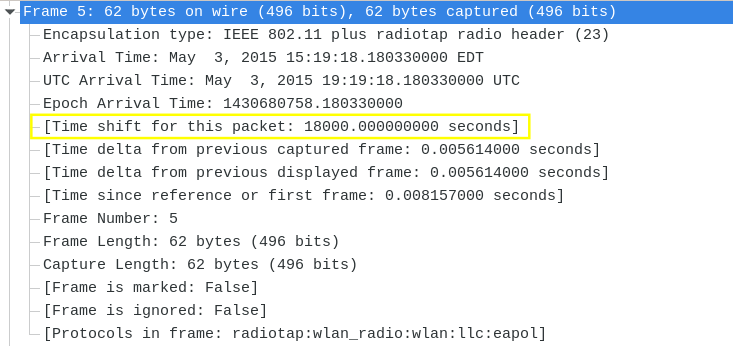
After time shifts are applied, the file will have unsaved changes, which are indicated with an * beside its name in the title bar. Beginning with Wireshark 4.2.0, saving the file will write the corrected timestamps to the capture file. If you attempt to close the capture file without saving it, a dialog will prompt you to save in order to prevent losing your changes (unless that warning has been disabled in the preferences.)
Table of Contents
It can be very helpful to see a protocol in the way that the application layer sees it. Perhaps you are looking for passwords in a Telnet stream, or you are trying to make sense of a data stream. Maybe you just need a display filter to show only the packets in a TLS or SSL stream. If so, Wireshark’s ability to follow protocol streams will be useful to you.
To filter to a particular stream, select a packet in the packet list of the stream/connection you are interested in and then select the menu item you want under → (or in the context menu in the packet list). Wireshark will set an appropriate display filter and display a dialog box with the data from the stream laid out, as shown in Figure 7.1, “The “Follow TCP Stream” dialog box”.
|
Tip |
|---|---|
|
Following a protocol stream applies a display filter which selects all the packets in the current stream. Some people open the “Follow TCP Stream” dialog and immediately close it as a quick way to isolate a particular stream. Closing the dialog with the “Back” button will reset the display filter if this behavior is not desired. |
Wireshark supports following the streams of many different protocols, including TCP, UDP, DCCP, TLS, HTTP, HTTP/2, QUIC, WebSocket, SIP, and USB CDC. The dialog for following TCP streams is covered in detail here; most other supported protocols will show dialogs which are very similar.
|
Note |
|---|---|
|
If the type of stream you wish to follow is disabled or missing from the menu, Wireshark did not find the respective protocol in the currently selected packet. |
|
Tip |
|---|---|
|
To follow TLS or SSL streams, see the wiki page on TLS for instructions on providing TLS keys. |
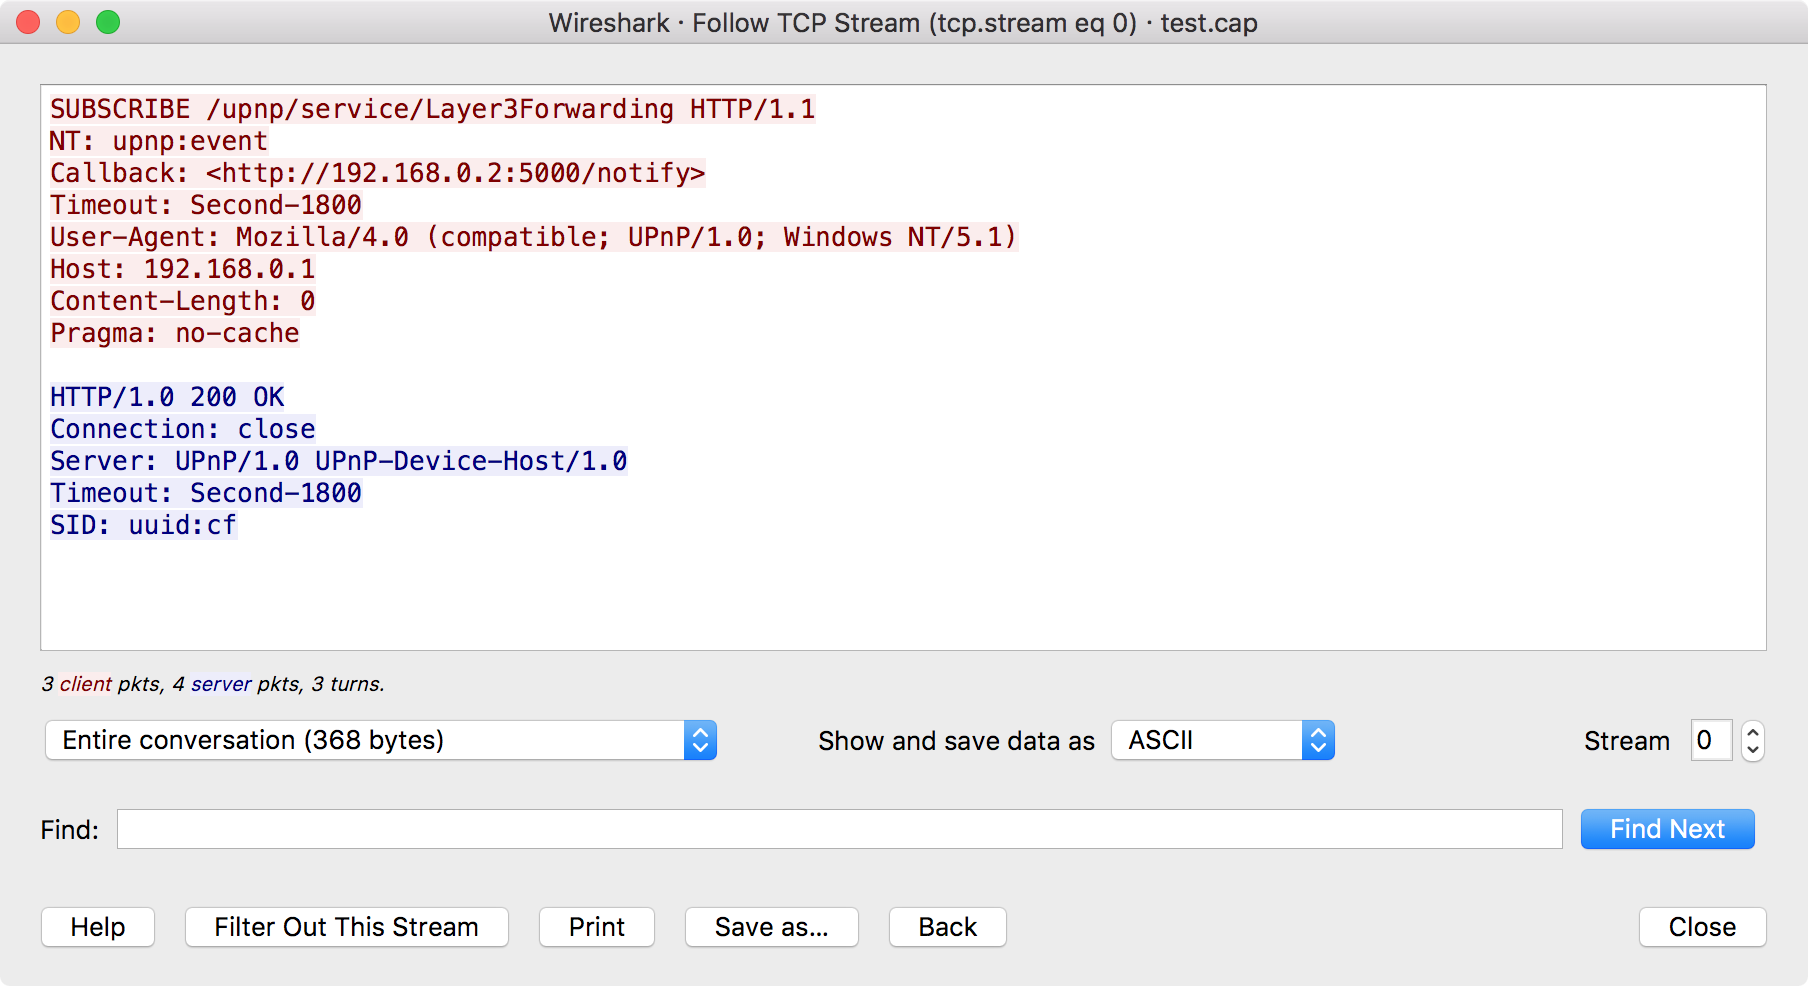
The stream content is displayed in the same sequence as it appeared on the network. Non-printable characters are replaced by dots. Traffic from the client to the server is colored red, while traffic from the server to the client is colored blue. These colors are defined by the active theme, which you can select by opening → and choosing a theme under → .
The stream content won’t be updated while doing a live capture. To get the latest content you’ll have to reopen the dialog.
You can choose from the following actions:
- Show this help.
- Apply a display filter removing the current stream data from the display.
- Print the stream data in the currently selected format.
- Save the stream data in the currently selected format.
- Close this dialog box and restore the previous display filter.
- Close this dialog box, leaving the current display filter in effect.
By default, Wireshark displays both client and server data. You can select the to switch between both, client to server, or server to client data.
You can choose to view the data in one of the following formats:
- In this view you see the data from each direction in ASCII. Obviously best for ASCII based protocols, e.g., HTTP.
- This allows you to import the stream data into your own C program.
- For the big-iron freaks out there.
- This allows you to see all the data. This will require a lot of screen space and is best used with binary protocols.
- Like ASCII, but decode the data as UTF-8.
- Like ASCII, but decode the data as UTF-16.
- This allows you to load the stream as YAML.
The YAML output is divided into 2 main sections:
-
The
peerssection where for eachpeeryou found the peer index, thehostaddress and theportnumber. -
The
packetssection where for eachpacketyou found the packet number in the original capture, thepeerindex, the packetindexfor this peer, thetimestampin seconds and thedatain base64 encoding.
Example 7.1. Follow Stream YAML output
peers:
- peer: 0
host: 127.0.0.1
port: 54048
- peer: 1
host: 127.0.10.1
port: 5000
packets:
- packet: 1
peer: 0
index: 0
timestamp: 1599485409.693955274
data: !!binary |
aGVsbG8K
- packet: 3
peer: 1
index: 0
timestamp: 1599485423.885866692
data: !!binary |
Ym9uam91cgo=
The same example but in old YAML format (before version 3.5):
# Packet 1 peer0_0: !!binary | aGVsbG8K # Packet 3 peer1_0: !!binary | Ym9uam91cgo=
How the old format data can be found in the new format:
| New YAML format | Old YAML format | |
|---|---|---|
...
packets:
- packet: AAA
peer: BBB
index: CCC
data: !!binary |
DDD |
# Packet AAA peerBBB_CCC !!binary | DDD |
AAA: packet number in the original capture BBB: peer index CCC: packet index for this peer DDD: data in base64 encoding |
- This allows you to load the unaltered stream data into a different program for further examination. The display will show the data as strings of hex characters with each frame on a separate line, but “Save As” will result in a binary file without any added line separators.
You can optionally show the delta time each time the direction changes (turns) or for every packet or event.
You can switch between streams using the “Stream” selector.
You can search for text by entering it in the “Find” entry box and pressing .
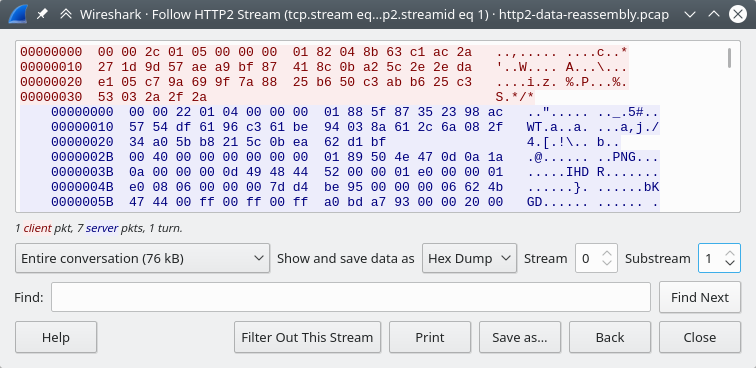
The HTTP/2 Stream dialog is similar to the "Follow TCP Stream" dialog, except
for an additional "Substream" dialog field. HTTP/2 Streams are identified by
a HTTP/2 Stream Index (field name http2.streamid) which are unique within a
TCP connection. The “Stream” selector determines the TCP connection whereas the
“Substream” selector is used to pick the HTTP/2 Stream ID.
The QUIC protocol is similar, the first number selects the QUIC connection number while the "Substream" field selects the QUIC Stream ID.
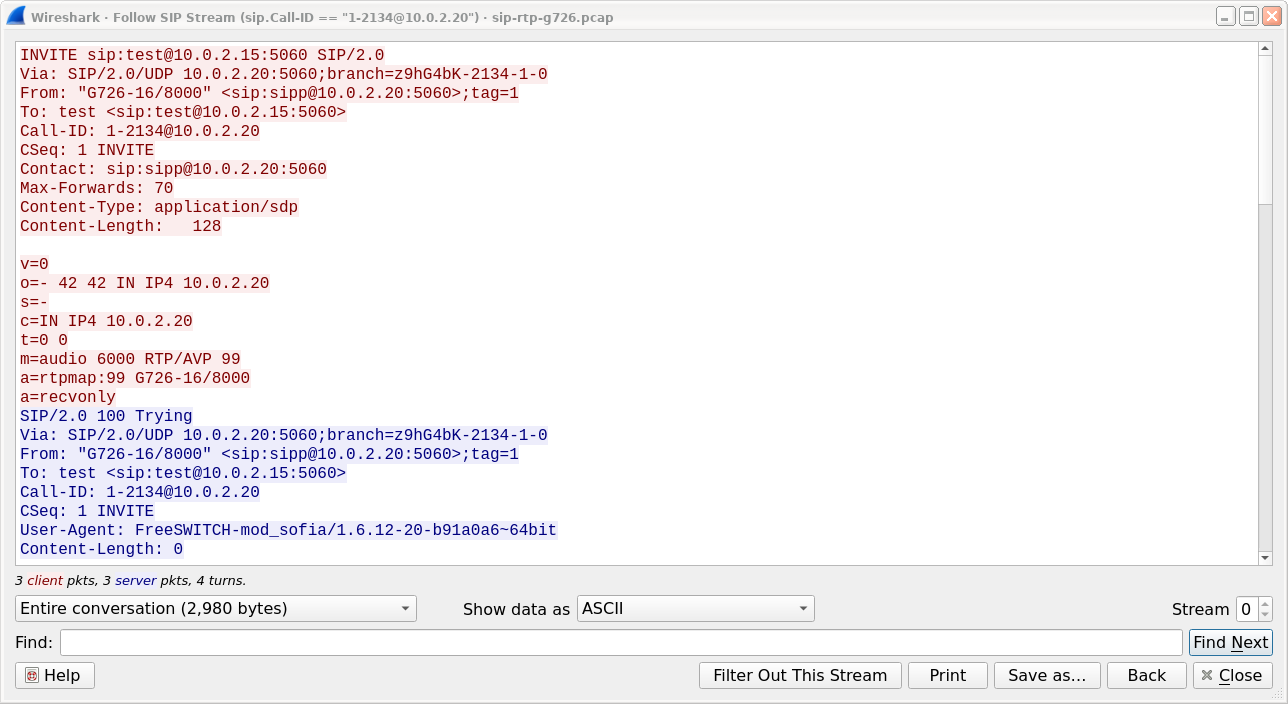
The SIP call is shown with same dialog, just filter is based on sip.Call-ID field. Count of streams is fixed to 0 and the field is disabled.
If a selected packet field does not show all the bytes (i.e., they are truncated when displayed) or if they are shown as bytes rather than string or if they require more formatting because they contain an image or HTML then this dialog can be used.
This dialog can also be used to decode field bytes from base64, various compressed formats or quoted-printable and show the decoded bytes as configurable output. It’s also possible to select a subset of bytes setting the start byte and end byte.
You can choose from the following actions:
- Show this help.
- Print the bytes in the currently selected format.
- Copy the bytes to the clipboard in the currently selected format.
- Save the bytes in the currently selected format.
- Close this dialog box.
You can choose to decode the data from one of the following formats:
- This is the default which does not decode anything.
- This will decode from Base64 or Base64Url.
- This will decompress the buffer using lz77, lz77huff, lznt1, snappy, zlib or zstd.
- This will decode from a string of hex digits. Non-hex characters are skipped.
- This will decode from a Percent-Encoded string.
- This will decode from a Quoted-Printable string.
- This will decode ROT-13 encoded text.
You can choose to view the data in one of the following formats:
- In this view you see the bytes as ASCII. All control characters and non-ASCII bytes are replaced by dot.
- In this view all control characters are shown using a UTF-8 symbol and all non-ASCII bytes are replaced by dot.
- This allows you to import the field data into your own C program.
- For the big-iron freaks out there.
- This allows you to see all the data. This will require a lot of screen space and is best used with binary protocols.
- This allows you to see all the data formatted as a HTML document. The HTML supported is what’s supported by the Qt QTextEdit class.
- This will try to convert the bytes into an image. Most popular formats are supported including PNG, JPEG, GIF, and BMP.
- In this view you see the bytes as ISO 8859-1.
- This allows you to load the bytes into a different program for further examination. The display will show HEX data, but “Save As” will result in a binary file.
- In this view you see the bytes as UTF-8.
- In this view you see the bytes as UTF-16.
- This will show the bytes as a YAML binary dump.
You can search for text by entering it in the “Find” entry box and pressing .
Wireshark keeps track of any anomalies and other items of interest it finds in a capture file and shows them in the Expert Information dialog. The goal is to give you a better idea of uncommon or notable network behavior and to let novice and expert users find network problems faster than manually scanning through the packet list.
|
Expert information is only a hint |
|---|---|
|
Expert information is the starting point for investigation, not the stopping point. Every network is different, and it’s up to you to verify that Wireshark’s expert information applies to your particular situation. The presence of expert information doesn’t necessarily indicate a problem and absence of expert information doesn’t necessarily mean everything is OK. |
The amount of expert information largely depends on the protocol being used. While dissectors for some common protocols like TCP and IP will show detailed information, other dissectors will show little or none.
The following describes the components of a single expert information entry along with the expert user interface.
Expert information entries are grouped by severity level (described below) and contain the following:
Table 7.1. Example expert information items
| Packet # | Summary | Group | Protocol |
|---|---|---|---|
592 |
TCP: [TCP Out-Of-Order] … |
Malformed |
TCP |
1202 |
DNS: Standard query response … |
Protocol |
DNS |
443 |
TCP: 80 → 59322 [RST] Seq=12761 Win=0 Len=0 |
Sequence |
TCP |
Every expert information item has a severity level. The following levels are used, from lowest to highest. Wireshark marks them using different colors, which are shown in parentheses:
- Chat (blue)
- Information about usual workflow, e.g., a TCP packet with the SYN flag set.
- Note (cyan)
- Notable events, e.g., an application returned a common error code such as HTTP 404.
- Warn (yellow)
- Warnings, e.g., application returned an unusual error code like a connection problem.
- Error (red)
- Serious problems, such as malformed packets.
Along with severity levels, expert information items are categorized by group. The following groups are currently implemented:
- Assumption
- The protocol field has incomplete data and was dissected based on assumed value.
- Checksum
- A checksum was invalid.
- Comment
- Packet comment.
- Debug
- Debugging information. You shouldn’t see this group in release versions of Wireshark.
- Decryption
- A decryption issue.
- Deprecated
- The protocol field has been deprecated.
- Malformed
- Malformed packet or dissector has a bug. Dissection of this packet aborted.
- Protocol
- Violation of a protocol’s specification (e.g., invalid field values or illegal lengths). Dissection of this packet probably continued.
- Reassemble
- Problems while reassembling, e.g., not all fragments were available or an exception happened during reassembly.
- Request Code
- An application request (e.g., File Handle == x). Usually assigned the Chat severity level.
- Response Code
- An application response code indicates a potential problem, e.g., HTTP 404 page not found.
- Security
- A security problem, e.g., an insecure implementation.
- Sequence
- A protocol sequence number was suspicious, e.g., it wasn’t continuous or a retransmission was detected.
- Undecoded
- Dissection incomplete or data can’t be decoded for other reasons.
It’s possible that more groups will be added in the future.
You can open the expert info dialog by selecting → or by clicking the expert level indicator in the main status bar.
Right-clicking on an item will allow you to apply or prepare a filter based on the item, copy its summary text, and other tasks.
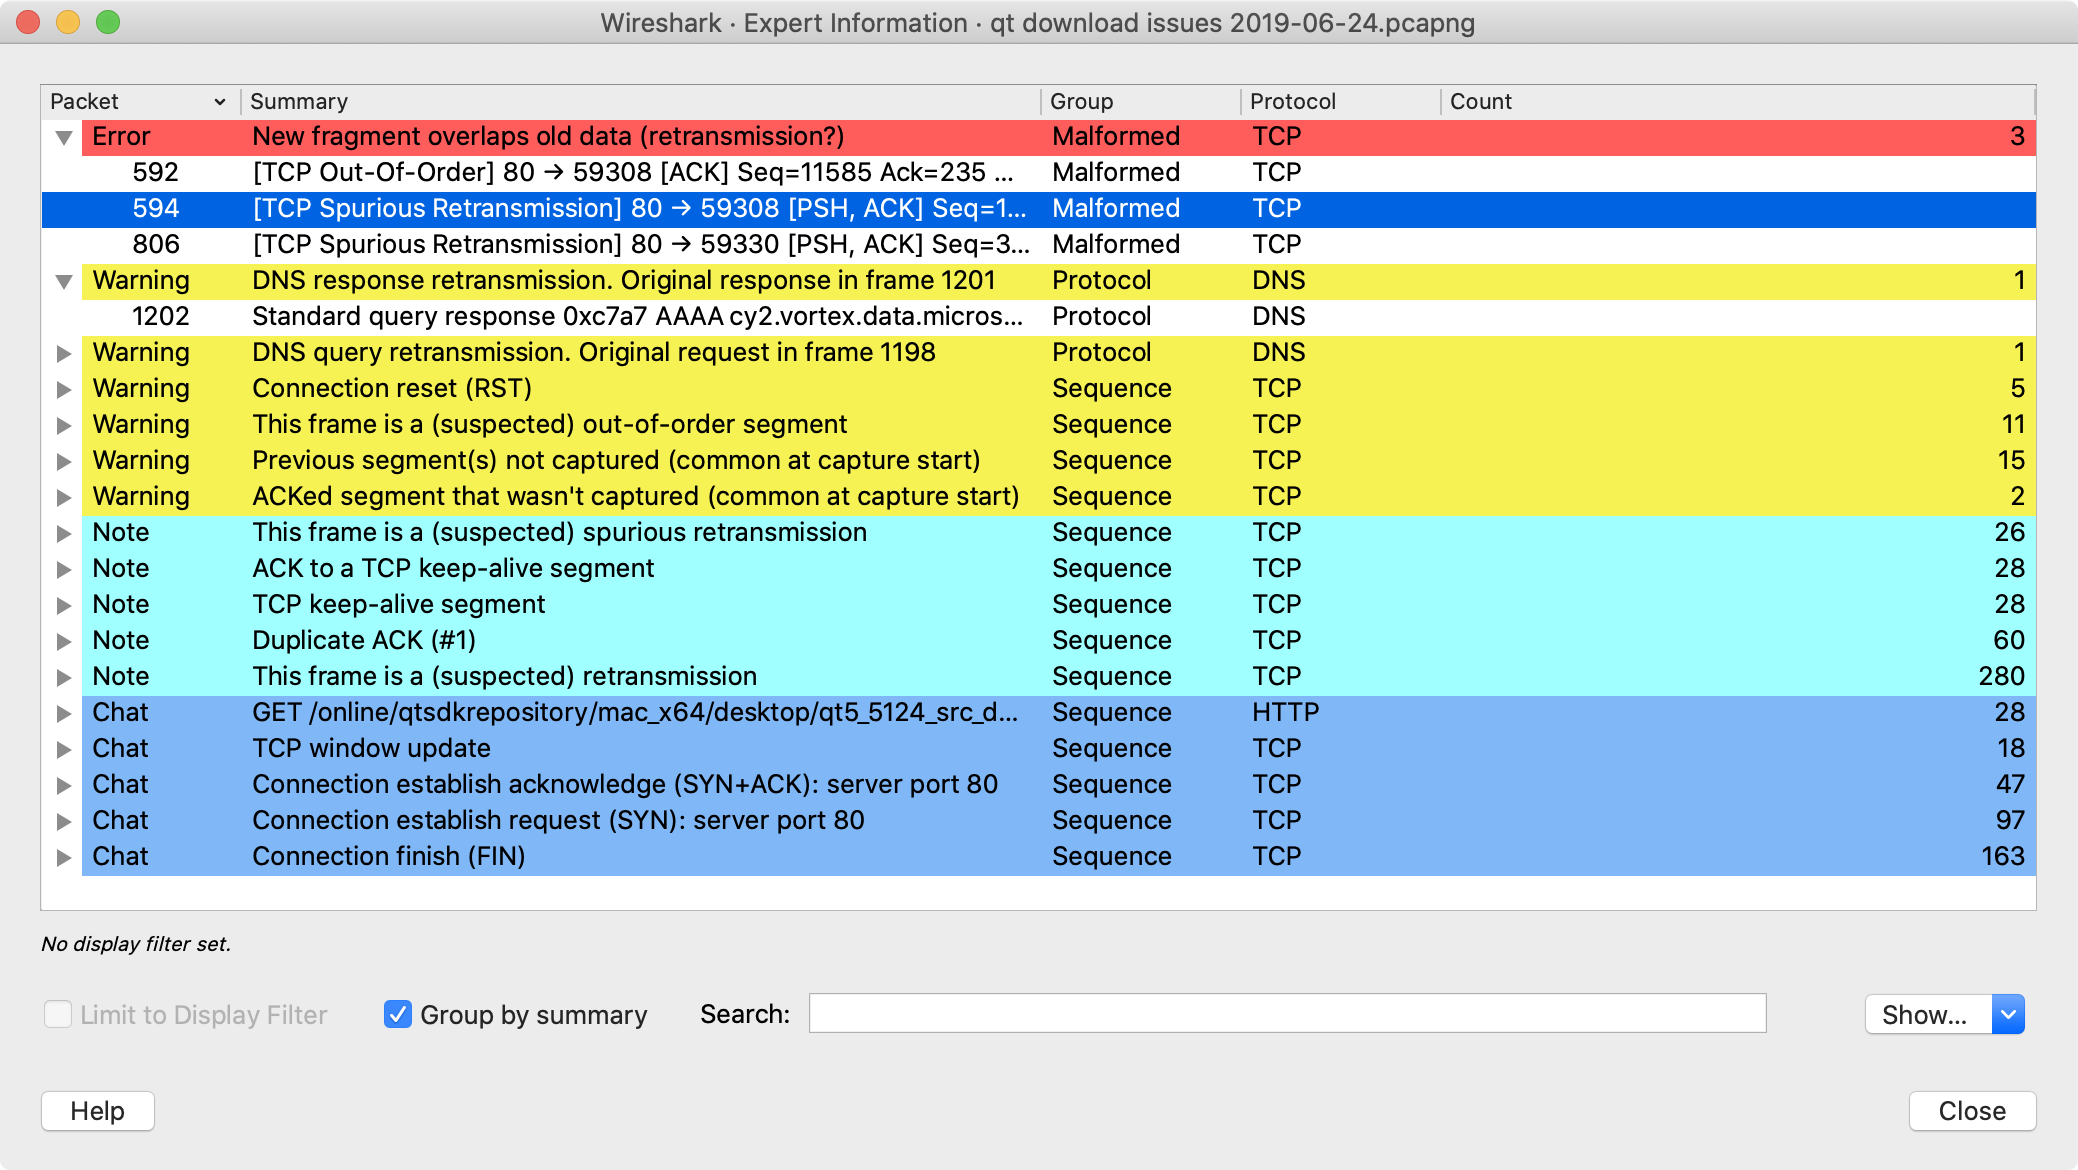
You can choose from the following actions:
- Limit to display filter
- Only show expert information items present in packets that match the current display filter.
- Group by summary
- Group items by their summary instead of the groups described above.
- Search
- Only show items that match the search string, such as “dns”. Regular expressions are supported.
- Lets you show or hide each severity level. For example, you can deselect Chat and Note severities if desired.
- Takes you to this section of the User’s Guide.
- Closes the dialog
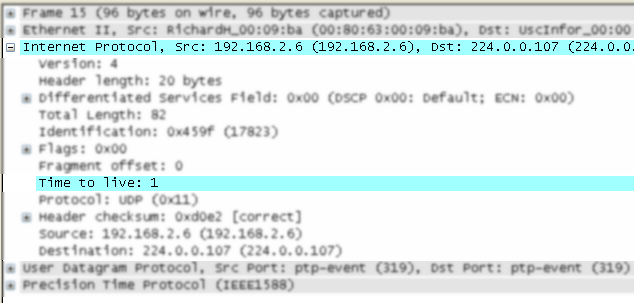
The packet detail tree marks fields with expert information based on their severity level color, e.g., “Warning” severities have a yellow background. This color is propagated to the top-level protocol item in the tree in order to make it easy to find the field that created the expert information.
For the example screenshot above, the IP “Time to live” value is very low (only 1), so the corresponding protocol field is marked with a cyan background. To make it easier find that item in the packet tree, the IP protocol toplevel item is marked cyan as well.
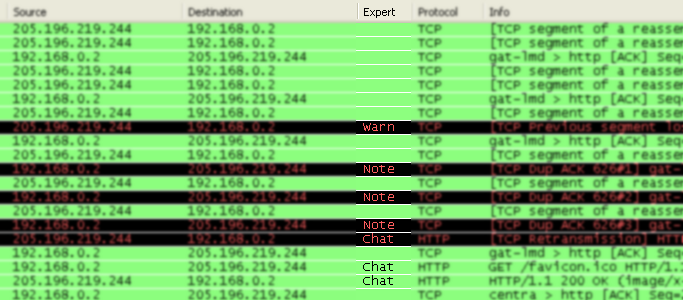
An optional “Expert Info Severity” packet list column is available that displays the most significant severity of a packet or stays empty if everything seems OK. This column is not displayed by default but can be easily added using the Preferences Columns page described in Section 11.5, “Preferences”.
By default, Wireshark’s TCP dissector tracks the state of each TCP session and provides additional information when problems or potential problems are detected. Analysis is done once for each TCP packet when a capture file is first opened. Packets are processed in the order in which they appear in the packet list. You can enable or disable this feature via the “Analyze TCP sequence numbers” TCP dissector preference.
For analysis of data or protocols layered on top of TCP (such as HTTP), see Section 7.8.3, “TCP Reassembly”.
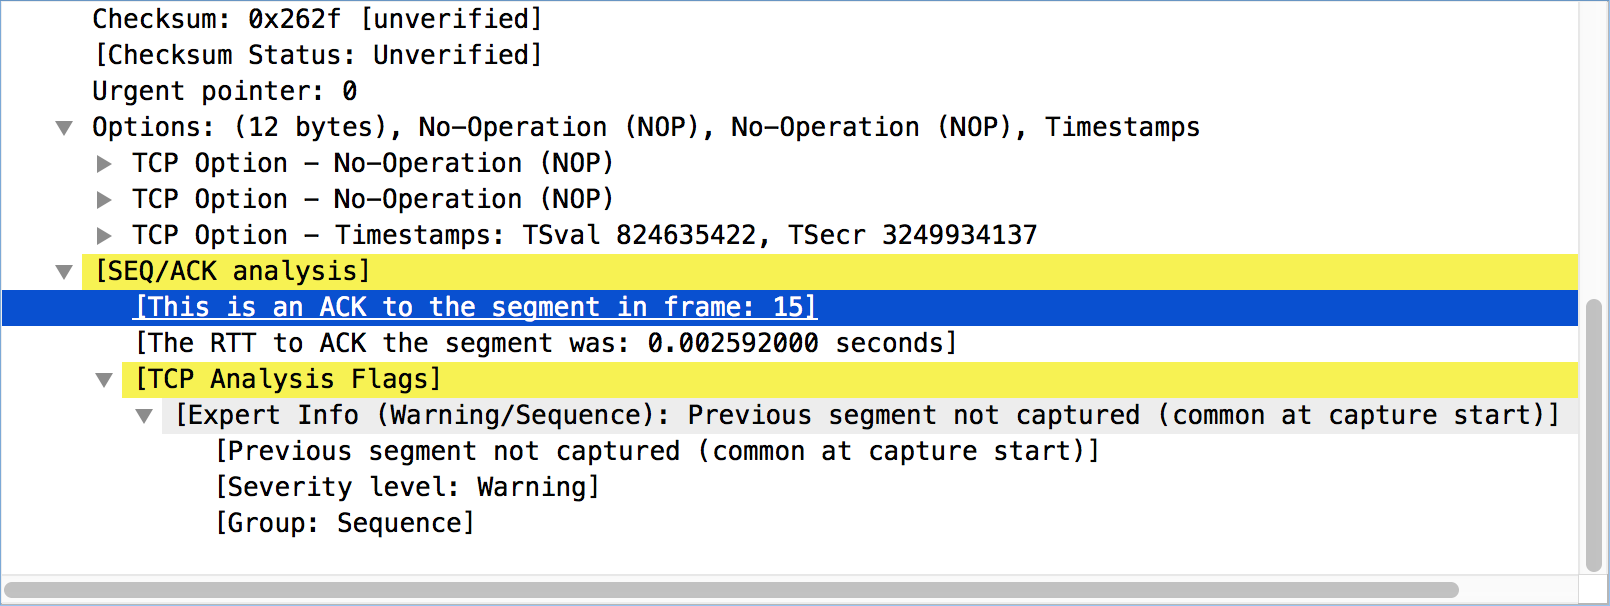
TCP Analysis flags are added to the TCP protocol tree under “SEQ/ACK analysis”. Each flag is described below. Terms such as “next expected sequence number” and “next expected acknowledgment number” refer to the following”:
- Next expected sequence number
- The last-seen sequence number plus segment length. Set when there are no analysis flags and for zero window probes. This is initially zero and calculated based on the previous packet in the same TCP flow. Note that this may not be the same as the tcp.nxtseq protocol field.
- Next expected acknowledgment number
- The last-seen sequence number for segments. Set when there are no analysis flags and for zero window probes.
- Last-seen acknowledgment number
- Always updated for each packet. Note that this is not the same as the next expected acknowledgment number.
TCP ACKed unseen segment
Set when the expected next acknowledgment number is set for the reverse direction and it’s less than the current acknowledgment number.
TCP Dup ACK <frame>#<acknowledgment number>
Set when all of the following are true:
- The segment size is zero.
- The window size is non-zero and hasn’t changed, or there is valid SACK data.
- The next expected sequence number and last-seen acknowledgment number are non-zero (i.e., the connection has been established).
- SYN, FIN, and RST are not set.
TCP Fast Retransmission
Set when all of the following are true:
- This is not a keepalive packet.
- In the forward direction, the segment size is greater than zero or the SYN or FIN is set.
- The next expected sequence number is greater than the current sequence number.
- We have at least two duplicate ACKs in the reverse direction, or more than 2 MSS have been jumped over
- The current sequence number equals the next expected acknowledgment number.
- We saw the last acknowledgment less than 20ms ago.
Supersedes “Out-Of-Order” and “Retransmission”.
TCP Keep-Alive
Set when the segment size is zero or one, the current sequence number is one byte less than the next expected sequence number, and none of SYN, FIN, or RST are set.
Supersedes “Fast Retransmission”, “Out-Of-Order”, “Spurious Retransmission”, and “Retransmission”.
TCP Keep-Alive ACK
Set when all of the following are true:
- The segment size is zero.
- The window size is non-zero and hasn’t changed.
- The current sequence number is the same as the next expected sequence number.
- The current acknowledgment number is the same as the last-seen acknowledgment number.
- The most recently seen packet in the reverse direction was a keepalive.
- The packet is not a SYN, FIN, or RST.
Supersedes “Dup ACK” and “ZeroWindowProbeAck”.
TCP Out-Of-Order
Set when all of the following are true:
- This is not a keepalive packet.
- In the forward direction, the segment length is greater than zero or the SYN or FIN is set.
- The next expected sequence number is greater than the current sequence number.
- The next expected sequence number and the next sequence number differ.
- The last segment arrived within the Out-Of-Order RTT threshold. The threshold is either the value shown in the “iRTT” (tcp.analysis.initial_rtt) field under “SEQ/ACK analysis” if it is present, or the default value of 3ms if it is not.
Supersedes “Retransmission”.
TCP Port numbers reused
Set when the SYN flag is set (not SYN+ACK), we have an existing conversation using the same addresses and ports, and the sequence number is different than the existing conversation’s initial sequence number.
TCP Previous segment not captured
Set when the current sequence number is greater than the next expected sequence number.
TCP Spurious Retransmission
Checks for a retransmission based on analysis data in the reverse direction. Set when all of the following are true:
- The SYN and FIN flags are not set.
- This is not a keepalive packet.
- The segment length is greater than zero.
- Data for this flow has been acknowledged. That is, the last-seen acknowledgment number has been set.
- The next sequence number is less than or equal to the last-seen acknowledgment number.
Supersedes “Fast Retransmission”, “Out-Of-Order”, and “Retransmission”.
TCP Retransmission
Set when all of the following are true:
- This is not a keepalive packet.
- In the forward direction, the segment length is greater than zero or the SYN or FIN flag is set.
- The next expected sequence number is greater than the current sequence number.
TCP Window Full
Set when the segment size is non-zero, we know the window size in the reverse direction, and our segment size exceeds the window size in the reverse direction.
TCP Window Update
Set when the all of the following are true:
- The segment size is zero.
- The window size is non-zero and not equal to the last-seen window size, and there is no valid SACK data.
- The sequence number is equal to the next expected sequence number.
- The acknowledgment number is equal to the last-seen acknowledgment number,
- or to the next expected sequence number when answering to a ZeroWindowProbe.
- None of SYN, FIN, or RST are set.
TCP ZeroWindow
Set when the receive window size is zero and none of SYN, FIN, or RST are set.
The window field in each TCP header advertises the amount of data a receiver can accept. If the receiver can’t accept any more data it will set the window value to zero, which tells the sender to pause its transmission. In some specific cases this is normal — for example, a printer might use a zero window to pause the transmission of a print job while it loads or reverses a sheet of paper. However, in most cases this indicates a performance or capacity problem on the receiving end. It might take a long time (sometimes several minutes) to resume a paused connection, even if the underlying condition that caused the zero window clears up quickly.
TCP ZeroWindowProbe
Set when the sequence number is equal to the next expected sequence number, the segment size is one, and last-seen window size in the reverse direction was zero.
If the single data byte from a Zero Window Probe is dropped by the receiver (not ACKed), then a subsequent segment should not be flagged as retransmission if all of the following conditions are true for that segment:
- The segment size is larger than one.
- The next expected sequence number is one less than the current sequence number.
This affects “Fast Retransmission”, “Out-Of-Order”, or “Retransmission”.
TCP ZeroWindowProbeAck
Set when the all of the following are true:
- The segment size is zero.
- The window size is zero.
- The sequence number is equal to the next expected sequence number.
- The acknowledgment number is equal to the last-seen acknowledgment number.
- The last-seen packet in the reverse direction was a zero window probe.
Supersedes “TCP Dup ACK”.
TCP Ambiguous Interpretations
Some captures are quite difficult to analyze automatically, particularly when the time frame may cover both Fast Retransmission and Out-Of-Order packets. A TCP preference allows to switch the precedence of these two interpretations at the protocol level.
TCP Conversation Completeness
TCP conversations are said to be complete when they have both opening and closing handshakes, independently of any data transfer. However, we might be interested in identifying complete conversations with some data sent, and we are using the following bit values to build a filter value on the tcp.completeness field :
- 1 : SYN
- 2 : SYN-ACK
- 4 : ACK
- 8 : DATA
- 16 : FIN
- 32 : RST
For example, a conversation containing only a three-way handshake will be found with the filter 'tcp.completeness==7' (1+2+4) while a complete conversation with data transfer will be found with a longer filter as closing a connection can be associated with FIN or RST packets, or even both : 'tcp.completeness==31 or tcp.completeness==47 or tcp.completeness==63'
Another way to select specific conversation values is to filter on individual flags, the summary field, or a combination of them. Thus, '(tcp.completeness.fin==1 || tcp.completeness.rst==1) && tcp.completeness.str contains "DASS"' will find all 'Complete, WITH_DATA' conversations, while the 'Complete, NO_DATA' ones will be found with '(tcp.completeness.fin==1 || tcp.completeness.rst==1) && tcp.completeness.data==0 && tcp.completeness.str contains "ASS"'.
TCP Streams Contiguities
The fields "tcp.stream.client.contiguity_count" and "tcp.stream.server.contiguity_count" track the discontinuities of the two TCP streams of a conversation. Any number other than 1 says that either there is no TCP segment at all (0), or that some data is missing (2+). We are only counting the 100 first discontinuities as in most of cases it’s enough to conclude the capture cannot be used for data extraction or there was a serious capture issue.
Time stamps, their precisions and all that can be quite confusing. This section will provide you with information about what’s going on while Wireshark processes time stamps.
While packets are captured, each packet is time stamped as it comes in. These time stamps will be saved to the capture file, so they also will be available for (later) analysis.
So where do these time stamps come from? While capturing, Wireshark gets the time stamps from the libpcap (Npcap) library, which in turn gets them from the operating system kernel. If the capture data is loaded from a capture file, Wireshark obviously gets the data from that file.
The internal format that Wireshark uses to keep a packet time stamp consists of the date (in days since 1.1.1970) and the time of day (in nanoseconds since midnight). You can adjust the way Wireshark displays the time stamp data in the packet list, see the “Time Display Format” item in the Section 3.7, “The “View” Menu” for details.
While reading or writing capture files, Wireshark converts the time stamp data between the capture file format and the internal format as required.
While capturing, Wireshark uses the libpcap (Npcap) capture library which supports nanosecond resolution for both pcapng and pcap files, though some devices may only provide microsecond resolution, in which case that will be used. Unless you are working with specialized capturing hardware, this resolution should be adequate.
The vast majority of capture file formats that Wireshark knows support time stamps. The time stamp precision supported by a specific capture file format differs widely and varies from one second “0” to one nanosecond “0.123456789”. Most file formats store the time stamps with a fixed precision (e.g., microseconds, “0.123456”), while some file formats are capable of storing the time stamp precision itself or even having a different precision for different records in the file (whatever the benefit may be).
The pcapng capture file format supports a wide range of time stamp resolutions, which can be different for each interface in the file, as well as records without time stamps. The common libpcap capture file format, which is widely supported by many other tools, supports two possible fixed resolutions, microsecond or nanosecond, indicated by a magic number at the start of the file. Wireshark and tools like editcap can convert pcap files with nanosecond resolution to microsecond resolution for use with tools that only support the original time stamp precision.
Writing data into a capture file format that doesn’t provide the capability to store the actual precision will lead to loss of information. For example, if you load a capture file with nanosecond resolution and store the capture data in a libpcap file (with microsecond resolution) Wireshark obviously must reduce the precision from nanosecond to microsecond.
People often ask “Which time stamp accuracy is provided by Wireshark?”. Well, Wireshark doesn’t create any time stamps itself but simply gets them from “somewhere else” and displays them. So accuracy will depend on the capture system (operating system, performance, etc.) that you use. Because of this, the above question is difficult to answer in a general way.
|
Note |
|---|---|
|
USB connected network adapters often provide a very bad time stamp accuracy. The incoming packets have to take “a long and winding road” to travel through the USB cable until they actually reach the kernel. As the incoming packets are time stamped when they are processed by the kernel, this time stamping mechanism becomes very inaccurate. Don’t use USB connected NICs when you need precise time stamp accuracy. |
If you travel across the planet, time zones can be confusing. If you get a capture file from somewhere around the world time zones can even be a lot more confusing ;-)
First of all, there are two reasons why you may not need to think about time zones at all:
- You are only interested in the time differences between the packet time stamps and don’t need to know the exact date and time of the captured packets (which is often the case).
- You don’t get capture files from different time zones than your own, so there are simply no time zone problems. For example, everyone in your team is working in the same time zone as yourself.
Further time zone and DST information can be found at https://wwp.greenwichmeantime.com/ and https://www.timeanddate.com/worldclock/.
Set your computer’s time correctly!
If you work with people around the world it’s very helpful to set your computer’s time and time zone right.
You should set your computers time and time zone in the correct sequence:
- Set your time zone to your current location
- Set your computer’s clock to the local time
This way you will tell your computer both the local time and also the time offset to UTC. Many organizations simply set the time zone on their servers and networking gear to UTC in order to make coordination and troubleshooting easier.
|
Tip |
|---|---|
|
If you travel around the world, it’s an often-made mistake to adjust the hours of your computer clock to the local time. Don’t adjust the hours but your time zone setting instead! For your computer, the time is essentially the same as before, you are simply in a different time zone with a different local time. |
You can use the Network Time Protocol (NTP) to automatically adjust your computer to the correct time, by synchronizing it to Internet NTP clock servers. NTP clients are available for all operating systems that Wireshark supports (and for a lot more), for examples see http://www.ntp.org/.
So what’s the relationship between Wireshark and time zones anyway?
Wireshark’s native capture file format (libpcap format), and some other capture file formats, such as the Windows Sniffer, *Peek, Sun snoop formats, and newer versions of the Microsoft Network Monitor and Network Instruments/Viavi Observer formats, save the arrival time of packets as UTC values. UN*X systems, and “Windows NT based” systems represent time internally as UTC. When Wireshark is capturing, no conversion is necessary. However, if the system time zone is not set correctly, the system’s UTC time might not be correctly set even if the system clock appears to display correct local time. When capturing, Npcap has to convert the time to UTC before supplying it to Wireshark. If the system’s time zone is not set correctly, that conversion will not be done correctly.
Other capture file formats, such as the OOS-based Sniffer format and older versions of the Microsoft Network Monitor and Network Instruments/Viavi Observer formats, save the arrival time of packets as local time values.
Internally to Wireshark, time stamps are represented in UTC. This means that when reading capture files that save the arrival time of packets as local time values, Wireshark must convert those local time values to UTC values.
Wireshark in turn will display the time stamps always in local time. The displaying computer will convert them from UTC to local time and displays this (local) time. For capture files saving the arrival time of packets as UTC values, this means that the arrival time will be displayed as the local time in your time zone, which might not be the same as the arrival time in the time zone in which the packet was captured. For capture files saving the arrival time of packets as local time values, the conversion to UTC will be done using your time zone’s offset from UTC and DST rules, which means the conversion will not be done correctly; the conversion back to local time for display might undo this correctly, in which case the arrival time will be displayed as the arrival time in which the packet was captured.
Table 7.2. Time zone examples for UTC arrival times (without DST)
| Los Angeles | New York | Madrid | London | Berlin | Tokyo | |
|---|---|---|---|---|---|---|
Capture File (UTC) |
10:00 |
10:00 |
10:00 |
10:00 |
10:00 |
10:00 |
Local Offset to UTC |
-8 |
-5 |
-1 |
0 |
+1 |
+9 |
Displayed Time (Local Time) |
02:00 |
05:00 |
09:00 |
10:00 |
11:00 |
19:00 |
For example, let’s assume that someone in Los Angeles captured a packet with Wireshark at exactly 2 o’clock local time and sends you this capture file. The capture file’s time stamp will be represented in UTC as 10 o’clock. You are located in Berlin and will see 11 o’clock on your Wireshark display.
Now you have a phone call, video conference or Internet meeting with that one to talk about that capture file. As you are both looking at the displayed time on your local computers, the one in Los Angeles still sees 2 o’clock but you in Berlin will see 11 o’clock. The time displays are different as both Wireshark displays will show the (different) local times at the same point in time.
Conclusion: You may not bother about the date/time of the time stamp you currently look at unless you must make sure that the date/time is as expected. So, if you get a capture file from a different time zone and/or DST, you’ll have to find out the time zone/DST difference between the two local times and “mentally adjust” the time stamps accordingly. In any case, make sure that every computer in question has the correct time and time zone setting.
Network protocols often need to transport large chunks of data which are complete in themselves, e.g., when transferring a file. The underlying protocol might not be able to handle that chunk size (e.g., limitation of the network packet size), or is stream-based like TCP, which doesn’t know data chunks at all.
In that case the network protocol has to handle the chunk boundaries itself and (if required) spread the data over multiple packets. It obviously also needs a mechanism to determine the chunk boundaries on the receiving side.
Wireshark calls this mechanism reassembly, although a specific protocol specification might use a different term for this (e.g., desegmentation, defragmentation, etc.).
For some of the network protocols Wireshark knows of, a mechanism is implemented to find, decode and display these chunks of data. Wireshark will try to find the corresponding packets of this chunk, and will show the combined data as additional tabs in the “Packet Bytes” pane (for information about this pane. See Section 3.20, “The “Packet Bytes” Pane”).
Reassembly might take place at several protocol layers, so it’s possible that multiple tabs in the “Packet Bytes” pane appear.
|
Note |
|---|---|
|
You will find the reassembled data in the last packet of the chunk. |
For example, in a HTTP GET response, the requested data (e.g., an HTML page) is returned. Wireshark will show the hex dump of the data in a new tab “Uncompressed entity body” in the “Packet Bytes” pane.
Reassembly is enabled in the preferences by default but can be disabled in the preferences for the protocol in question. Enabling or disabling reassembly settings for a protocol typically requires two things:
- The lower-level protocol (e.g., TCP) must support reassembly. Often this reassembly can be enabled or disabled via the protocol preferences.
- The higher-level protocol (e.g., HTTP) must use the reassembly mechanism to reassemble fragmented protocol data. This too can often be enabled or disabled via the protocol preferences.
The tooltip of the higher-level protocol setting will notify you if and which lower-level protocol setting also has to be considered.
Protocols such as HTTP or TLS are likely to span multiple TCP segments. The TCP protocol preference “Allow subdissector to reassemble TCP streams” (enabled by default) makes it possible for Wireshark to collect a contiguous sequence of TCP segments and hand them over to the higher-level protocol (for example, to reconstruct a full HTTP message). All but the final segment will be marked with “[TCP segment of a reassembled PDU]” in the packet list.
Disable this preference to reduce memory and processing overhead if you are only interested in TCP sequence number analysis (Section 7.5, “TCP Analysis”). Keep in mind, though, that higher-level protocols might be wrongly dissected. For example, HTTP messages could be shown as “Continuation” and TLS records could be shown as “Ignored Unknown Record”. Such results can also be observed if you start capturing while a TCP connection was already started or when TCP segments are lost or delivered out-of-order.
To reassemble of out-of-order TCP segments, the TCP protocol preference “Reassemble out-of-order segments” (currently disabled by default) must be enabled in addition to the previous preference. If all packets are received in-order, this preference will not have any effect. Otherwise (if missing segments are encountered while sequentially processing a packet capture), it is assuming that the new and missing segments belong to the same PDU. Caveats:
- Lost packets are assumed to be received out-of-order or retransmitted later. Applications usually retransmit segments until these are acknowledged, but if the packet capture drops packets, then Wireshark will not be able to reconstruct the TCP stream. In such cases, you can try to disable this preference and hopefully have a partial dissection instead of seeing just “[TCP segment of a reassembled PDU]” for every TCP segment.
- When doing a capture in monitor mode (IEEE 802.11), packets are more likely to get lost due to signal reception issues. In that case it is recommended to disable the option.
-
If the new and missing segments are in fact part of different PDUs,
then processing is currently delayed until no more segments are missing, even
if the begin of the missing segments completed a PDU. For example, assume six
segments forming two PDUs
ABCandDEF. When received asABECDF, an application can start processing the first PDU after receivingABEC. Wireshark however requires the missing segmentDto be received as well. This issue will be addressed in the future. -
In the GUI and during a two-pass dissection (
tshark -2), the previous scenario will display both PDUs in the packet with last segment (F) rather than displaying it in the first packet that has the final missing segment of a PDU. This issue will be addressed in the future. -
When enabled, fields such as the SMB “Time from request” (
smb.time) might be smaller if the request follows other out-of-order segments (this reflects application behavior). If the previous scenario however occurs, then the time of the request is based on the frame where all missing segments are received.
Regardless of the setting of these two reassembly-related preferences, you can always use the “Follow TCP Stream” option (Section 7.2, “Following Protocol Streams”) which displays segments in the expected order.
Name resolution tries to convert some of the numerical address values into a human readable format. There are two possible ways to do these conversions, depending on the resolution to be done: calling system/network services (like the gethostname() function) and/or resolving from Wireshark specific configuration files. For details about the configuration files Wireshark uses for name resolution and alike, see Section A.2.4, “[Stream setup by PROTOCOL (frame 123)]”.
The name resolution feature can be enabled individually for the protocol layers listed in the following sections.
Name resolution can be invaluable while working with Wireshark and may even save you hours of work. Unfortunately, it also has its drawbacks.
- Name resolution can often fail. The name to be resolved might simply be unknown by the name servers asked, or the servers are just not available and the name is also not found in Wireshark’s configuration files.
- Resolved names might not be available. Wireshark obtains name resolution information from a variety of sources, including DNS servers, the capture file itself (e.g., for a pcapng file), and the hosts files on your system and in your profile directory. The resolved names might not be available if you open the capture file later or on a different machine. As a result, each time you or someone else opens a particular capture file it may look slightly different due to changing environments.
-
DNS may add additional packets to your capture file. You might run into the observer effect if the extra traffic from Wireshark’s DNS queries and responses affects the problem you’re trying to troubleshoot or any subsequent analysis.
The same sort of thing can happen when capturing over a remote connection, e.g., SSH or RDP.
- Resolved DNS names are cached by Wireshark. This is required for acceptable performance. However, if the name resolution information should change while Wireshark is running, Wireshark won’t notice a change in the name resolution information once it gets cached. If this information changes while Wireshark is running, e.g., a new DHCP lease takes effect, Wireshark won’t notice it.
Name resolution in the packet list is done while the list is filled. If a name can be resolved after a packet is added to the list, its former entry won’t be changed. As the name resolution results are cached, you can use → to rebuild the packet list with the correctly resolved names.
Try to resolve an Ethernet MAC address (e.g., 00:09:5b:01:02:03) to a human readable name.
ARP name resolution (system service): Wireshark will ask the operating system to convert an Ethernet address to the corresponding IP address (e.g. 00:09:5b:01:02:03 → 192.168.0.1).
Ethernet codes (ethers file): If the ARP name resolution failed, Wireshark tries to convert the Ethernet address to a known device name, which has been assigned by the user using an ethers file (e.g., 00:09:5b:01:02:03 → homerouter).
Ethernet manufacturer codes (manuf file): If neither ARP or ethers returns a result, Wireshark tries to convert the first 3 bytes of an ethernet address to an abbreviated manufacturer name, which has been assigned by the IEEE (e.g. 00:09:5b:01:02:03 → Netgear_01:02:03).
Try to resolve an IP address (e.g., 216.239.37.99) to a human readable name.
DNS name resolution (system/library service): Wireshark will use a name resolver to convert an IP address to the hostname associated with it (e.g., 216.239.37.99 → www.1.google.com).
Most applications use synchronously DNS name resolution. For example, your web browser must resolve the host name portion of a URL before it can connect to the server. Capture file analysis is different. A given file might have hundreds, thousands, or millions of IP addresses so for usability and performance reasons Wireshark uses asynchronous resolution. Both mechanisms convert IP addresses to human readable (domain) names and typically use different sources such as the system hosts file (/etc/hosts) and any configured DNS servers.
Since Wireshark doesn’t wait for DNS responses, the host name for a given address might be missing from a given packet when you view it the first time but be present when you view it subsequent times.
You can adjust name resolution behavior in the Name Resolution section in the Preferences Dialog. You can control resolution itself by adding a hosts file to your personal configuration directory. You can also edit your system hosts file, but that isn’t generally recommended.
Another option is to group addresses by their subnet. For instance a common private network is 192.168.0.0/16. Adding this to the subnets file allows Wireshark to show an unknown host in this address range to be part of this network, e.g. "private:18.145". A similar file exists for IPv6 subnets. See Section B.3, “Configuration Files” for more details.
Try to resolve a TCP/UDP port (e.g., 80) to a human readable name.
TCP/UDP port conversion (system service): Wireshark will ask the operating system to convert a TCP or UDP port to its well-known name (e.g., 80 → http).
Several network protocols use checksums to ensure data integrity. Applying checksums as described here is also known as redundancy checking.
Wireshark will validate the checksums of many protocols, e.g., IP, TCP, UDP, etc.
It will do the same calculation as a “normal receiver” would do, and shows the checksum fields in the packet details with a comment, e.g., [correct] or [invalid, must be 0x12345678].
Checksum validation can be switched off for various protocols in the Wireshark protocol preferences, e.g., to (very slightly) increase performance.
If the checksum validation is enabled and it detected an invalid checksum, features like packet reassembly won’t be processed. This is avoided as incorrect connection data could “confuse” the internal database.
The checksum calculation might be done by the network driver, protocol driver or even in hardware.
For example: The Ethernet transmitting hardware calculates the Ethernet CRC32 checksum and the receiving hardware validates this checksum. If the received checksum is wrong Wireshark won’t even see the packet, as the Ethernet hardware internally throws away the packet.
Higher-level checksums are “traditionally” calculated by the protocol implementation and the completed packet is then handed over to the hardware.
Recent network hardware can perform advanced features such as IP checksum calculation, also known as checksum offloading. The network driver won’t calculate the checksum itself but will simply hand over an empty (zero or garbage filled) checksum field to the hardware.
|
Note |
|---|---|
|
Checksum offloading often causes confusion as network packets to be transmitted are given to Wireshark before they are handed over to the hardware. Wireshark gets these “empty” checksums and displays them as invalid, even though the packets will contain valid checksums when they transit the network. This only applies to packets that are locally generated by the capture point. Received packets will have traveled through network hardware and should have correct checksums. |
Checksum offloading can be confusing and having a lot of [invalid] messages on the screen can be quite annoying. As mentioned above, invalid checksums may lead to unreassembled packets, making the analysis of the packet data much harder.
You can do two things to avoid this checksum offloading problem:
- Turn off the checksum offloading in the network driver, if this option is available.
- Turn off checksum validation of the specific protocol in the Wireshark preferences. Recent releases of Wireshark disable checksum validation by default due to the prevalence of offloading in modern hardware and operating systems.
TCP and UDP checksums are calculated over both the payload and from selected elements from the IPv4 or IPv6 header, known as the pseudo header. Linux and Windows, when offloading checksums, will calculate the contribution from the pseudo header and place it in the checksum field. The driver then directs the hardware to calculate the checksum over the payload area, which will produce the correct result including the pseudo header’s portion of the sum as a matter of mathematics.
This precomputation speeds up the hardware checksum calculation later, allows the driver to direct the hardware to do checksums over encapsulated payloads (Local Checksum Offload), and allows applications to send the kernel large "superpacket" buffers that will be later divided by the hardware into multiple maximum size packets when sent on the network (TCP Segmentation Offload (TSO) and Generic Segmentation Offload (GSO)).
|
Note |
|---|---|
|
Wireshark 4.2.0 and later can calculate the partial checksum contribution from the pseudo header, and when validating TCP and UDP checksums will mark partial checksums as valid but partial. The packets with partial checksums will not be colored as Bad Checksums by the default coloring rules, and will still be used for reassembly. This eliminates spurious checksum errors seen on packets transmitted from the capturing host on those platforms that use partial checksums when offloading. |
Table of Contents
- 8.1. Introduction
- 8.2. The “Capture File Properties” Dialog
- 8.3. Resolved Addresses
- 8.4. The “Protocol Hierarchy” Window
- 8.5. Conversations
- 8.6. Endpoints
- 8.7. Packet Lengths
- 8.8. The “I/O Graphs” Window
- 8.9. The “Plots” Window
- 8.10. Service Response Time
- 8.11. Distribution Statistics
- 8.12. DHCP (BOOTP) Statistics
- 8.13. NetPerfMeter Statistics
- 8.14. ONC-RPC Programs
- 8.15. 29West
- 8.16. ANCP
- 8.17. BACnet
- 8.18. Collectd
- 8.19. DNS
- 8.20. Flow Graph
- 8.21. HART-IP
- 8.22. HPFEEDS
- 8.23. HTTP Statistics
- 8.24. HTTP2
- 8.25. Sametime
- 8.26. TCP Stream Graphs
- 8.27. UDP Multicast Streams
- 8.28. Reliable Server Pooling (RSerPool)
- 8.29. F5
- 8.30. IPv4 Statistics
- 8.31. IPv6 Statistics
Wireshark provides a wide range of network statistics which can be accessed via the menu.
These statistics range from general information about the loaded capture file (like the number of captured packets), to statistics about specific protocols (e.g., statistics about the number of HTTP requests and responses captured).
General statistics
- Capture File Properties about the capture file.
- Protocol Hierarchy of the captured packets.
- Conversations e.g., traffic between specific IP addresses.
- Endpoints e.g., traffic to and from IP addresses.
- I/O Graphs visualizing the number of packets (or similar) in time.
Protocol specific statistics
- Service Response Time between request and response of some protocols.
- Various other protocol specific statistics.
|
Note |
|---|---|
|
The protocol specific statistics require detailed knowledge about the specific protocol. Unless you are familiar with that protocol, statistics about it may be difficult to understand. |
Wireshark has many other statistics windows that display detailed information about specific protocols and might be described in a later version of this document.
Some of these statistics are described at https://wiki.wireshark.org/Statistics.
General information about the current capture file.
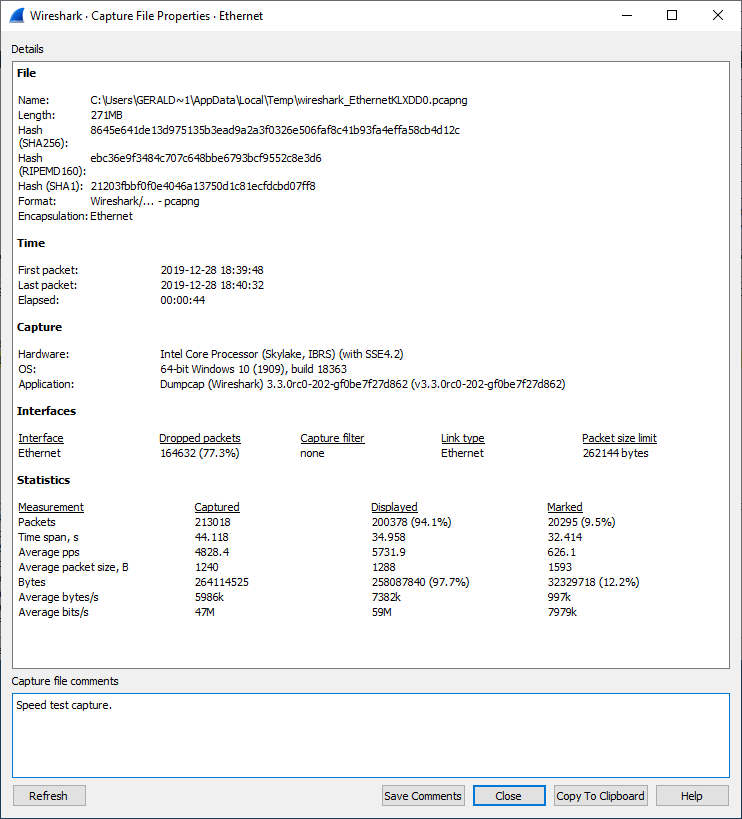
This dialog shows the following information:
- Details
-
Notable information about the capture file.
- File
- General information about the capture file, including its full path, size, cryptographic hashes, file format, and encapsulation.
- Time
- The timestamps of the first and the last packet in the file along with their difference.
- Capture
- Information about the capture environment. This will only be shown for live captures or if this information is present in a saved capture file. The pcapng format supports this, while pcap doesn’t.
- Interfaces
- Information about the capture interface or interfaces.
- Statistics
- A statistical summary of the capture file. If a display filter is set, you will see values in the Captured column, and if any packets are marked, you will see values in the Marked column. The values in the Captured column will remain the same as before, while the values in the Displayed column will reflect the values corresponding to the packets shown in the display. The values in the Marked column will reflect the values corresponding to the marked packages.
- Capture file comments
- Some capture file formats (notably pcapng) allow a text comment for the entire file. You can view and edit this comment here.
- Updates the information in the dialog.
- Saves the contents of the “Capture file comments” text entry.
- Closes the dialog
- Copies the “Details” information to the clipboard.
- Opens this section of the User’s Guide.
The Resolved Addresses window shows the list of resolved addresses and their host names. Users can choose the Hosts field to display IPv4 and IPv6 addresses only. In this case, the dialog displays host names for each IP address in a capture file with a known host. This host is typically taken from DNS answers in a capture file. In case of an unknown host name, users can populate it based on a reverse DNS lookup. To do so, follow these steps:
-
Enable
Resolve Network Addressesin the → menu as this option is disabled by default. -
Select
Use an external network name resolverin the → menu. This option is enabled by default.
|
Note |
|---|---|
|
The resolved addresses are not updated automatically after a user changes the settings. To display newly available names, the user has to reopen the dialog. |
The Ports tab shows the list of service names, ports and types.
Wireshark reads the entries for port mappings from the hosts service configuration files. See Section B.3, “Configuration Files” section for more information.
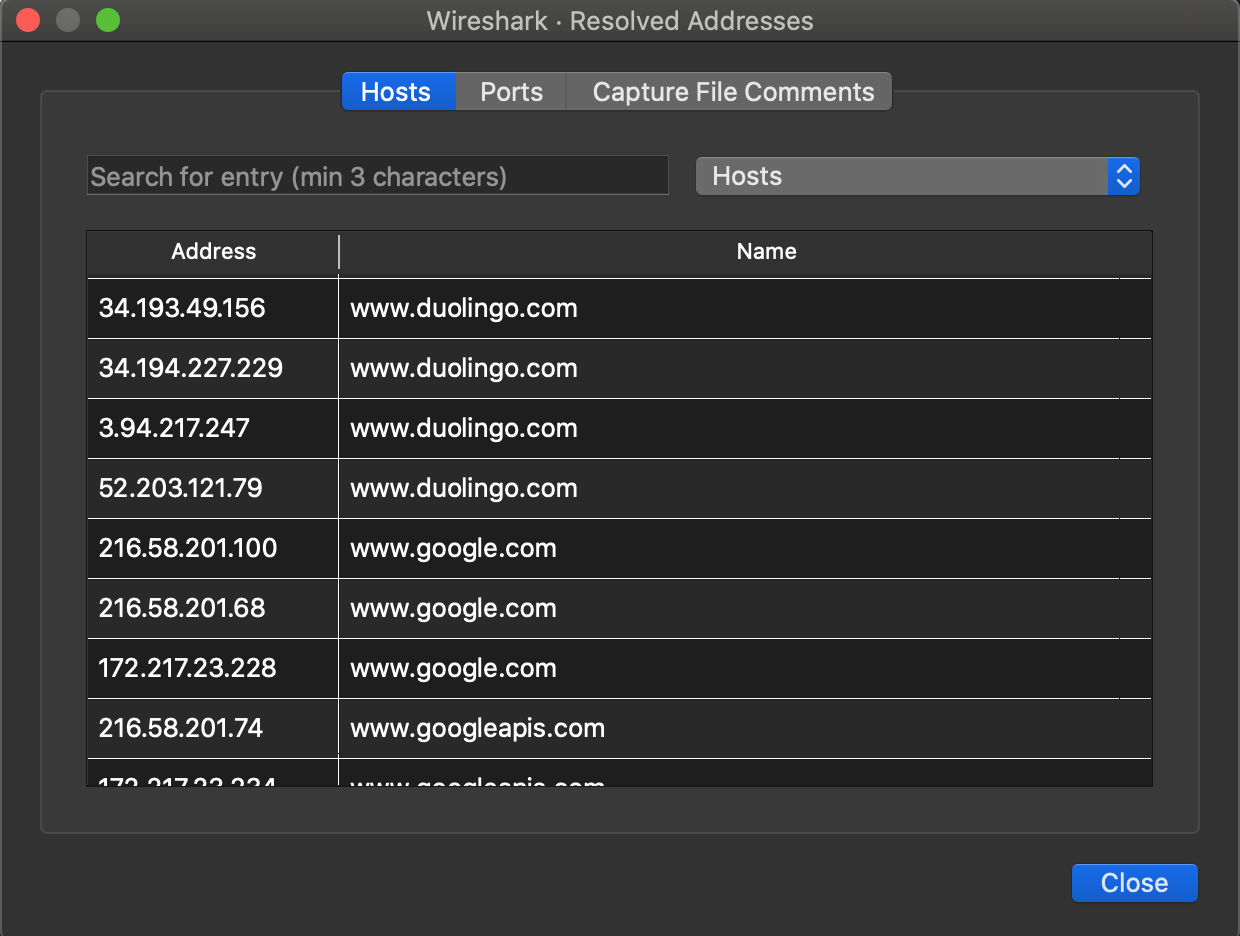
The protocol hierarchy of the captured packets.
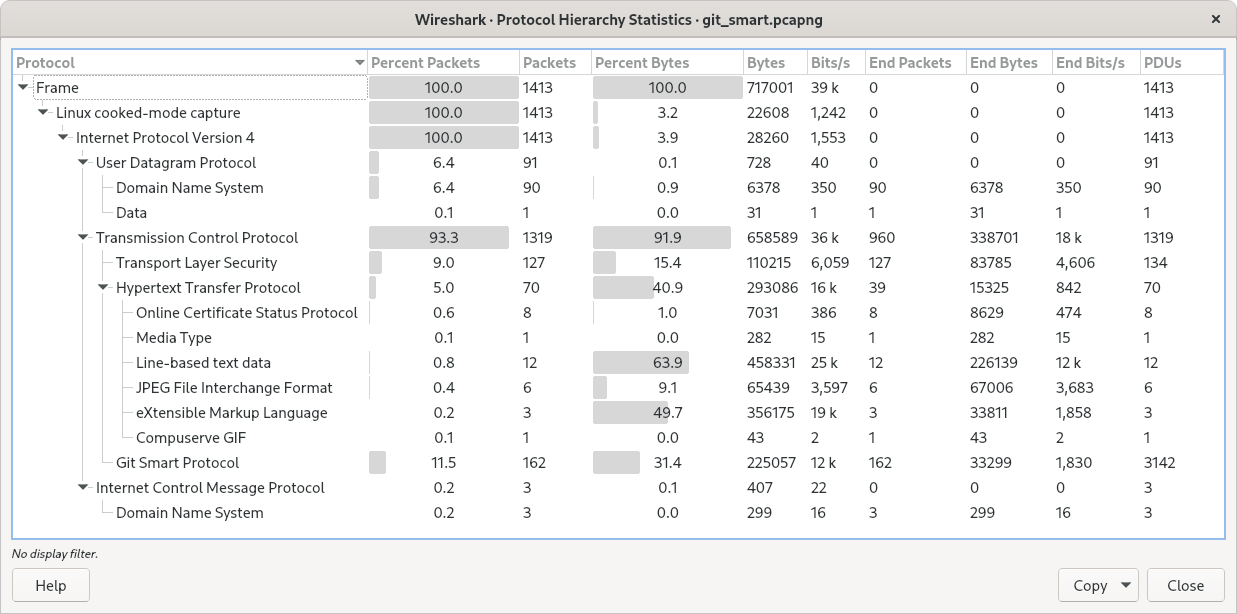
This is a tree of all the protocols in the capture. Each row contains the statistical values of one protocol. Two of the columns (Percent Packets and Percent Bytes) serve double duty as bar graphs. If a display filter is set it will be shown at the bottom.
The button will let you copy the window contents as CSV or YAML.
Protocol hierarchy columns
- Protocol
- This protocol’s name.
- Percent Packets
- The percentage of protocol packets relative to all packets in the capture.
- Packets
- The total number of packets that contain this protocol.
- Percent Bytes
- The percentage of protocol bytes relative to the total bytes in the capture.
- Bytes
- The total number of bytes of this protocol.
- Bits/s
- The bandwidth of this protocol relative to the capture time.
- End Packets
- The absolute number of packets of this protocol where it was the highest protocol in the stack (last dissected).
- End Bytes
- The absolute number of bytes of this protocol where it was the highest protocol in the stack (last dissected).
- End Bits/s
- The bandwidth of this protocol relative to the capture time where was the highest protocol in the stack (last dissected).
- PDUs
- The total number of PDUs of this protocol.
Packets usually contain multiple protocols. As a result, more than one protocol will be counted for each packet. Example: In the screenshot 100% of packets are IP and 93.3% are TCP (which is together much more than 100%).
Protocol layers can consist of packets that won’t contain any higher layer protocol, so the sum of all higher layer packets may not sum to the protocol’s packet count. This can be caused by segments and fragments reassembled in other frames, TCP protocol overhead, and other undissected data. Example: In the screenshot 93.3% of the packets are TCP but the sum of the subprotocols (TLS, HTTP, Git, etc.) is much less.
A single packet can contain the same protocol more than once. In this case, the
entry in the PDUs column will be greater than that of Packets. Example:
In the screenshot there are many more TLS and Git PDUs than there are packets.
A network conversation is the traffic between two specific endpoints. For example, an IP conversation is all the traffic between two IP addresses. The description of the known endpoint types can be found in Section 8.6, “Endpoints”.
The conversations are influenced by the Deinterlacing conversations key preference.
The conversations window is similar to the endpoint Window. See Section 8.6.1, “The “Endpoints” Window” for a description of their common features. Along with addresses, packet counters, and byte counters the conversation window adds four columns: the start time of the conversation (“Rel Start”) or (“Abs Start”), the duration of the conversation in seconds, and the average bits (not bytes) per second in each direction. A timeline graph is also drawn across the “Rel Start” / “Abs Start” and “Duration” columns.
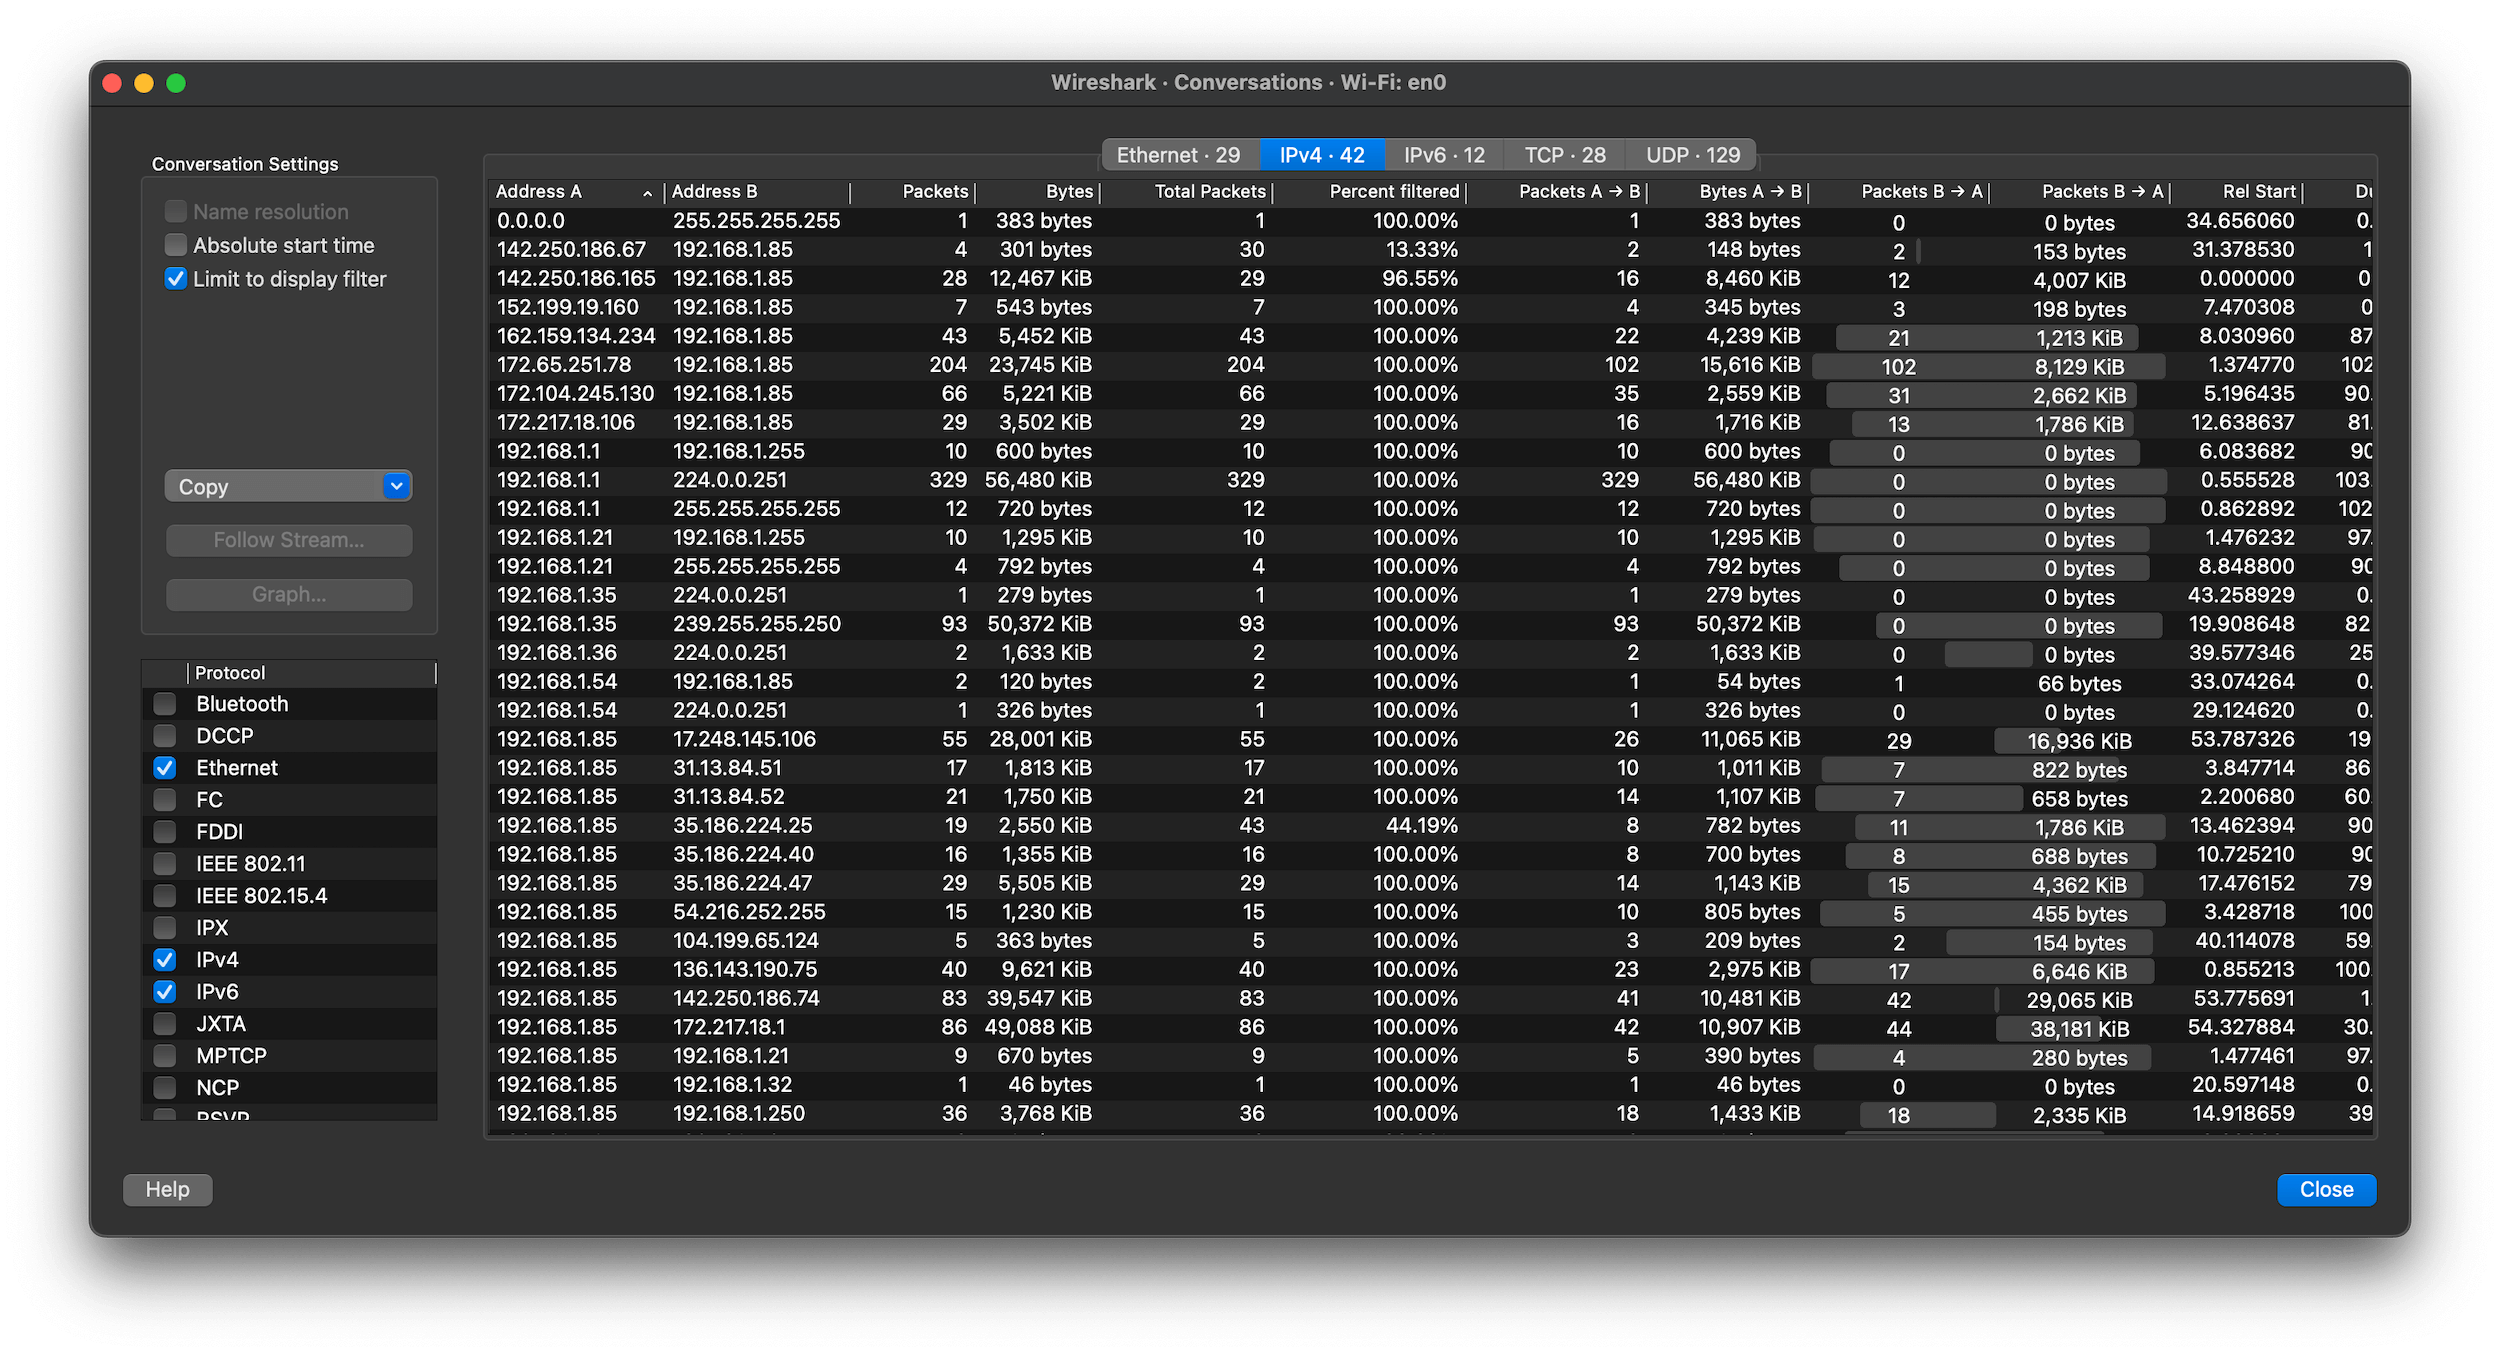
Each row in the list shows the statistical values for exactly one conversation.
Name resolution will be done if selected in the window and if it is active for the specific protocol layer (MAC layer for the selected Ethernet endpoints page). Limit to display filter will only show conversations matching the current display filter. Absolute start time switches the start time column between relative (“Rel Start”) and absolute (“Abs Start”) times. Relative start times match the “Seconds Since First Captured Packet” time display format in the packet list and absolute start times match the “Time of Day” display format.
If a display filter had been applied before the dialog is opened, Limit to display filter will be set automatically. Additionally, after a display filter had been applied, two columns ("Total Packets") and ("Percent Filtered") show the number of unfiltered total packets and the percentage of packets in this filter display.
The button will copy the list values to the clipboard in CSV (Comma Separated Values), YAML format or JSON format. The numbers are generally exported without special formatting, but this can be enabled if needed.
The button will show the stream contents as described in Figure 7.1, “The “Follow TCP Stream” dialog box” dialog. The button will show a Time Sequence graph as described in Section 8.26, “TCP Stream Graphs”. The will open the I/O Graph dialog described in Section 8.8, “The “I/O Graphs” Window”, with the selected conversations.
lets you choose which traffic type tabs are shown. See Section 8.6, “Endpoints” for a list of endpoint types. The enabled types are saved in your profile settings, as well as the last opened tab.
|
Tip |
|---|---|
|
This window will be updated frequently so it will be useful even if you open it before (or while) you are doing a live capture. |
A network endpoint is the logical endpoint of separate protocol traffic of a specific protocol layer. The endpoint statistics of Wireshark will take the following endpoints into account:
|
Tip |
|---|---|
|
If you are looking for a feature other network tools call a hostlist, here is the right place to look. The list of Ethernet or IP endpoints is usually what you’re looking for. |
Endpoint and Conversation types
- Bluetooth
- A MAC-48 address similar to Ethernet.
- Ethernet
- Identical to the Ethernet device’s MAC-48 identifier.
- Fibre Channel
- A MAC-48 address similar to Ethernet.
- IEEE 802.11
- A MAC-48 address similar to Ethernet.
- FDDI
- Identical to the FDDI MAC-48 address.
- IPv4
- Identical to the 32-bit IPv4 address.
- IPv6
- Identical to the 128-bit IPv6 address.
- IPX
- A concatenation of a 32-bit network number and 48-bit node address, by default the Ethernet interface’s MAC-48 address.
- JXTA
- A 160-bit SHA-1 URN.
- NCP
- Similar to IPX.
- RSVP
- A combination of various RSVP session attributes and IPv4 addresses.
- SCTP
- A combination of the host IP addresses (plural) and the SCTP port used. So different SCTP ports on the same IP address are different SCTP endpoints, but the same SCTP port on different IP addresses of the same host are still the same endpoint.
- TCP
- A combination of the IP address and the TCP port used. Different TCP ports on the same IP address are different TCP endpoints.
- Token Ring
- Identical to the Token Ring MAC-48 address.
- UDP
- A combination of the IP address and the UDP port used, so different UDP ports on the same IP address are different UDP endpoints.
- USB
- Identical to the 7-bit USB address.
|
Broadcast and multicast endpoints |
|---|---|
|
Broadcast and multicast traffic will be shown separately as additional endpoints. Of course, as these aren’t physical endpoints the real traffic will be received by some or all of the listed unicast endpoints. |
This window shows statistics about the endpoints captured.
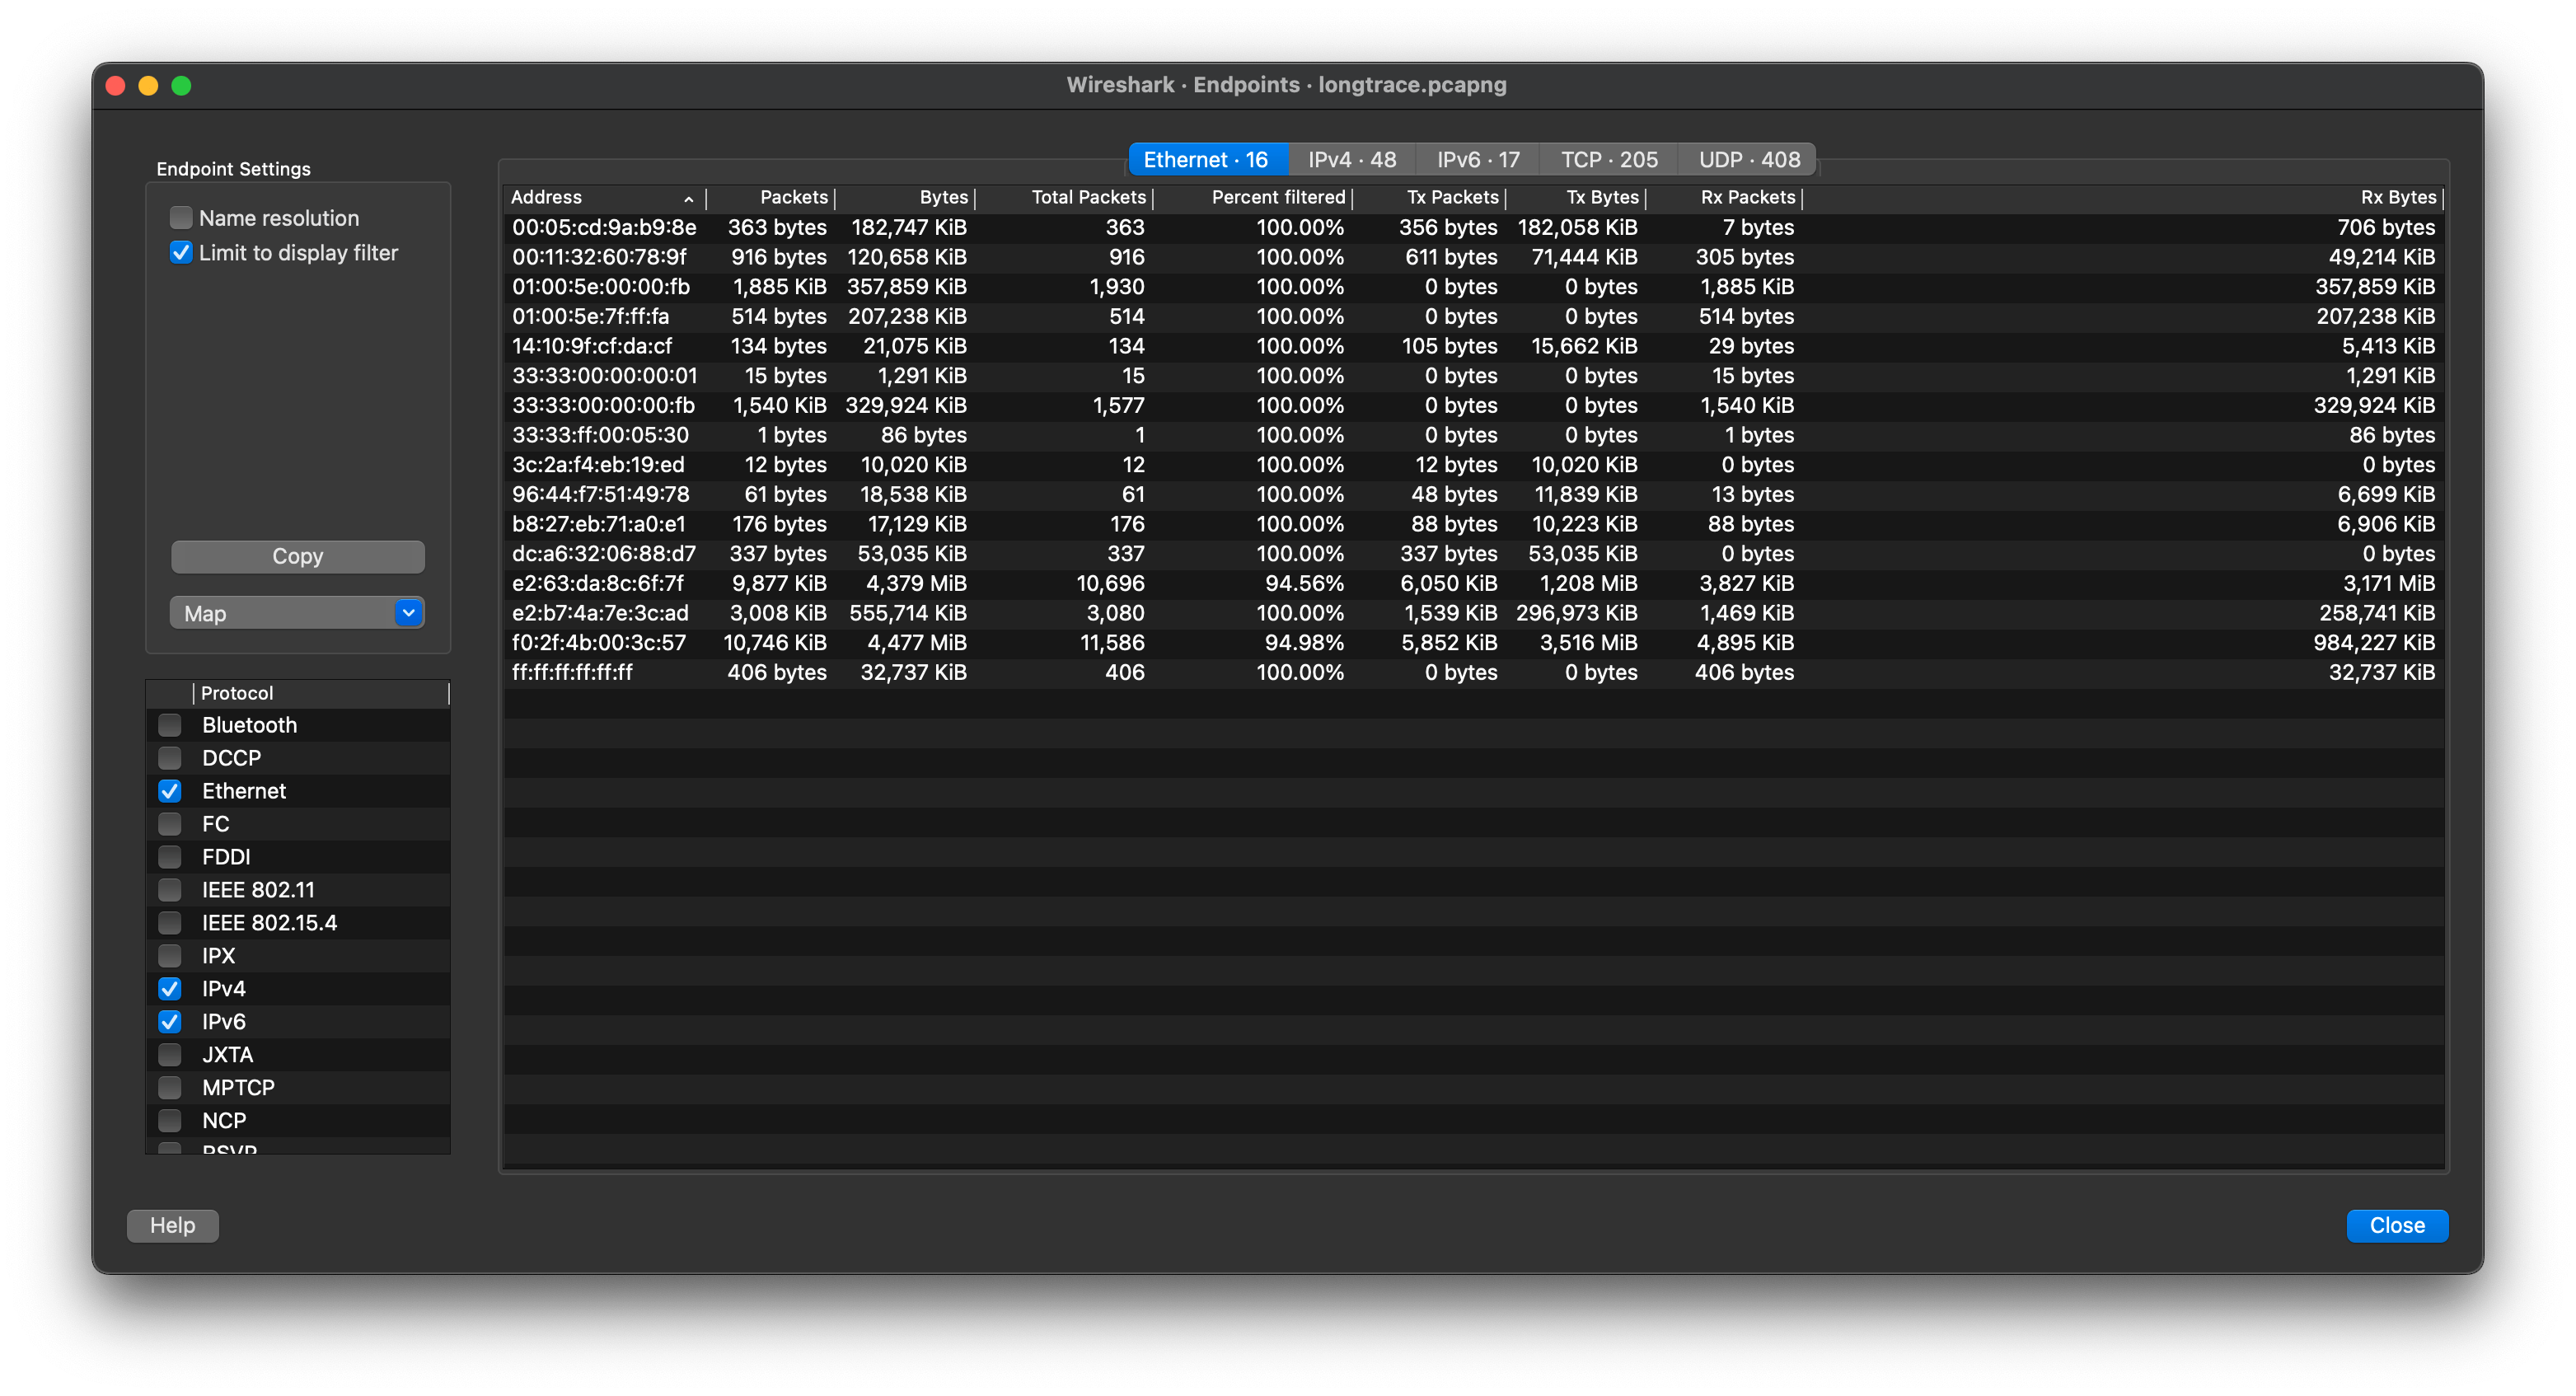
For each supported protocol, a tab is shown in this window. Each tab label shows the number of endpoints captured (e.g., the tab label “Ethernet · 4” tells you that four ethernet endpoints have been captured). If no endpoints of a specific protocol were captured, the tab label will be greyed out (although the related page can still be selected).
Each row in the list shows the statistical values for exactly one endpoint.
Name resolution will be done if selected in the window and if it is active for the specific protocol layer (MAC layer for the selected Ethernet endpoints page). Limit to display filter will only show conversations matching the current display filter. Note that in this example we have MaxMind DB configured which gives us extra geographic columns. See Section 11.9, “MaxMind Database Paths” for more information.
If a display filter had been applied before the dialog is opened, Limit to display filter will be set automatically. Additionally, after a display filter had been applied, two columns ("Total Packets") and ("Percent Filtered") show the number of unfiltered total packets and the percentage of packets in this filter display.
For IPv4 endpoints only, the Hide aggregated checkbox controls how the traffic identified from the subnets file should be displayed. By default (not checked), the individual endpoints and the subnets are both displayed, and when checked, only the aggregation is. The traffic which is not matching any subnet is kept as it is. This checkbox is available only when the IPv4 user preference Aggregate subnets in Statistics Dialogs is enabled. See Section B.3, “Configuration Files” for the subnets file description. image::images/ws-stats-endpoints-ipv4aggregation.png[scaledwidth="85%"]
The button will copy the list values to the clipboard in CSV (Comma Separated Values), YAML format or JSON format. The numbers are generally exported without special formatting, but this can be enabled if needed. The button will show the endpoints mapped in your web browser.
lets you choose which traffic type tabs are shown. See Section 8.6, “Endpoints” above for a list of endpoint types. The enabled types are saved in your profile settings, as well as the last opened tab.
|
Tip |
|---|---|
|
This window will be updated frequently, so it will be useful even if you open it before (or while) you are doing a live capture. |
Shows the distribution of packet lengths and related information.
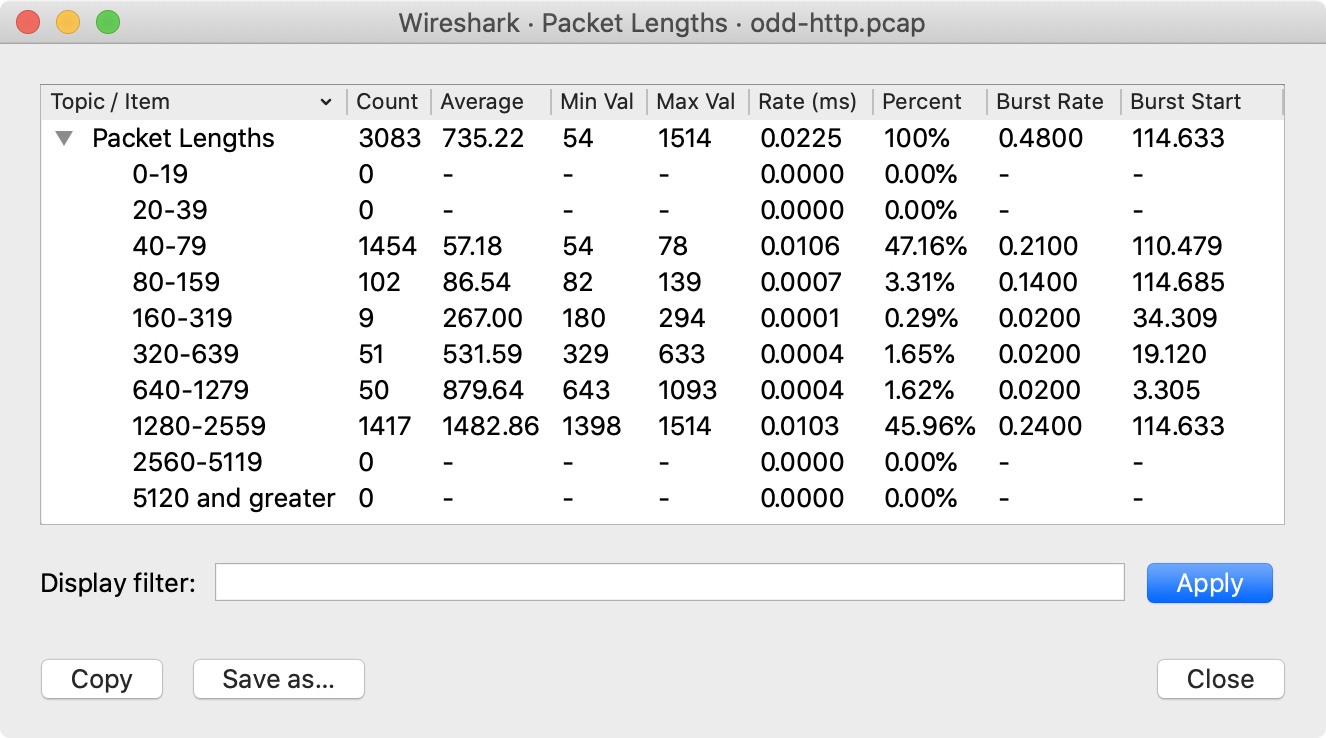
Information is broken down by packet length ranges as shown above.
- Packet Lengths
-
The range of packet lengths.
Ranges can be configured in the “Statistics → Stats Tree” section of the Preferences Dialog.
- Count
- The number of packets that fall into this range.
- Average
- The arithmetic mean of the packet lengths in this range.
- Min Val, Max Val
- The minimum and maximum lengths in this range.
- Rate (ms)
- The average packets per millisecond for the packets in this range.
- Percent
- The percentage of packets in this range, by count.
- Burst Rate
-
Packet bursts are detected by counting the number of packets in a given time interval and comparing that count to the intervals across a window of time. Statistics for the interval with the maximum number of packets are shown. By default, bursts are detected across 5 millisecond intervals and intervals are compared across 100 millisecond windows.
These calculations can be adjusted in the “Statistics” section of the Preferences Dialog.
- Burst Start
- The start time, in seconds from the beginning of the capture, for the interval with the maximum number of packets.
You can show statistics for a portion of the capture by entering a display filter into the Display filter entry and pressing .
copies the statistics to the clipboard. lets you save the data as text, CSV, YAML, or XML.
Lets you plot packet and protocol data in a variety of ways.
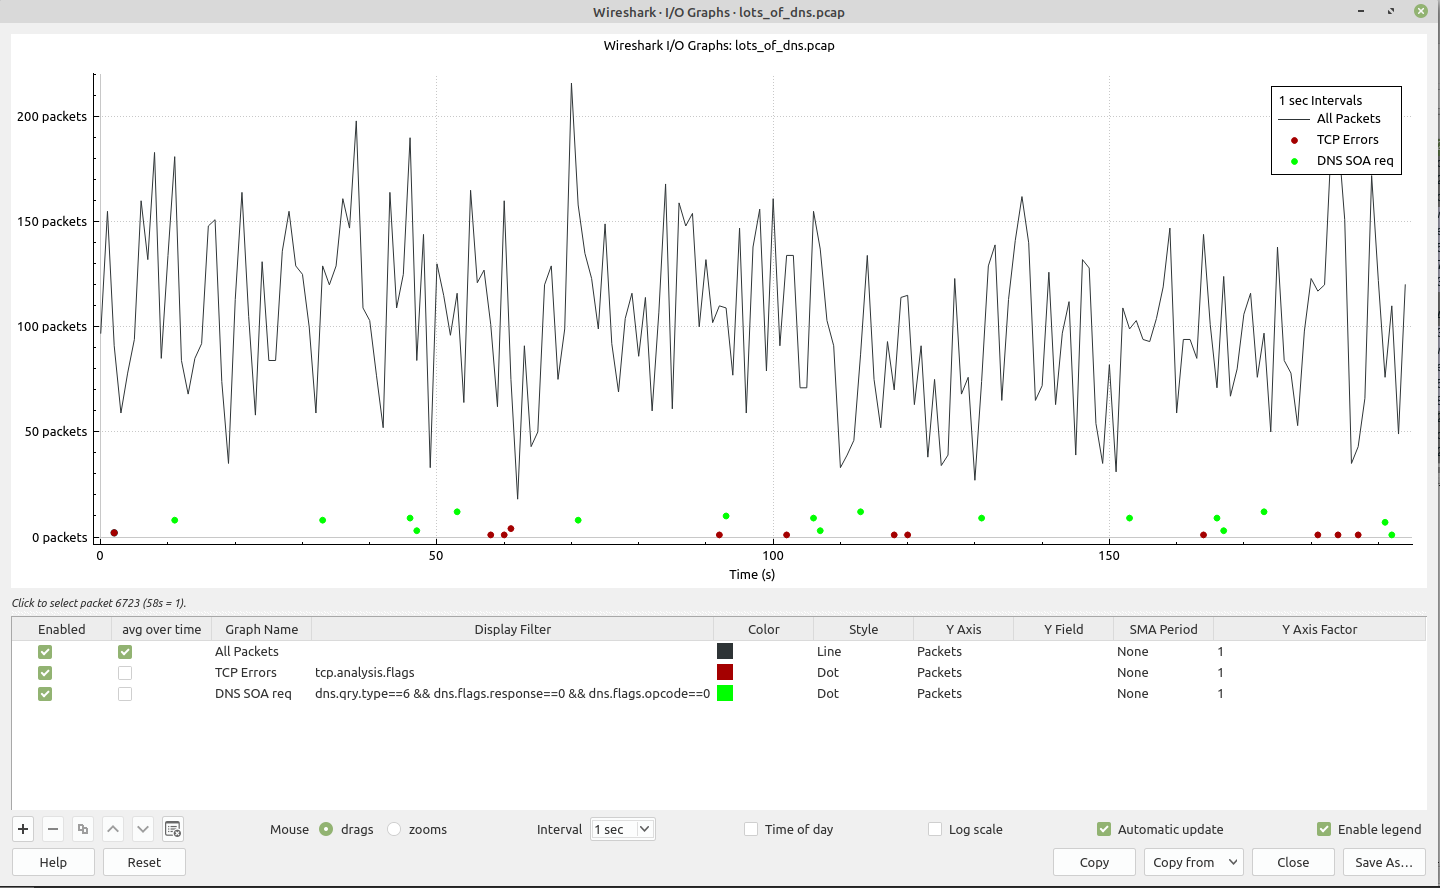
As shown above, this window contains a chart drawing area along with a customizable list of graphs. Graphs are saved in your current profile. They are divided into time intervals, which can be set as described below. Hovering over the graph shows the last packet number of the selected graph (or by default, the first enabled graph in the graphs list) in each interval except as noted below. If the graph was customized, instead of the packet number it will show a value computed according to the custom settings (ex: MAX,MIN,..). Clicking on the graph takes you to the associated packet in the packet list. Individual graphs can be configured using the following options:
- Enabled
- Draw or don’t draw this graph.
- Avg over Time
- When checked and the “Y Axis” value is one of Packets/Bytes/Bits, the displayed value is an average over time based on the Interval, instead of the raw value. The ordinary throughput is obtained when “Y Axis” is set to Bits.
- Graph Name
- The name of this graph.
- Display Filter
- Limits the graph to packets that match this filter.
- Color
- The color to use for plotting the graph’s lines, bars, or points.
- Style
- How to visually represent the graph’s data, e.g., by drawing a line, bar, circle, plus, etc.
- Y Axis
-
The value to use for the graph’s Y axis. Can be one of:
- Packets, Bytes, or Bits
- The total number of packets, packet bytes, or packet bits that match the graph’s display filter per interval. Zero values are omitted in some cases.
- SUM(Y Field)
- The sum of the values of the field specified in “Y Field” per interval.
- COUNT FRAMES(Y Field)
- The number of frames that contain the field specified in “Y Field” per interval.
- COUNT FIELDS(Y Field)
- The number of instances of the field specified in “Y Field” per interval. Some fields, such as dns.resp.name, can show up multiple times in a packet.
- MAX(Y Field), MIN(Y Field), AVG(Y Field)
- The maximum, minimum, and arithmetic mean values of the specified “Y Field” per interval. For MAX and MIN values, hovering and clicking the graph will show and take you to the packet with the MAX or MIN value in the interval instead of the most recent packet.
- LOAD(Y Field)
-
The queue depth, i.e., number of concurrent requests or calls, in each interval expressed in Erlangs.
Requires “Y Field” be a relative time value, and treats it as the duration of an event which
ended in the containing packet. Useful for response time fields like
smb.time. - THROUGHPUT(Y Field)
- If the “Y Field” is a payload (as frame.len, ip.len, ipv6.plen..), this is the computed throughput based on this payload. The “Y Axis Factor” needs to be set accordingly to the payload unit to have a value expressed in bits unit (ex: ip.len being expressed as Bytes, set Y Axis Factor to 8).
- Y Field
- The display filter field from which to extract values for the Y axis calculations listed above.
- SMA Period
- Show a simple moving average of values over a specified period of intervals.
- Y Axis Factor
- Scale the Y axis for this graph by multiplying by a constant factor, e.g. to graph bits if the “Y Field” contains bytes, or to present multiple graphs at a similar scale.
The chart as a whole can be configured using the controls under the graph list:
- Add a new graph.
- Remove the selected graph(s).
- Copy the selected graph(s).
- Move the selected graph(s) up in the list.
- Move the selected graph(s) down in the list.
- Remove all graphs.
- Mouse drags / zooms
- When using the mouse inside the graph area, either drag the graph contents or select a zoom area.
- Interval
- Set the interval period for the graph.
- Time of day
- Switch between showing the absolute time of day or the time relative from the start of capture in the X axis.
- Log scale
- Switch between a logarithmic or linear Y axis.
- Automatic updates
- Redraw each graph automatically.
- Enable legend
- Show a graph legend.
The main dialog buttons along the bottom let you do the following:
will take you to this section of the User’s Guide.
will autoscale the axes to full display all graphs.
will copy values from selected graphs to the clipboard in CSV (Comma Separated Values) format.
will let you copy graphs from another profile to the current dialog.
will close this dialog.
will save the currently displayed graph as an image or CSV data.
|
Tip |
|---|---|
|
You can see a list of useful keyboard shortcuts by right-clicking on the graph. |
Wireshark’s I/O Graph window counts or calculates summary statistics over intervals. If a packet or field does not occur in a given interval, the calculation might yield zero. This is particularly likely for very small intervals. For "counting" graphs (Packets, Bytes, Bits, COUNT FRAMES, COUNT FIELDS) zero values are omitted from scatter plots, but shown in line graphs and bar charts. For the summary statistics SUM, MAX, and AVG, values are always omitted if the Y field was not present in the interval. For LOAD graphs, values are omitted if no field’s time indicated that an event was was present in the interval. (Note for LOAD graphs that a response time can contribute to earlier intervals than the one containing the packet if the duration is longer than the interval.)
Lets you plot display filter field values over time.
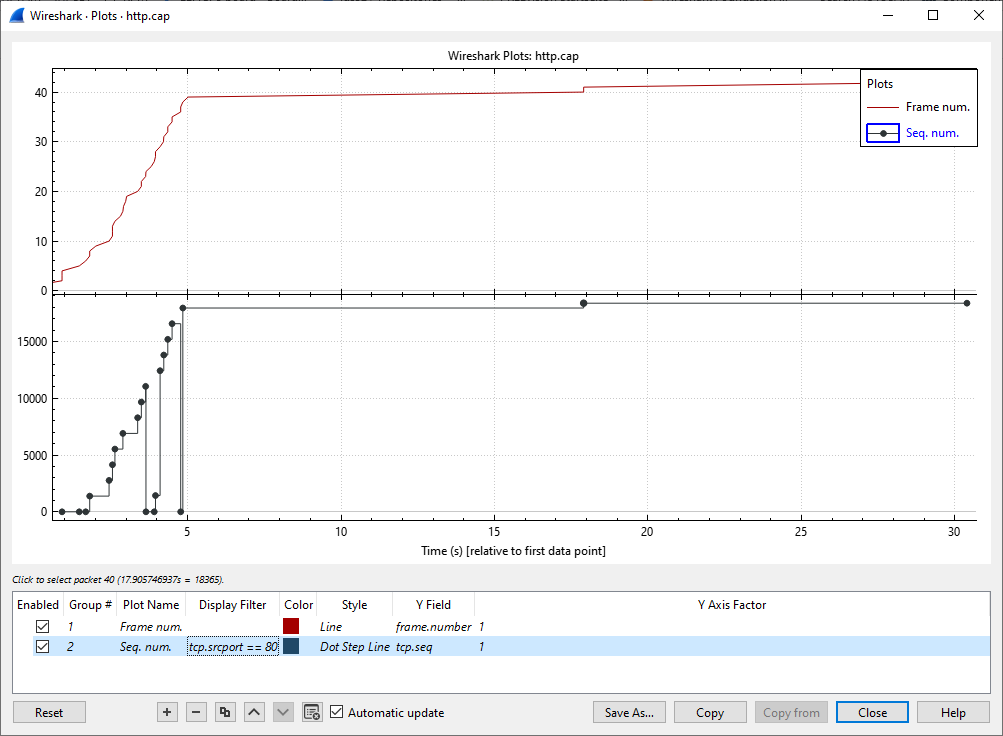
As shown above, this window contains a plot drawing area along with a customizable list of plots. Plots are saved in your current profile. Each plot shows the value of the specified field (see Y Field below) at each point in time. Hovering over the plot shows the packet number of the selected plot at any given time. Clicking on the plot takes you to the corresponding packet in the packet list. You can drag the plots around with a left click and zoom on a specific area with a right click.
Individual plots can be configured using the following options:
- Enabled
- Draw or don’t draw this plot.
- Group #
- If you don’t want all plots on the same graph, you can use this field to group them. Each one will be shown in a distinct graph.
- Plot Name
- The name of this plot.
- Display Filter
- Limits the plot to packets that match this filter.
- Color
- The color to use for plotting the plot’s lines or points.
- Style
- How to visually represent the plot’s data, e.g., by drawing a line, circle, plus, etc.
- Y Field
- The display filter field from which to extract values for the Y axis.
- Y Axis Factor
- Scale the Y axis for this plot by multiplying by a constant factor, e.g. to present multiple plots at a similar scale.
The plot as a whole can be configured using the controls under the plot list:
- Add a new plot.
- Remove the selected plot(s).
- Copy the selected plot(s).
- Move the selected plot(s) up in the list.
- Move the selected plot(s) down in the list.
- Remove all plots.
- Automatic updates
- Redraw each plot automatically.
- Time origin
- Switch between showing the time relative to first data point and time relative to capture start (not available in pcapng).
- Log scale
- Switch between linear and logarithmic Y axis.
- Crosshairs
- Enable/disable the crosshairs cursor.
- Top axis
- Show the axis scale also on top of the plot.
- Enable legend
- Show a plot legend.
- Multiple Value Axes
- Use multiple Y-axes for displaying data on different scales.
- Enable auto scroll
- Goes automatically to the last drawn points.
- Add Marker
- Add marker with x-axis of current mouse position.
- Move Marker
- Moves the selected marker to a specific x-axis position provided by the user.
- Show Pos Marker
- Show or hide the pos marker, you can then change it to the desired position by dragging and dropping it or left click.
- Show Differences
- User can show or hide the difference between markers.
- Show Data Point Marker
- User can show or hide data point marker.
- Delete Marker
- Delete the selected marker.
- Delete All
- Delete all markers, including the Pos Marker "P".
The main dialog buttons along the bottom let you do the following:
will take you to this section of the User’s Guide.
will autoscale the axes to fully display all plots.
will copy values from selected plot to the clipboard in CSV (Comma Separated Values) format.
will let you copy plots from another profile to the current dialog.
will close this dialog.
will save the currently displayed plot as an image.
|
Tip |
|---|---|
|
You can see a list of useful keyboard shortcuts by right-clicking on the plot. |
The service response time is the time between a request and the corresponding response. This information is available for many protocols, including the following:
- AFP
- CAMEL
- DCE-RPC
- Diameter
- Fibre Channel
- GTP
- GTPv2
- H.225 RAS
- LDAP
- MEGACO
- MGCP
- NCP
- ONC-RPC
- PFCP
- RADIUS
- SCSI
- SMB
- SMB2
- SNMP
As an example, the SMB2 service response time is described below in more detail. The other Service Response Time windows will show statistics specific to their respective protocols, but will offer the same menu options.
This window shows the number of transactions for each SMB2 opcode present in the capture file along with various response time statistics. Right-clicking on a row will let you apply or prepare filters for, search for, or colorize a specific opcode. You can also copy all of the response time information or save it in a variety of formats.
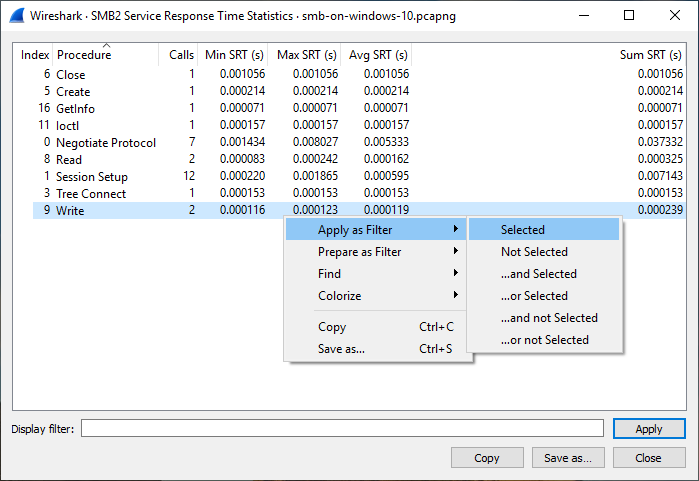
You can optionally apply a display filter in order to limit the statistics to a specific set of packets.
The main dialog buttons along the bottom let you do the following:
The button will copy the response time information as text.
will save the response time information in various formats.
will close this dialog.
This window allows to write a filter and get a distribution of the values matching this filter, with their respective occurences and percentages. Additionally, an Entropy value (Normalized Shannon) is also computed. Only String, Integer, and IP addresses types are currently supported for the filter.
You can launch it directly from the Statistics menu, then you can type a filter in the edit box, or by a right-click on some field found in the packet details tree, which will display the results for the given clicked field.
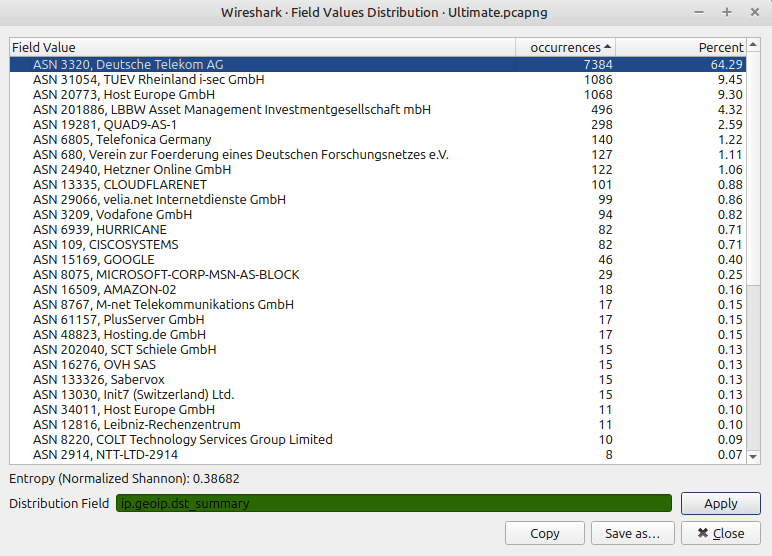
|
Note |
|---|---|
|
A high Entropy value (between 0.9 and 1) indicates that values are rather evenly distributed, while a low value (0 - 0.5) on the contrary indicates one or more dominant values. |
|
Tip |
|---|---|
|
You can use this feature to regularly baseline your traffic, for example filters such as |
The Dynamic Host Configuration Protocol (DHCP) is an option of the Bootstrap Protocol (BOOTP). It dynamically assigns IP addresses and other parameters to a DHCP client. The DHCP (BOOTP) Statistics window displays a table over the number of occurrences of a DHCP message type. The user can filter, copy or save the data into a file.
The NetPerfMeter Protocol (NPMP) is the control and data transfer protocol of NetPerfMeter, the transport protocol performance testing tool. It transmits data streams over TCP, SCTP, UDP and DCCP with given parameters, such as frame rate, frame size, saturated flows, etc.
With these statistics you can:
- Observed number of messages and bytes per message type.
- The share of messages and bytes for each message type.
- See the first and last occurrence of each message type.
- See the interval between first and last occurrence of each message type (if there are at least 2 messages of the corresponding type).
- See the message and byte rate within the interval for each message type (if there are at least 2 messages of the corresponding type).
See NetPerfMeter – A TCP/MPTCP/UDP/SCTP/DCCP Network Performance Meter Tool and Section 6.3 of Evaluation and Optimisation of Multi-Path Transport using the Stream Control Transmission Protocol for more details about NetPerfMeter and the NetPerfMeter Protocol.
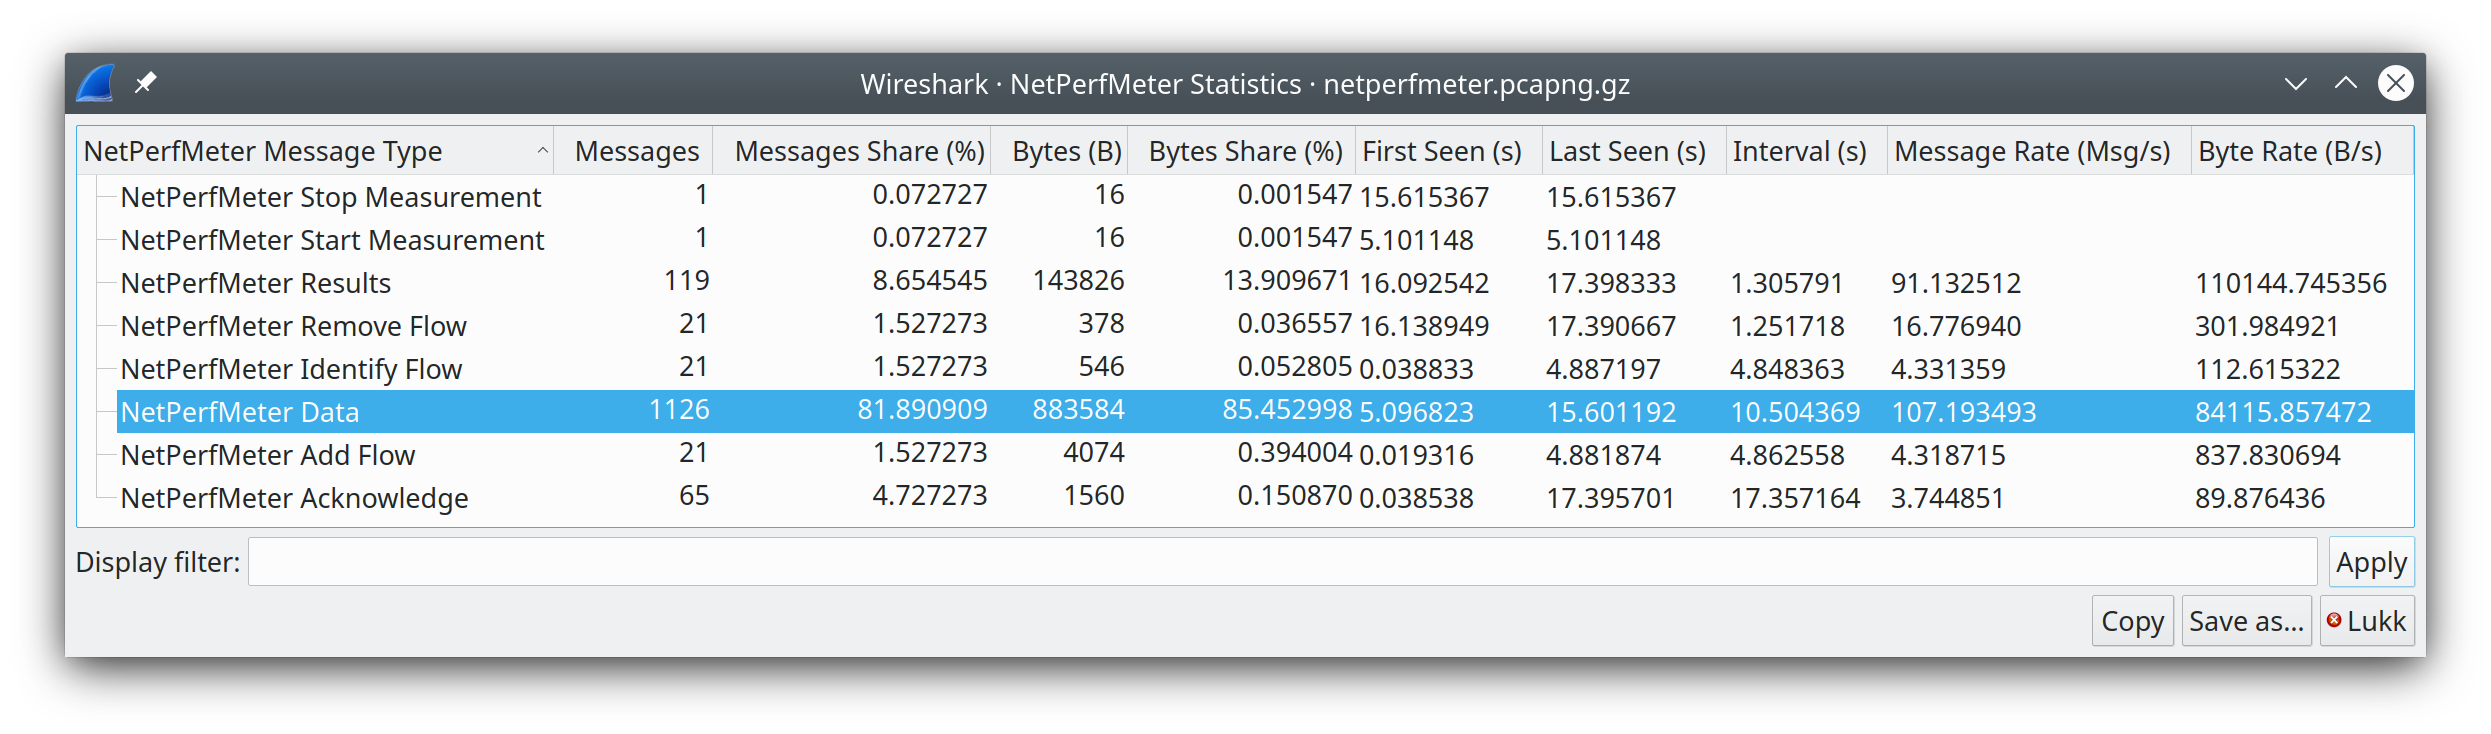
Open Network Computing (ONC) Remote Procedure Call (RPC) uses TCP or UDP protocols to map a program number to a specific port on a remote machine and call a required service at that port. The ONC-RPC Programs window shows the description for captured program calls, such as program name, its number, version, and other data.
The 29West technology now refers to Ultra-Low Latency Messaging (ULLM) technology. It allows sending and receiving a high number of messages per second with microsecond delivery times for zero-latency data delivery.
The → shows:
The |
|
The |
|
The |
Each stream is provided by Endpoints, Messages, Bytes, and the First and Last Frame statistics. |
The |
The LBT-RM Transport Statistics window shows the Sources and Receivers sequence numbers for transport and other data. |
The |
The LBT-Ru Transport Statistics window shows the Sources and Receivers sequence numbers for transport and other data. |
The Access Node Control Protocol (ANCP) is an TCP based protocol, which operates between an Access Node and Network Access Server. The Wireshark ANCP dissector supports the listed below messages:
- Adjacency Message
- Topology Discovery Extensions, such as Port-Up and Port-Down Messages
- Operation And Maintenance (OAM) Extension, such as Port Management Message.
The ANCP window shows the related statistical data. The user can filter, copy or save the data into a file.
Building Automation and Control Networks (BACnet) is a communication protocol which provides control for various building automated facilities, such as light control, fire alarm control, and others. Wireshark provides the BACnet statistics which is a packet counter. You can sort packets by instance ID, IP address, object type or service.
Collectd is a system statistics collection daemon. It collects various statistics from your system and converts it for the network use. The Collectd statistics window shows counts for values, which split into type, plugin, and host as well as total packets counter. You can filter, copy or save the data to a file.
The Domain Name System (DNS) associates different information, such as IP addresses, with domain names. DNS returns different codes, request-response and counters for various aggregations. The DNS statistics window enlists a total count of DNS messages, which are divided into groups by request types (opcodes), response code (rcode), query type, and others.
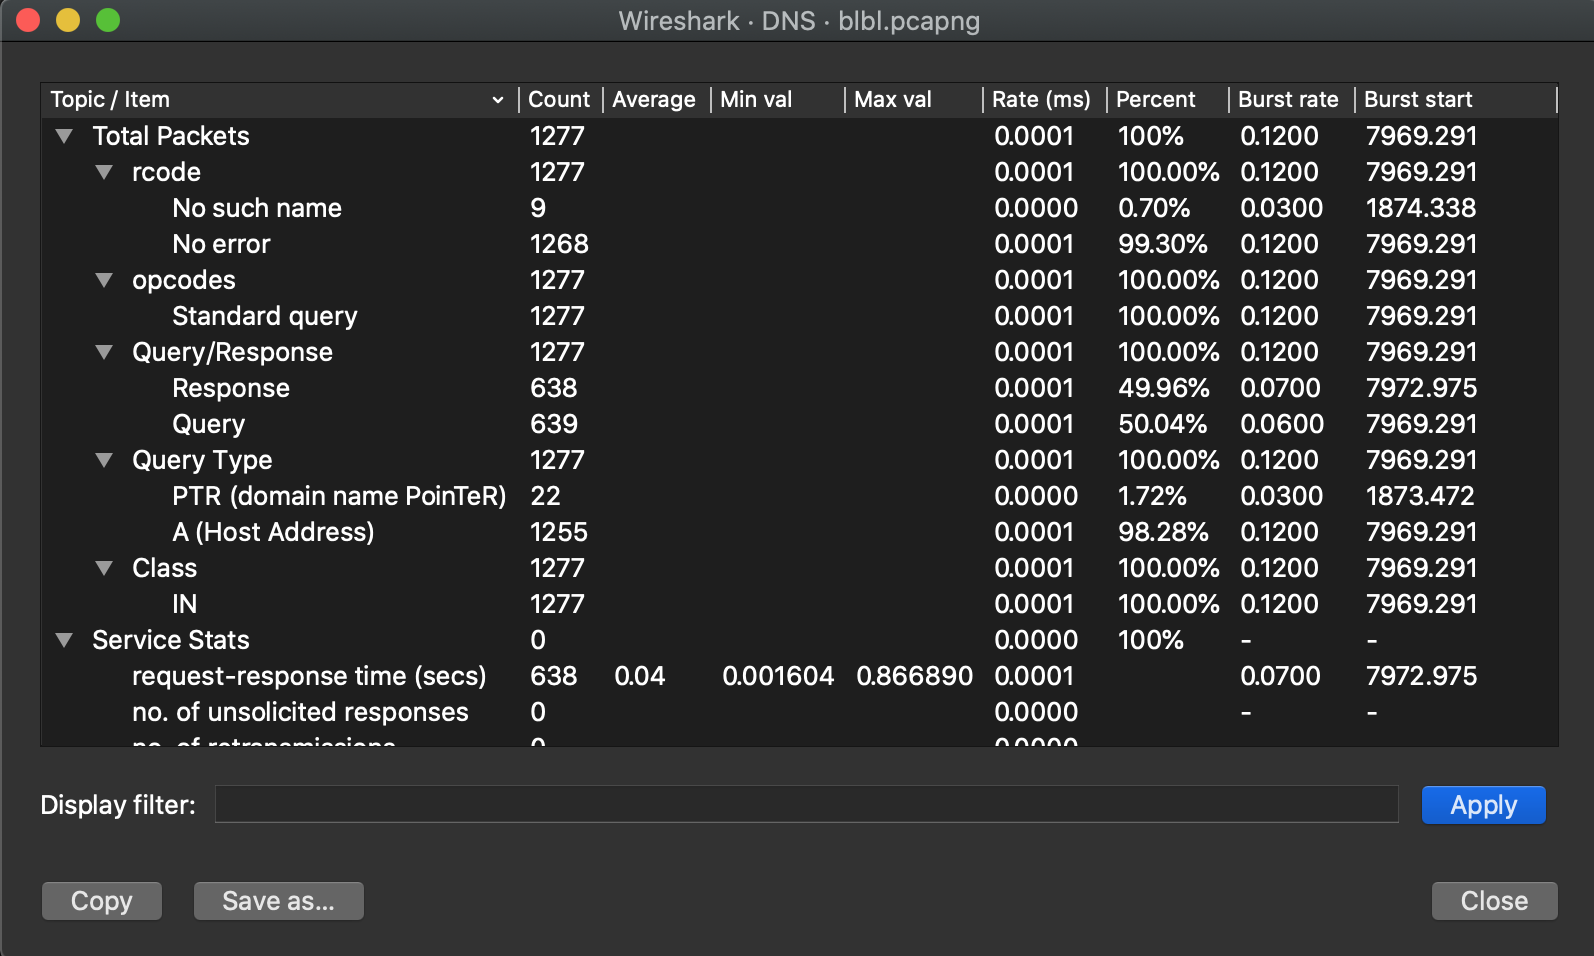
You might find these statistics useful for quickly examining the health of a DNS service or other investigations. See the few possible scenarios below:
- The DNS server might have issues if you see that DNS queries have a long request-response time or, if there are too many unanswered queries.
- DNS requests with abnormally large requests and responses might be indicative of DNS tunneling or command and control traffic.
- The order of magnitude more DNS responses than requests and the responses are very large might indicate that the target is being attacked with a DNS-based DDoS.
You can filter, copy or save the data into a file.
The Flow Graph window shows connections between hosts. It displays the packet time, direction, ports and comments for each captured connection. You can filter all connections by ICMP Flows, ICMPv6 Flows, UIM Flows and TCP Flows. Flow Graph window is used for showing multiple different topics. Based on it, it offers different controls.
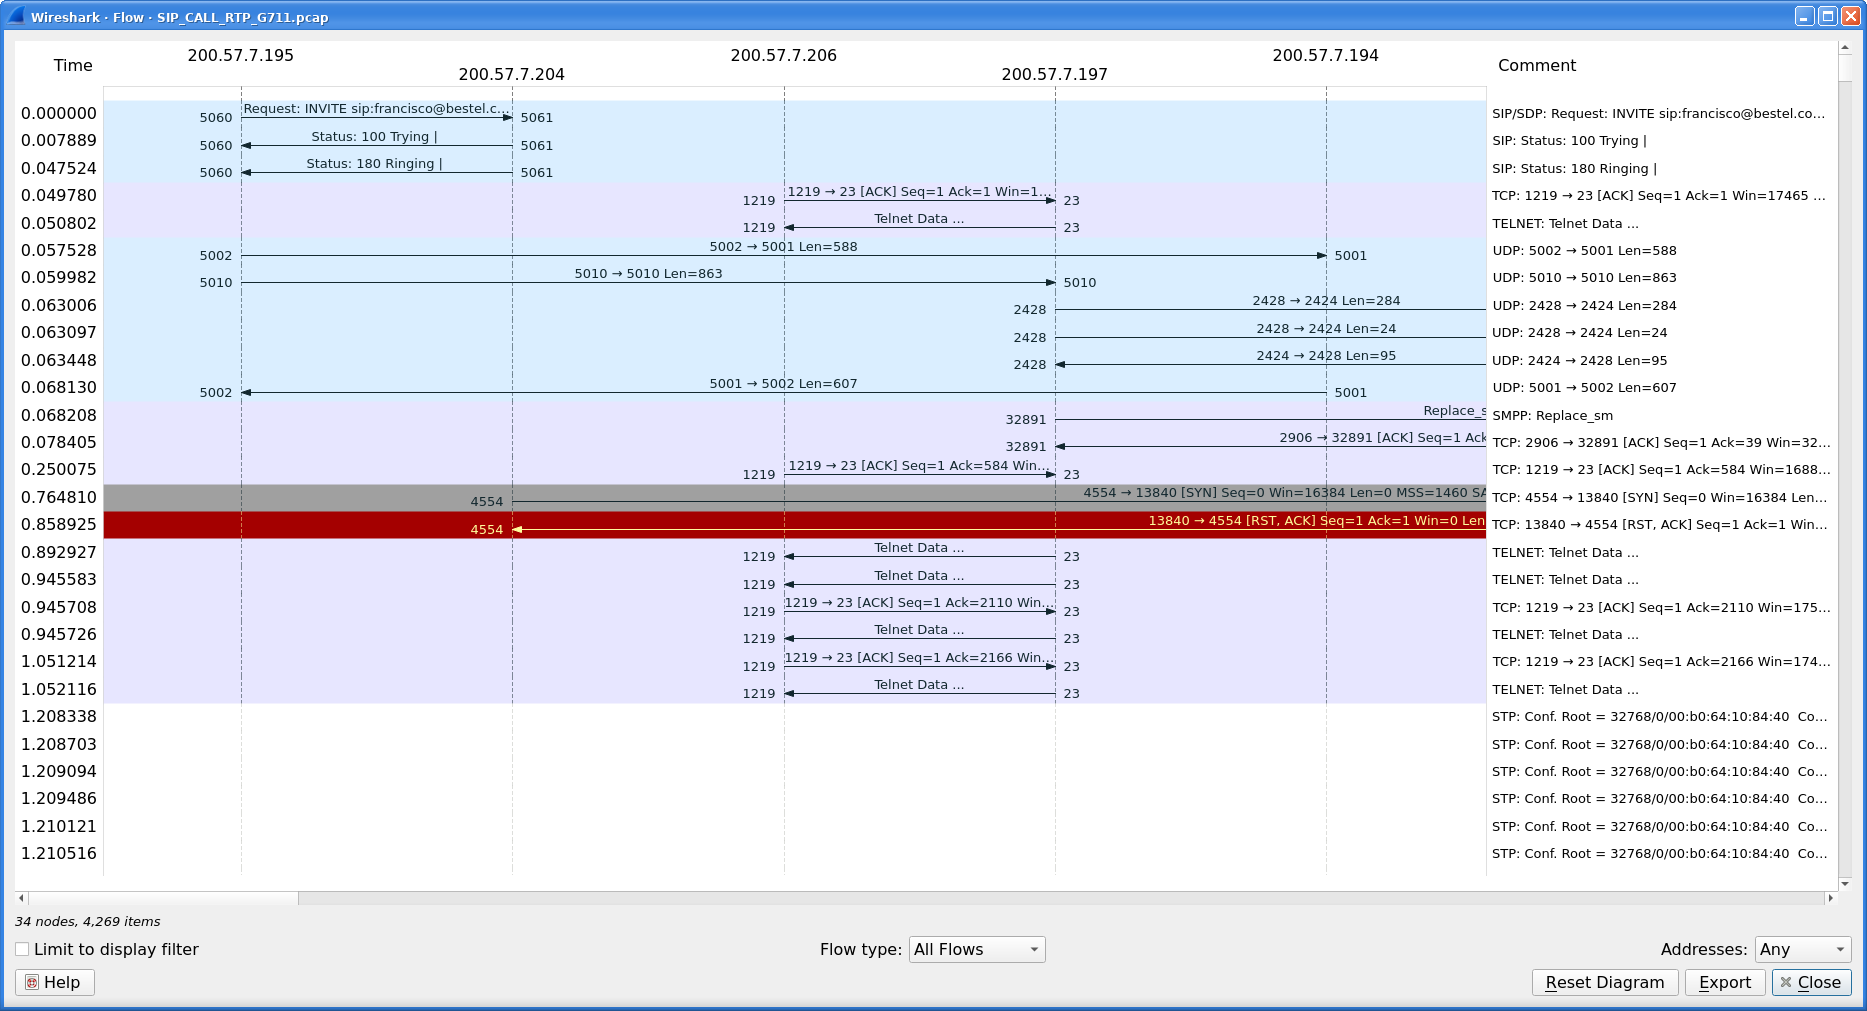
Each vertical line represents the specific host, which you can see in the top of the window.
The numbers in each row at the very left of the window represent the time packet. You can change the time format in the → . If you change the time format, you must relaunch the Flow Graph window to observe the time in a new format.
The numbers at the both ends of each arrow between hosts represent the port numbers.
Left-click a row to select a corresponding packet in the packet list.
Right-click on the graph for additional options, such as selecting the previous, current, or next packet in the packet list. This menu also contains shortcuts for moving the diagram.
Available controls:
- filters calls just to ones matching display filter. When display filter is active before window is opened, checkbox is checked.
- allows limit type of protocol flows should be based on.
- allows switch shown addresses in diagram.
- resets view position and zoom to default state.
- allows export diagram as image in multiple different formats (PDF, PNG, BMP, JPEG and ASCII (diagram is stored with ASCII characters only)).
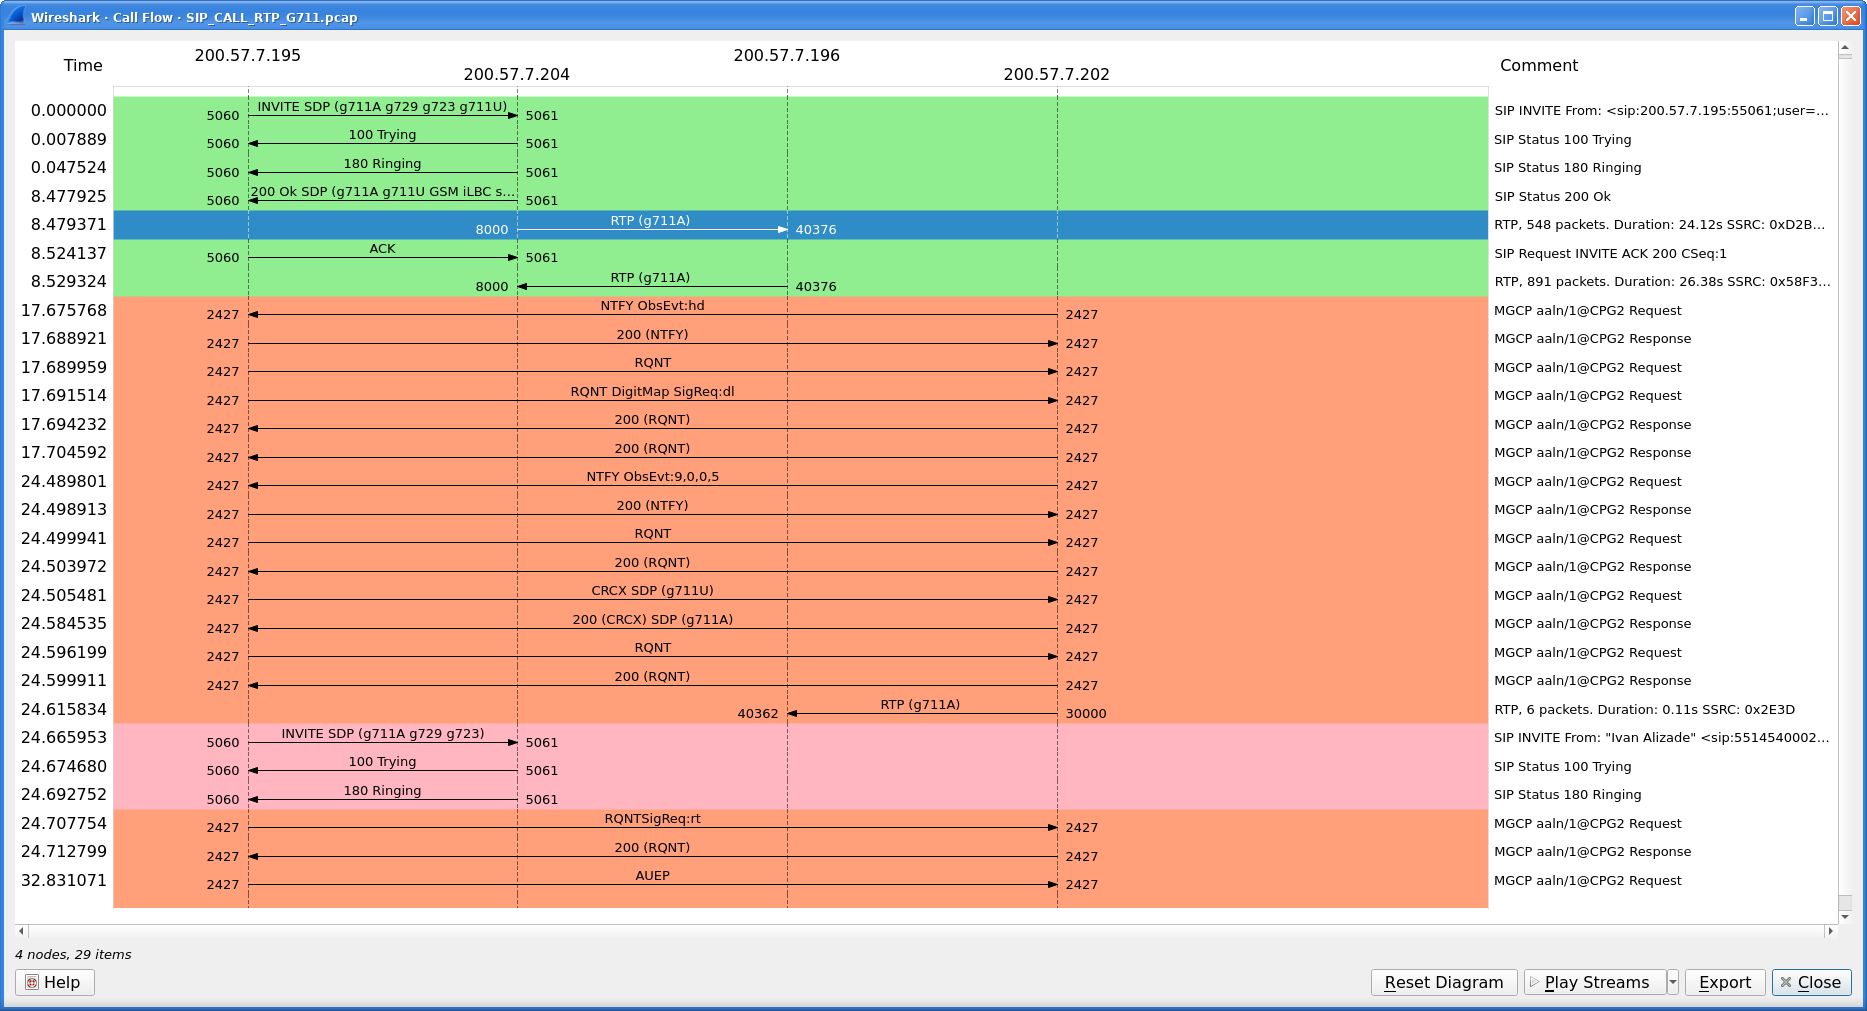
Additional shortcuts available for VoIP calls:
-
On selected RTP stream
- S - Selects the stream in RTP Streams window (if not opened, it opens it and put it on background).
- D - Deselects the stream in RTP Streams window (if not opened, it opens it and put it on background).
Additional controls available for VoIP calls:
- resets view position and zoom to default state.
- sends selected RTP stream to playlist of RTP Player window.
- allows to export diagram as image in multiple different formats (PDF, PNG, BMP, JPEG and ASCII (diagram is stored with ASCII characters only)).
Highway Addressable Remote Transducer over IP (HART-IP) is an application layer protocol. It sends and receives digital information between smart devices and control or monitoring systems. The HART-IP statistics window shows the counter for response, request, publish and error packets. You can filter, copy or save the data to a file.
Hpfeeds protocol provides a lightweight authenticated publishing and subscription. It supports arbitrary binary payloads which can be separated into different channels. HPFEEDS statistics window shows a counter for payload size per channel and opcodes. You can filter, copy or save the data to a file.
HTTP request and response statistics based on the server address and host.
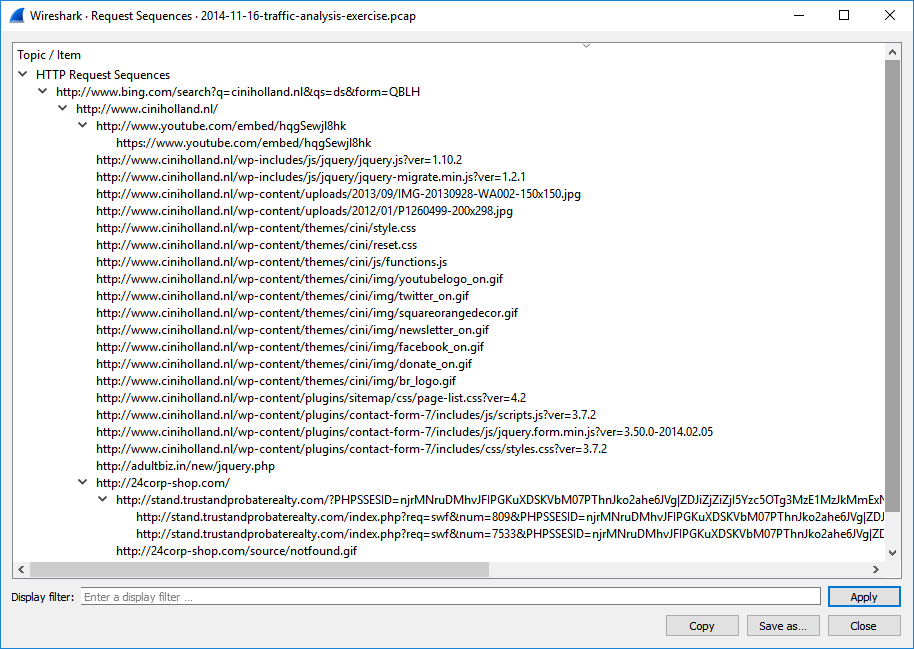
Hypertext Transfer Protocol version 2 (HTTP/2) allows multiplexing various HTTP requests and responses over a single connection. It uses a binary encoding which is consisting of frames. The HTTP/2 statistics window shows the total number of HTTP/2 frames and also provides a breakdown per frame types, such as HEADERS, DATA, and others.
As HTTP/2 traffic is typically encrypted with TLS, you must configure decryption to observe HTTP/2 traffic. For more details, see the TLS wiki page.
Sametime is a protocol for the IBM Sametime software. The Sametime statistics window shows the counter for message type, send type, and user status.
Show different visual representations of the TCP streams in a capture.
- Time Sequence (Stevens)
- This is a simple graph of the TCP sequence number over time, similar to the ones used in Richard Stevens’ “TCP/IP Illustrated” series of books.
- Time Sequence (tcptrace)
- Shows TCP metrics similar to the tcptrace utility, including forward segments, acknowledgements, selective acknowledgements, reverse window sizes, and zero windows.
- Throughput
- Average throughput and goodput.
- Round Trip Time
-
Round trip time vs time or sequence number. RTT is based on the acknowledgment timestamp corresponding to a particular segment. The sampling method selects which segments are taken into account and how the RTT is computed:
-
All Data Packets, all segments carrying data are computed, and when present, SACK is ignored. -
All Data Packets w/ SACK, all segments carrying data are computed, the RTT value is based on SACK if present. -
Data Packets matching RTT, only segments with a corresponding RTT value in the packet list are computed. -
Data Packets matching Karn RTT, only segments with a corresponding RTT value in the packet list are computed, ambiguous ACKs following Karn’s definition are excluded.
-
- Window Scaling
- Window size and outstanding bytes.
The UDP Multicast Streams window shows statistics for all UDP multicast streams. It includes source addresses and ports, destination addresses and ports, packets counter and other data. You can specify the burst interval, the alarm limits and output speeds. To apply new settings, press .
With these statistics you can:
-
Measure the burst size for a video stream. The
Burst measurement intervalandBurst alarm thresholdsettings are used by the sliding window algorithm to compute how many times the threshold was hit, and is shown inBurst Alarms. The threshold may be hit several times during a same window. -
Measure of the output buffer size limit, that no packet drop will occur. The
Stream empty speedandBuffer alarm thresholdsettings are used by the Leaky bucket algorithm to compute how many times the buffer was filled while a client was at the same time emptying it at a given, constant speed. When filled, the maximum seen is stored inMax BufferandBuffer Alarmsis incremented (note that it won’t be incremented again until the buffer value first goes below the threshold, hence a high value of alarms when the chosen threshold is near the minimum necessary one). TheTotal empty speedplays the same role when considering all the flows added. - Detect the packet loss inside the MPEG2 video stream.
|
Note |
|---|---|
|
While this dialog helps diagnosing bursts of traffic, or inappropriate small buffers, it doesn’t bring information on traffic drops or buffer starvations. You can use the Section 8.8, “The “I/O Graphs” Window” to seek such behaviors. |
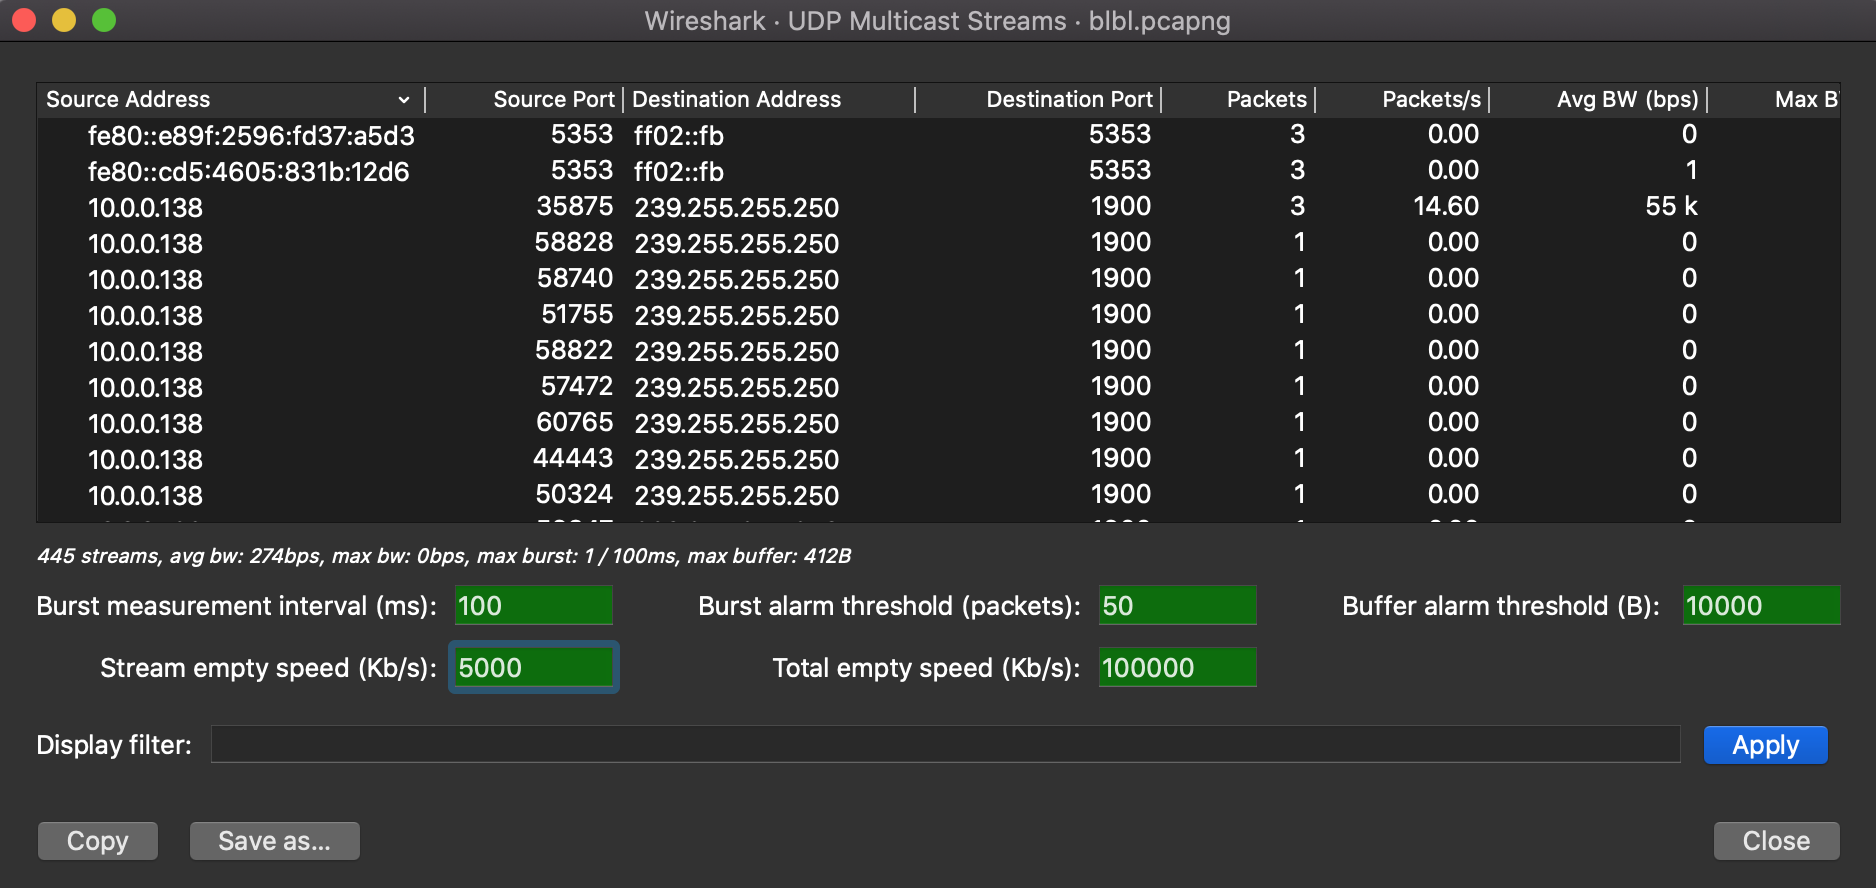
The Reliable Server Pooling (RSerPool) windows show statistics for the different protocols of Reliable Server Pooling (RSerPool):
- Aggregate Server Access Protocol (ASAP)
- Endpoint Handlespace Redundancy Protocol (ENRP)
Furthermore, statistics for application protocols provided by RSPLIB are provided as well:
- Component Status Protocol (CSP)
- CalcApp Protocol
- Fractal Generator Protocol
- Ping Pong Protocol
- Scripting Service Protocol (SSP)
With these statistics you can:
- Observed number of messages and bytes per message type.
- The share of messages and bytes for each message type.
- See the first and last occurrence of each message type.
- See the interval between first and last occurrence of each message type (if there are at least 2 messages of the corresponding type).
- See the message and byte rate within the interval for each message type (if there are at least 2 messages of the corresponding type).
See Thomas Dreibholz’s Reliable Server Pooling (RSerPool) Page and Chapter 3 of Reliable Server Pooling – Evaluation, Optimization and Extension of a Novel IETF Architecture for more details about RSerPool and its protocols.
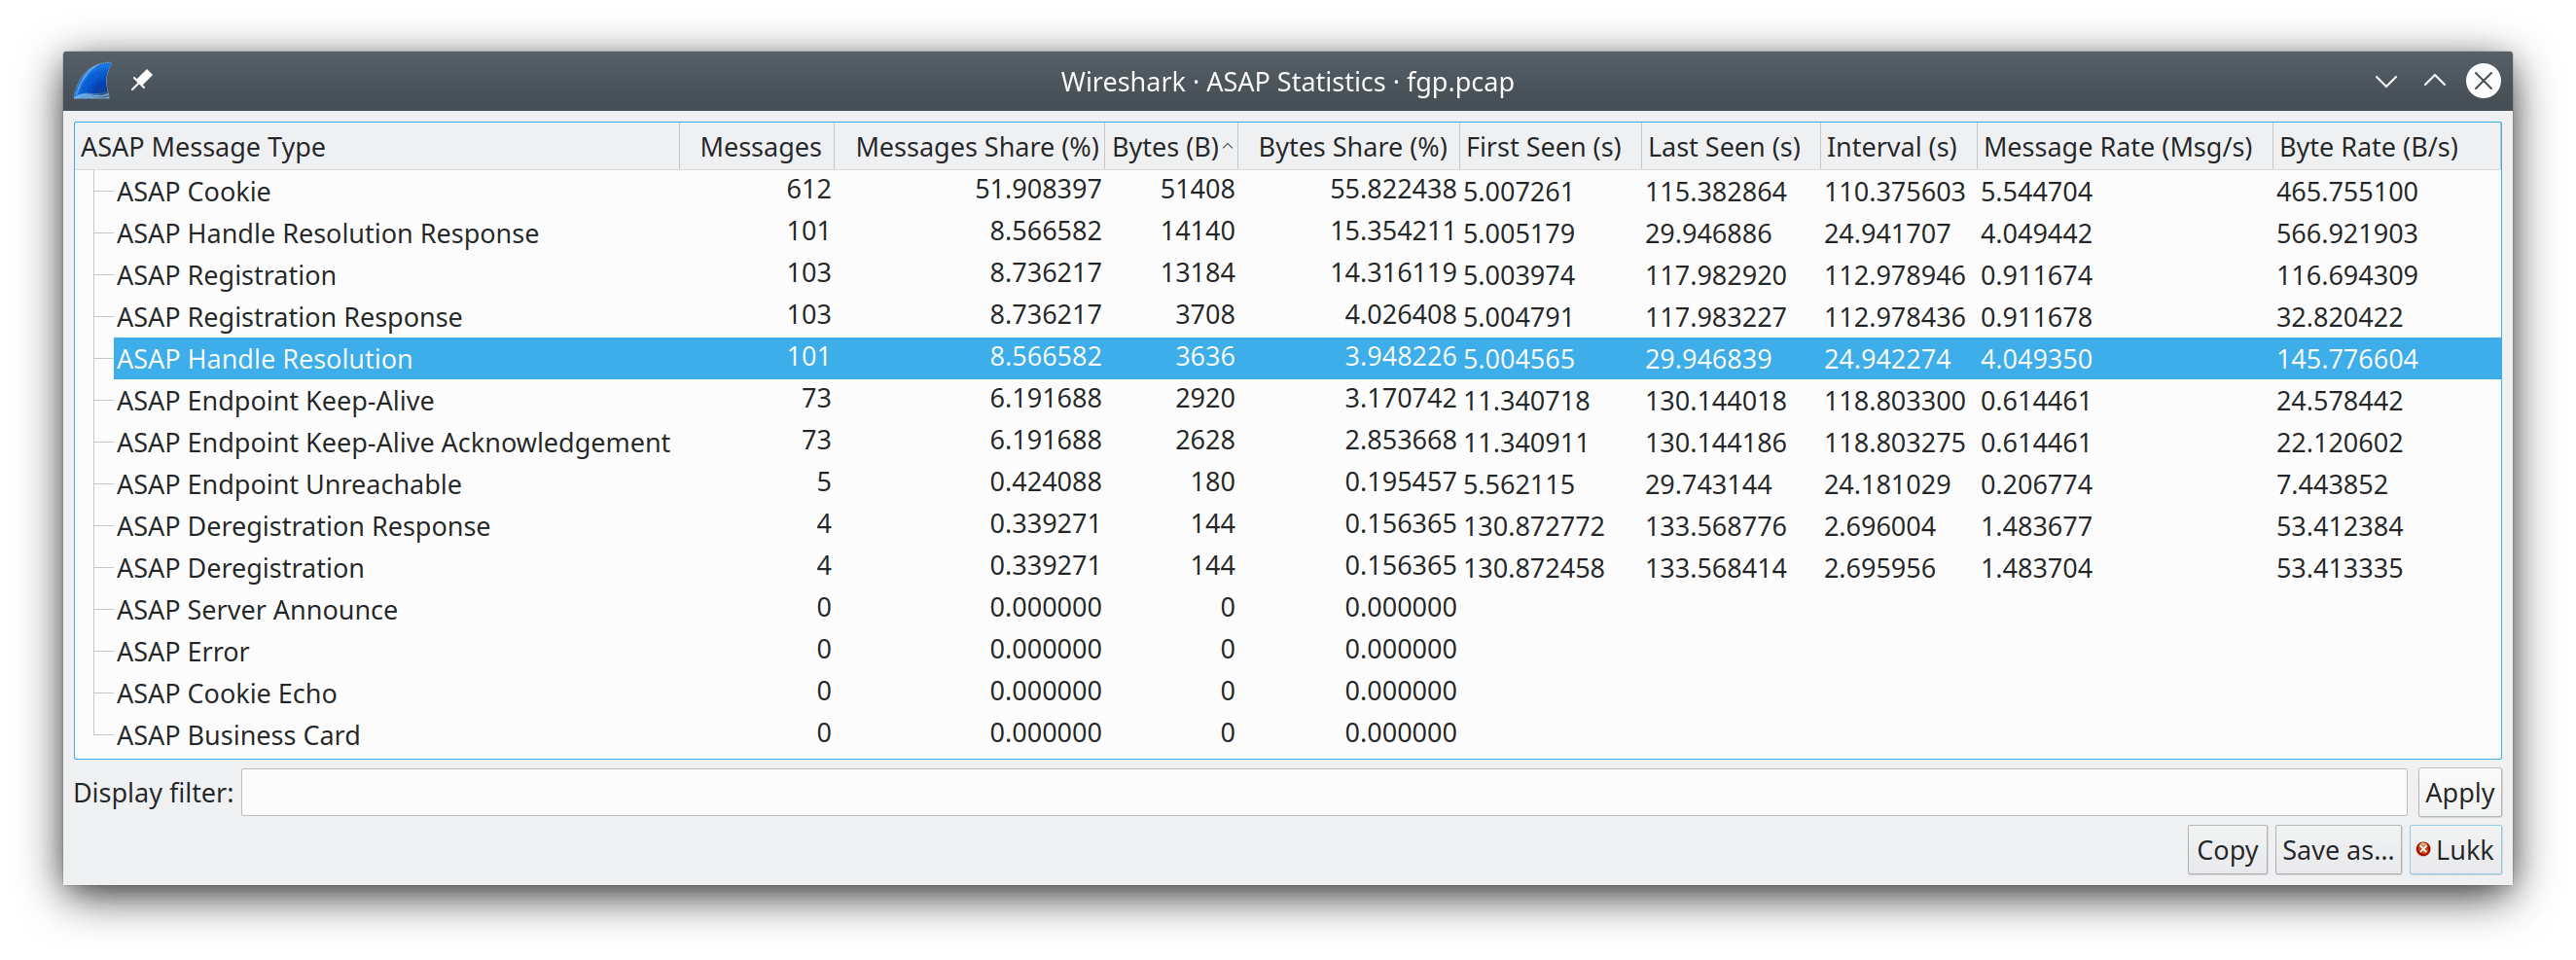
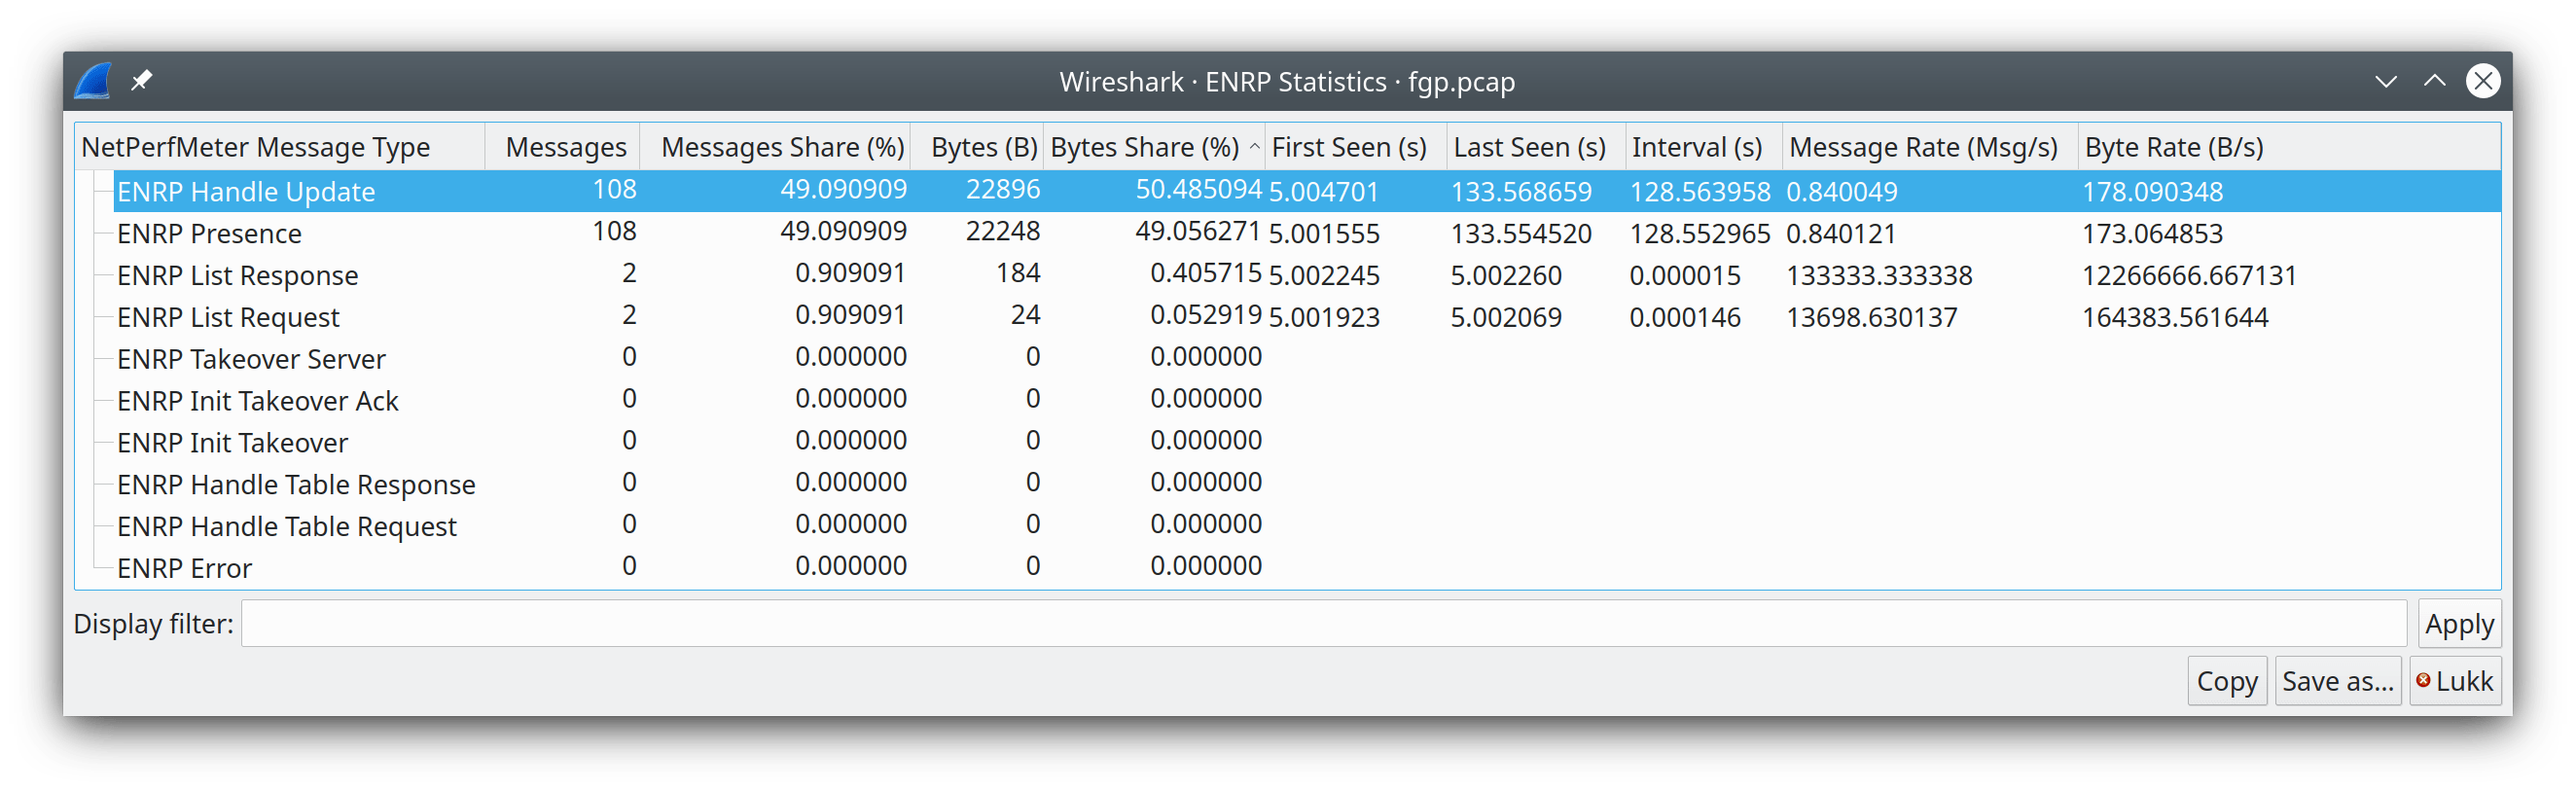
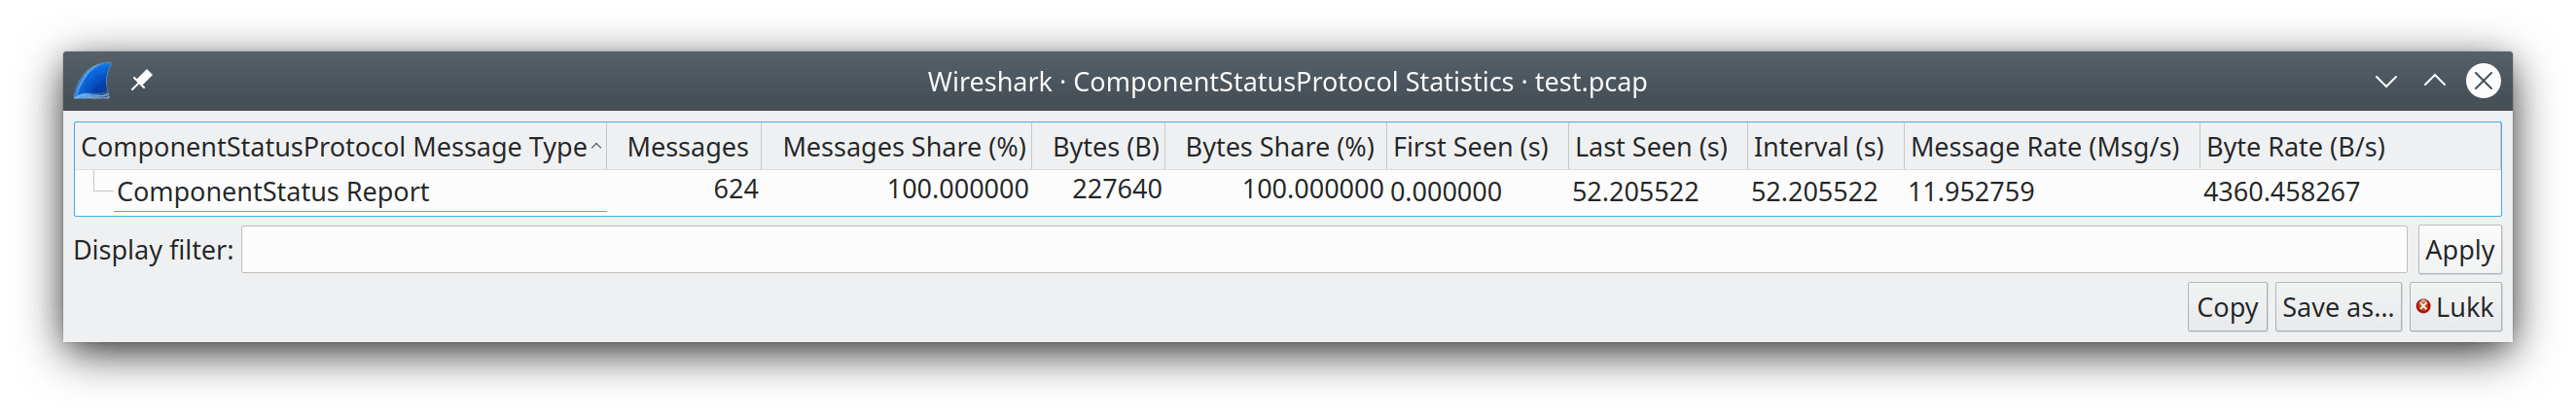
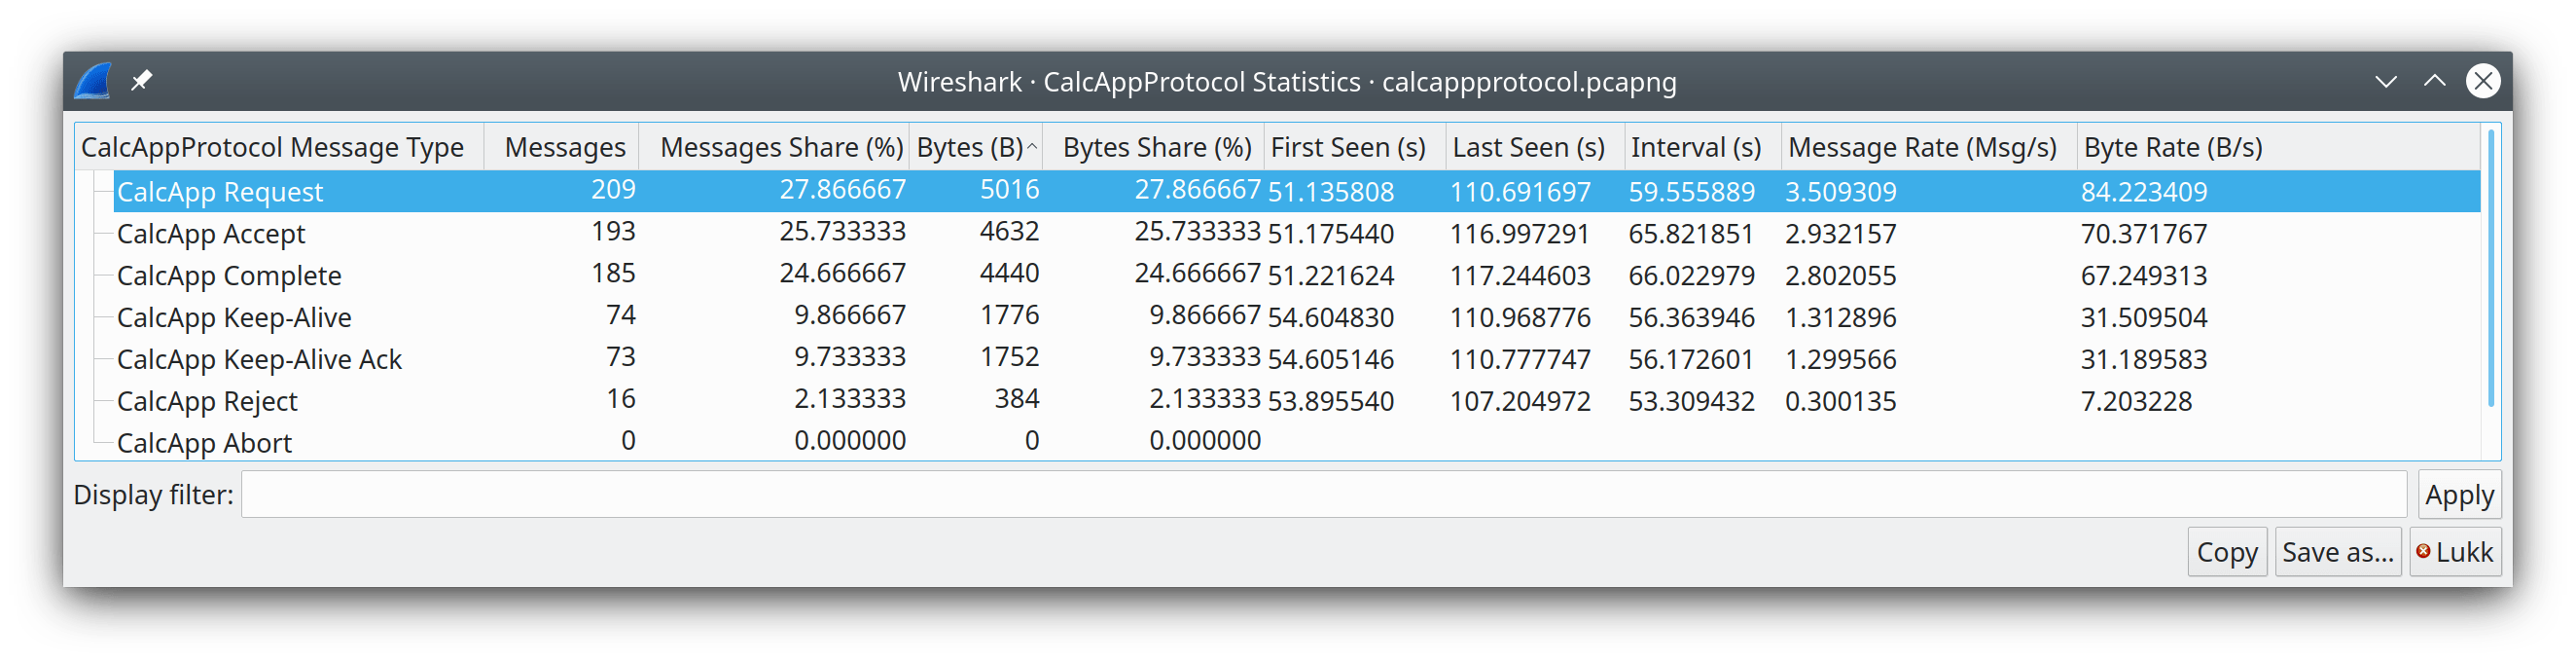
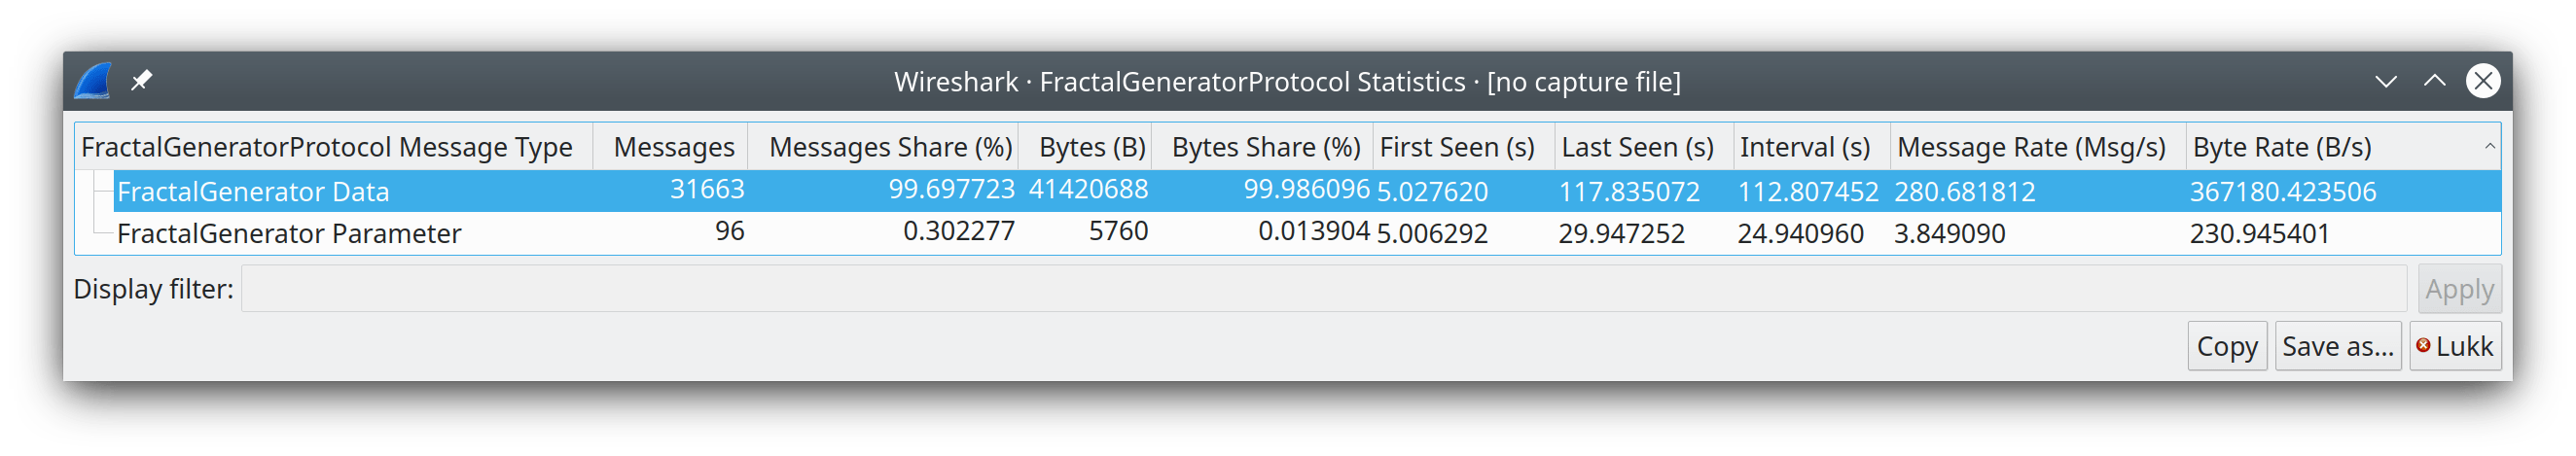
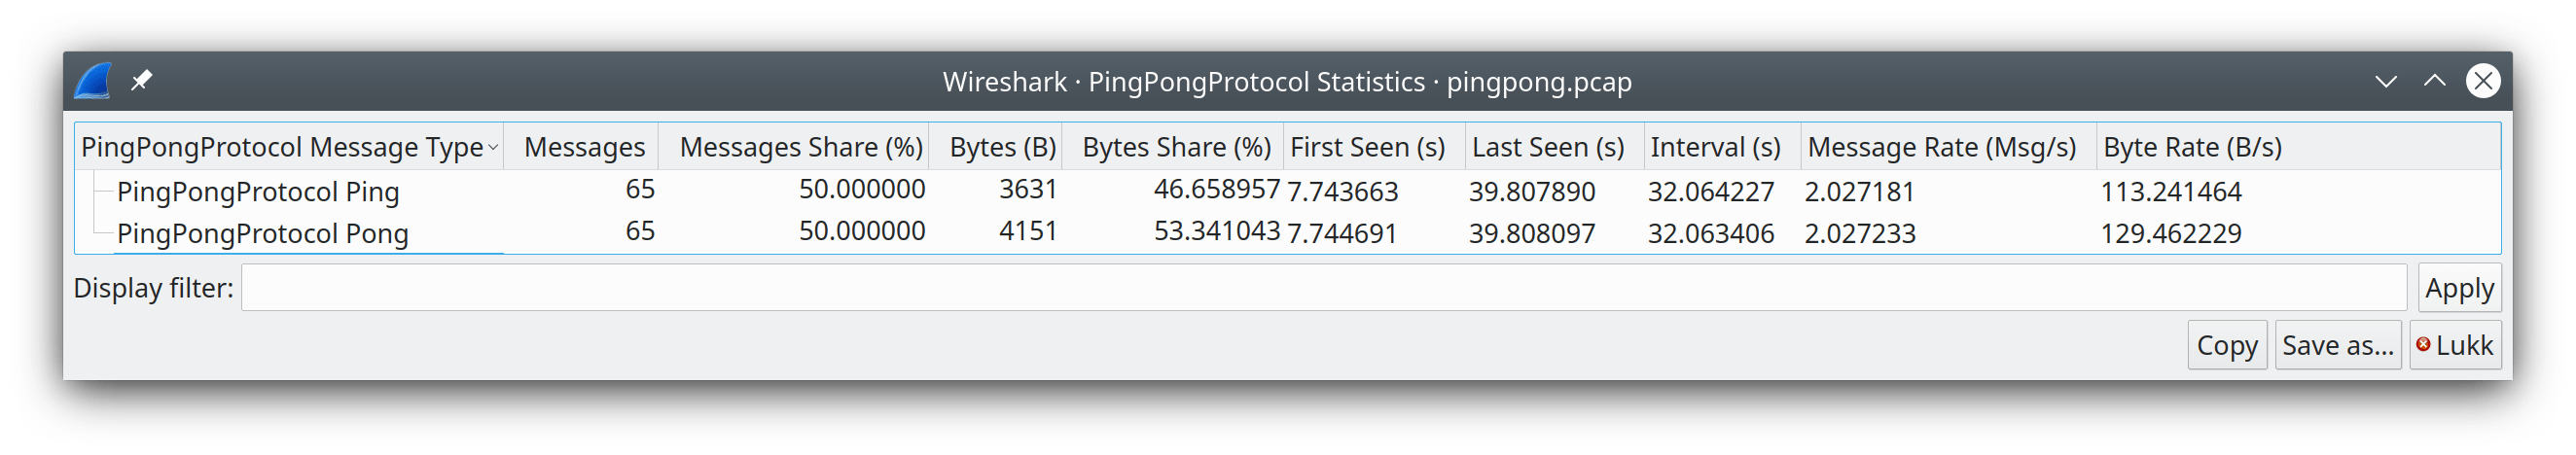
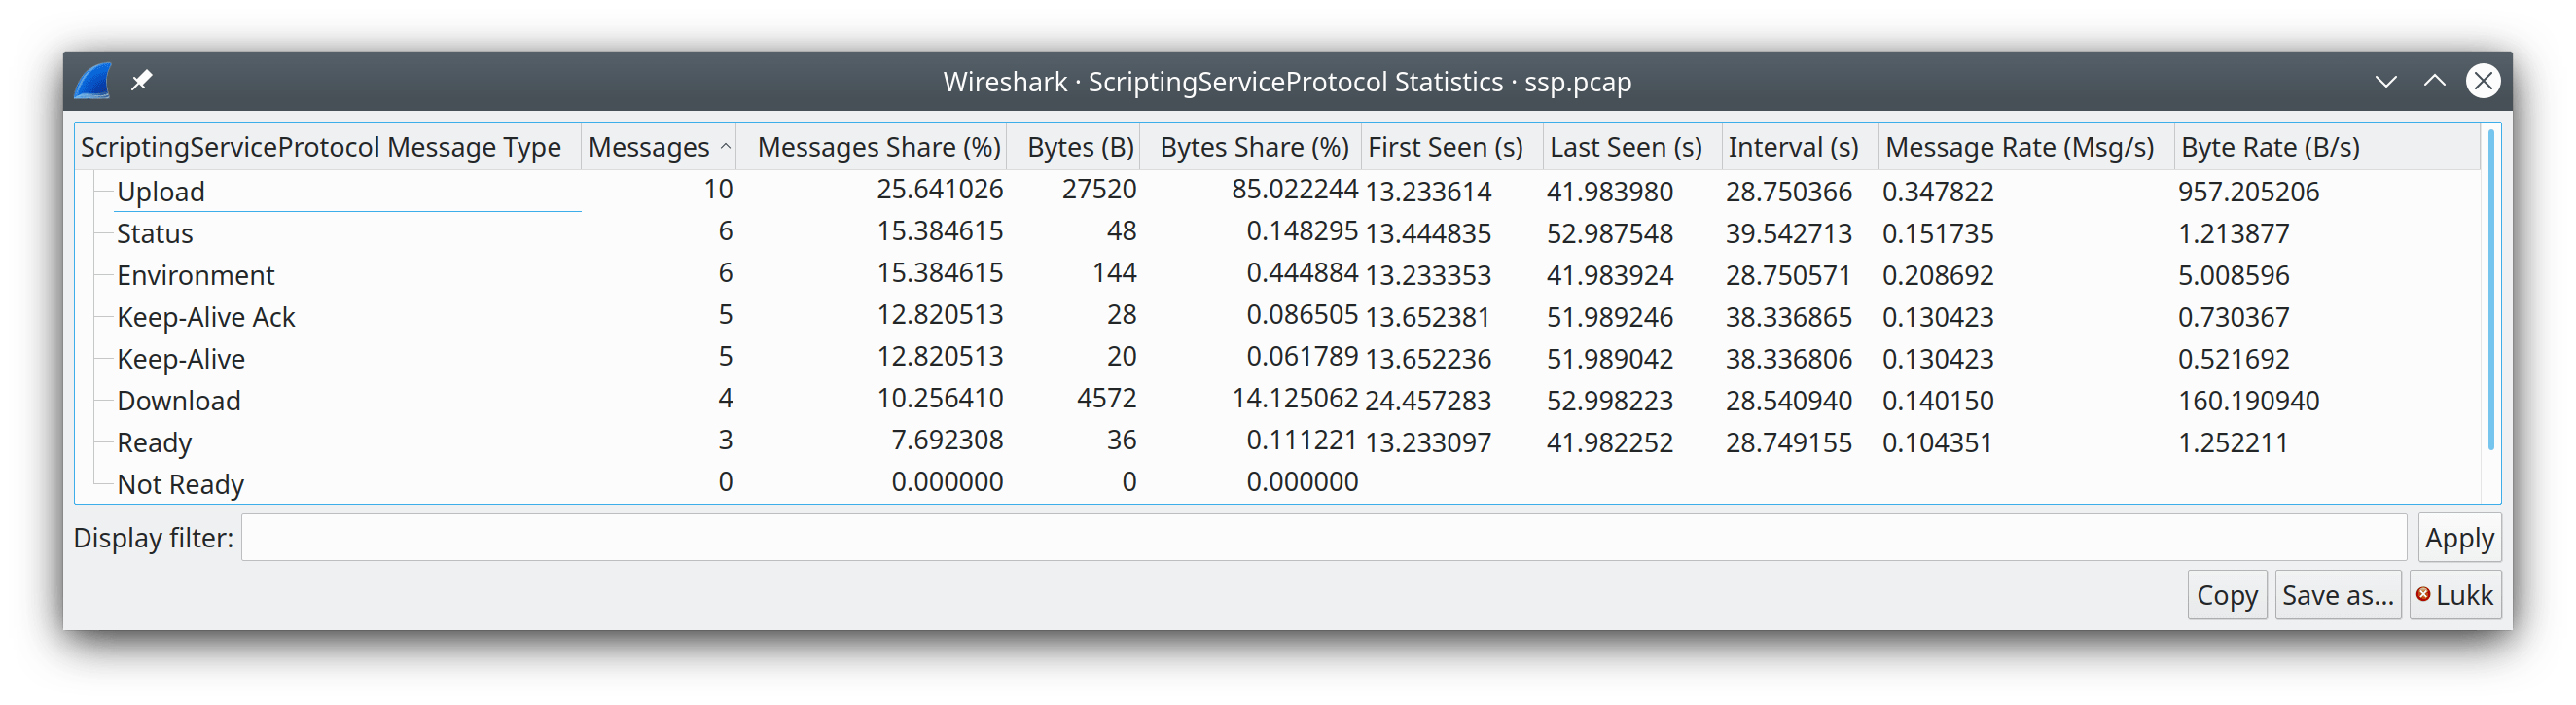
In F5 Networks, TMM stands for Traffic Management Microkernel. It processes all load-balanced traffic on the BIG-IP system.
The F5 statistics menu shows packet and byte counts for both Virtual Server Distribution and tmm Distribution submenus.
Each Virtual Server Distribution window contains the statistics for the following data:
- A line for each named virtual server name.
- A line for traffic with a flow ID and no virtual server name.
- A line for traffic without a flow ID.
Each tmm Distribution window contains the statistics for the following data:
-
A line for each tmm, which contains:
-
A line for each ingress and egress (should add to tmm total), which contains:
- Traffic with a virtual server name.
- Traffic with a flow ID and no virtual server name.
- Traffic without a flow ID.
-
Internet Protocol version 4 (IPv4) is a core protocol for the internet layer. It uses 32-bit addresses and allows packets routing from one source host to the next one.
The → menu provides the packet counter by submenus:
-
All Addresses. Divides data by IP address. -
Destination and Ports. Divides data by IP address, and further by IP protocol type, such as TCP, UDP, and others. It also shows port number. -
IP Protocol Types. Divides data by IP protocol type. -
Source TTLs. Divides data by source IP address and then by TTL. Also shows the destination IP address for each TTL value. -
Source and Destination addresses. Divides data by source and destination IP address.
You can see similar statistics in the → and → menus.
Internet Protocol version 6 (IPv6) is a core protocol for the internet layer. It uses 128-bit addresses and routes internet traffic. Similar to Section 8.30, “IPv4 Statistics”, the → menu shows the packet counter in each submenu.
Table of Contents
- 9.1. Introduction
- 9.2. Playing VoIP Calls
- 9.3. VoIP Calls Window
- 9.4. ANSI
- 9.5. GSM Windows
- 9.6. IAX2 Stream Analysis Window
- 9.7. ISUP Messages Window
- 9.8. 3GPP Uu
- 9.9. MTP3 Windows
- 9.10. Osmux Windows
- 9.11. RTP
- 9.12. RTSP Window
- 9.13. SCTP Windows
- 9.14. SMPP Operations Window
- 9.15. UCP Messages Window
- 9.16. F1AP Messages Window
- 9.17. NGAP Messages Window
- 9.18. E2AP Messages Window
- 9.19. H.225 Window
- 9.20. SIP Flows Window
- 9.21. SIP Statistics Window
- 9.22. WAP-WSP Packet Counter Window
Wireshark provides a wide range of telephony related network statistics which can be accessed via the menu.
These statistics range from specific signaling protocols, to analysis of signaling and media flows. If encoded in a compatible encoding the media flow can even be played.
The protocol specific statistics windows display detailed information of specific protocols and might be described in a later version of this document.
Some of these statistics are described at the https://wiki.wireshark.org/Statistics pages.
The tool for playing VoIP calls is called RTP Player. It shows RTP streams and its waveforms, allows play stream and export it as audio or payload to file. Its capabilities depend on supported codecs.
RTP Player is able to play any codec supported by an installed plugin. The codecs supported by RTP Player depend on the version of Wireshark you’re using. The official builds contain all of the plugins maintained by the Wireshark developers, but custom/distribution builds might not include some of those codecs. To check your Wireshark installation’s installed codec plugins, do the following:
- Open → window
- Select the tab
- In the menu on the top-right, select codec
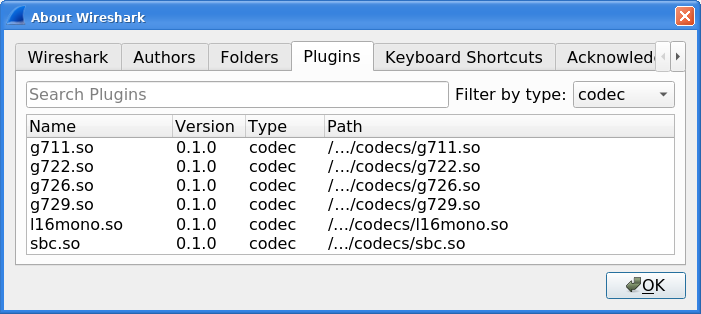
Wireshark can be used for RTP stream analysis. User can select one or more streams which can be played later. RTP Player window maintains playlist (list of RTP streams) for this purpose.
Playlist is created empty when RTP Player window is opened and destroyed when window is closed. RTP Player window can be opened on background when not needed and put to front later. During its live, playlist is maintained.
When RTP Player window is opened, playlist can be modified from other tools (Wireshark windows) in three ways:
- button → clears existing playlist and adds streams selected in the tool.
- button → adds streams selected in the tool to playlist. Duplicated streams are not inserted again.
- button → removes streams selected in the tool from playlist, if they are in the playlist.
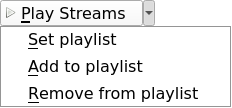
button can be clicked directly and opens RTP Player window directly with action. All actions can be selected with the small down arrow next to the button.
When the playlist is empty, there is no difference between and . When the RTP Player window is not opened, all three actions above open it.
is useful e.g. in case user selected all RTP streams and wants to remove RTP streams from specific calls found with .
Tools below can be used to maintain content of playlist, they contain button. You can use one of procedures (Note: action is demonstrated):
- Open → → window, it will show all streams in the capture. Select one or more streams and then press . Selected streams are added to playlist.
-
Select any RTP packet in packet list, open → → window. It will show analysis of selected forward stream and its reverse stream (if is pressed during window opening). Then press . Forward and reverse stream is added to playlist.
- window can be opened from other tools too.
- Open → or → window, it will show all calls. Select one or more calls and then press . It will add all RTP streams related to selected calls to playlist.
- Open window in → or → window, it will show flow sequence of calls. Select any RTP stream and then press . It will add selected RTP stream to playlist.
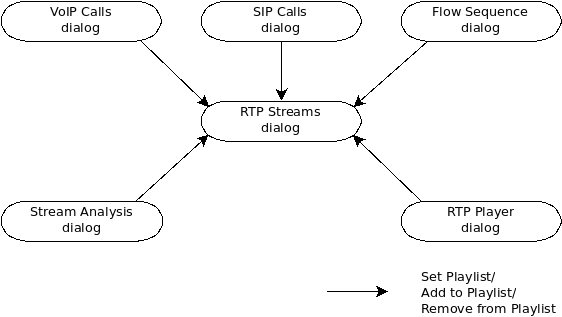
|
Note |
|---|---|
|
Same approach with set/add/remove actions is used for RTP Stream Analysis window. The playlist is there handled as different tabs in the window, see RTP Stream Analysis window. |
Decoding RTP payload and showing waveforms is a time consuming task. To speed it up, the RTP Player window uses a copy of packet payload for all streams in the playlist. During live capture the dialog is not refreshed automatically as other Wireshark dialogs - the user must initiate it.
The copy is created or refreshed and dialog updated:
- Every time window is opened.
- Every time a new stream is added or set.
- During live capture, when is pressed.
- Every time live capture is finished/stopped by a user.
When capture file is opened (no live capturing), streams are read complete, no user action is required. Button is disabled as it is useless.
When live capture is running, streams are read only till "now" and are shown. When stream is continuous and user would like to see additional part, they must press . When the user ends live capture, view is refreshed and button is disabled.
|
Note |
|---|---|
|
RTP Player dialog stays open even when live capture is stopped and then started again. Play list stays unchanged. Therefore, tries to read same streams as before and shows them if they are still running. Past part of them (from previous live capture) is lost. |
RTP is carried usually in UDP packets with random source and destination ports. Therefore, Wireshark can only recognize RTP streams based on VoIP signaling, e.g., based on SDP messages in SIP signaling. If signaling is not captured, Wireshark shows just UDP packets. However, there are multiple settings which help Wireshark recognize RTP even when there is no related signaling.
You can use Decode As… function from → menu or in mouse context menu. Here you can set that traffic on specific source or destination should be decoded as RTP. You can save settings for later use.
Use of menu works fine, but is arduous if you have many streams.
You can enable heuristic dissector in → . See Section 11.4, “Control Protocol Dissection” for details. Once is enabled, Wireshark tries to decode every UDP packet as RTP. If decoding is possible, packet (and entire UDP stream) is decoded as RTP.
When an RTP stream uses a well-known port, the heuristic dissector ignores it. So you might miss some RTP streams. You can enable setting for udp protocol → → → , see Section 11.5, “Preferences”. In this case heuristics dissector tries to decode UDP packet even it uses a well-known port.
|
Note |
|---|---|
|
Take into account that heuristics is just a simple "test" of whether a packet can be read as RTP. Because of false positives, you can see decoded as RTP more UDP packets than expected. When you enable → , it increases the possibility of false positives. If you capture all traffic in network, false positives rate can be quite high. |
RTP Player must store decoded data somewhere to be able to play it. When data are decoded, there are audio samples and dictionary for fast navigation. Both types of data are stored in memory for default, but you can configure Wireshark to store it on disk. There are two settings (which you may access from → Advanced from the main menu).
- ui.rtp_player_use_disk1 - When set to FALSE (default), audio samples are kept in memory. When set to TRUE, audio samples are stored on temporary file.
- ui.rtp_player_use_disk2 - When set to FALSE (default), dictionary is kept in memory. When set to TRUE, dictionary is stored on temporary file.
When any data are configured to be stored on disk, one file is created for each stream. Therefore, there might be up to two files for one RTP stream (audio samples and dictionary). If your OS or user has OS enforced limit for count of opened files (most of Unix/Linux systems), you may see fewer streams than were added to playlist. Warnings are printed on console - in this case and you will see fewer streams in the playlist than you send to it from other tools.
For common use you can use default settings - store everything in memory. When you will be out of memory, switch ui.rtp_player_use_disk1 to TRUE first - it saves much more memory than ui.rtp_player_use_disk2.
Processing of RTP and decoding RTP voice takes resources. There are raw estimates you can use as guidelines…
RTP Streams window can show as many streams as found in the capture. Its performance is limited just by memory and CPU.
RTP Player can handle 1000+ streams, but take into account that waveforms are very small and difficult to recognize in this case.
RTP Player plays audio by OS sound system and OS is responsible for mixing audio when multiple streams are played. In many cases OS sound system has limited count of mixed streams it can play/mix. RTP Player tries to handle playback failures and show warning. If it happens, just mute some streams and start playback again.
RTP Analysis window can handle 1000+ streams, but it is difficult to use it with so many streams - it is difficult to navigate between them. It is expected that RTP Analysis window will be used for analysis of lower tens of streams.
The VoIP Calls window shows a list of all detected VoIP calls in the captured traffic. It finds calls by their signaling and shows related RTP streams. The current VoIP supported protocols are:
- H.323
- IAX2
- ISUP
- MGCP/MEGACO
- SIP
- SKINNY
- UNISTIM
See VOIPProtocolFamily for an overview of the used VoIP protocols.
VoIP Calls window can be opened as window showing all protocol types ( → window) or limited to SIP messages only ( → window).
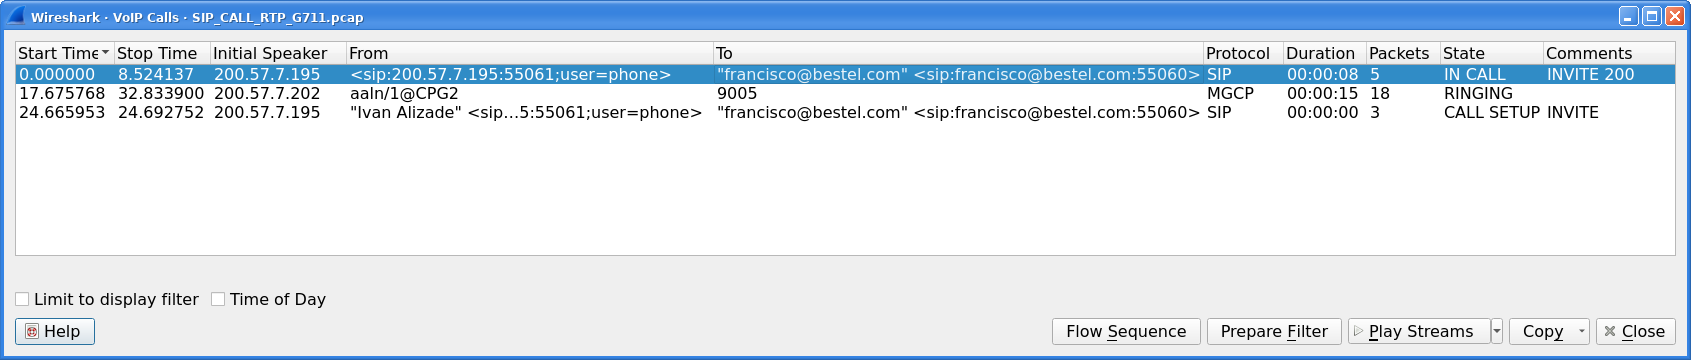
User can use shortcuts:
-
Selection
- Ctrl+A - Select all streams
- Ctrl+I - Invert selection
- Ctrl+Shift+A - Select none
- Note: Common Mouse click, Shift+Mouse click and Ctrl+Mouse click works too
-
On selected call/calls
- S - Selects stream/streams related to call in RTP Streams window (if not opened, it opens it and put it on background).
- D - Deselects stream/streams related to call in RTP Streams window (if not opened, it opens it and put it on background).
Available controls are:
- filters calls just to ones matching display filter. When display filter is active before window is opened, checkbox is checked.
- switches format of shown time between relative to start of capture or absolute time of received packets.
- opens Flow Sequence window and shows selected calls in it.
- generates display filter matching to selected calls (signaling and RTP streams) and apply it.
- opens RTP Player window. Actions , and are available.
- copies information from table to clipboard in CSV or YAML.
This menu shows groups of statistic data for mobile communication protocols according to ETSI GSM standards.
The A-Interface Base Station Management Application Part (BSMAP) Statistics window shows the messages list and the number of the captured messages. There is a possibility to filter the messages, copy or save the date into a file.
The Global System for Mobile Communications (GSM) is a standard for mobile networks. This menu shows a group of statistic data for mobile communication protocols according to ETSI GSM standard.
The “IAX2 Stream Analysis” window shows statistics for the forward and reverse streams of a selected IAX2 call along with a graph.
Integrated Service User Part (ISUP) protocol provides voice and non-voice signaling for telephone communications. ISUP Messages menu opens the window which shows the related statistics. The user can filter, copy or save the data into a file.
Statistics of the captured LTE or NR MAC traffic. This window will summarize the MAC traffic found in the capture.
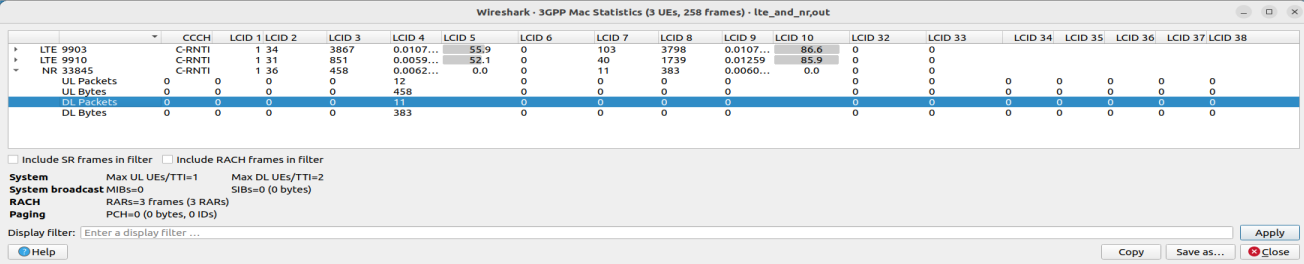
Each row in the top pane shows statistical highlights for exactly one UE/C-RNTI. Opening a UE item shows details of each logical channel identifier of that UE.
The bottom pane shows statistics for common channels, and controls to apply more detailed display filters to the packet list.
The RLC Graph menu launches a graph which shows LTE/NR Radio Link Control protocol sequence numbers changing over time along with (for AM) acknowledgements received in the opposite direction.
|
Note |
|---|---|
|
That graph shows data of a single bearer and direction. This graph may also be launched from the “RLC Statistics” window. |
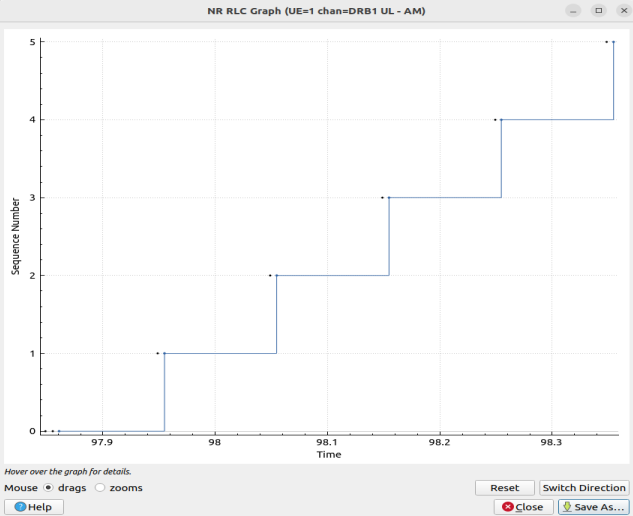
The image of the RLC Graph is borrowed from the Wireshark wiki.
Statistics of the captured LTE/NR RLC traffic. This window will summarize the RLC traffic found in the capture.
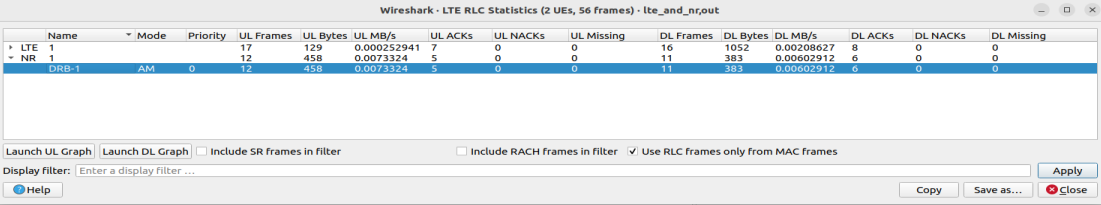
A check-box controls whether this window should include RLC PDUs logged within MAC PDUs or not. This will affect both the PDUs counted as well as the display filters generated (see below).
The upper list shows summaries of each active UE. Opening up a UE entry will show the same information broken down by individual bearers.
The lower part of the windows allows display filters to be generated and set for the selected bearer/channel. Note that in the case of Acknowledged Mode channels, if a single direction is chosen, the generated filter will show data in that direction and control PDUs in the opposite direction.
The Message Transfer Part level 3 (MTP3) protocol is a part of the Signaling System 7 (SS7). The Public Switched Telephone Networks use it for reliable, unduplicated and in-sequence transport of SS7 messaging between communication partners.
This menu shows MTP3 Statistics and MTP3 Summary windows.
OSmux is a multiplex protocol designed to reduce bandwidth usage of satellite-based GSM systems’s voice (RTP-AMR) and signaling traffic. The OSmux menu opens the packet counter window with the related statistic data. The user can filter, copy or save the data into a file.
The RTP streams window shows all RTP streams in capture file. Streams can be selected there and on selected streams other tools can be initiated.
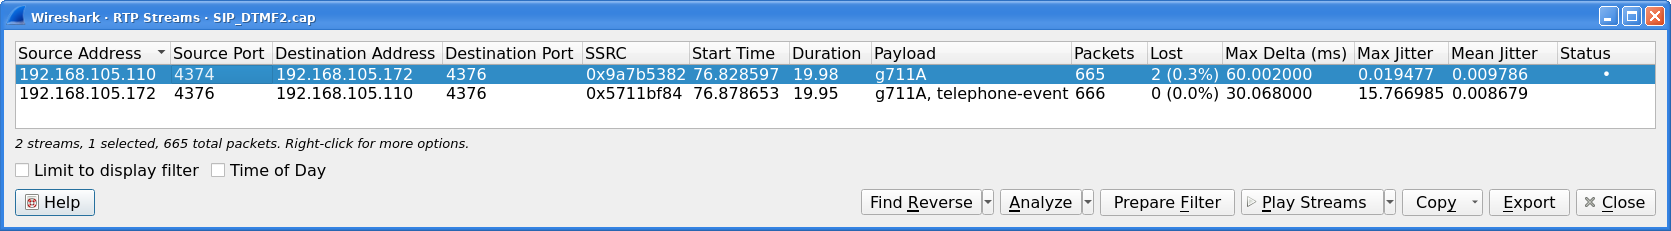
User can use shortcuts:
-
Selection
- Ctrl+A - Select all streams
- Ctrl+I - Invert selection
- Ctrl+Shift+A - Select none
- Note: Common Mouse click, Shift+Mouse click and Ctrl+Mouse click works too
-
Find Reverse
- R - Try search for reverse streams related to already selected streams. If found, selects them in the list too.
- - Select all pair streams (forward/reverse relation).
- - Select all single streams (no reverse stream does exist).
- G - Go to packet of stream under the mouse cursor.
- M - Mark all packets of selected streams.
- P - Prepare filter matching selected streams and apply it.
- E - Export selected streams in RTPDump format.
- A - Open RTP Stream Analysis window and add selected streams to it.
Available controls are:
-
Find Reverse
- search for reverse stream of every selected stream. If found, selects it in the list too.
- select all streams which have forward/reverse relation.
- select all streams which are single - have no reverse stream.
- opens RTP Stream Analysis window. Actions , and are available.
- prepares filter matching selected streams and apply it.
- opens RTP Player window. Actions , and are available.
- copies information from table to clipboard in CSV or YAML.
- exports selected streams in RTPDump format.
The RTP analysis function takes the selected RTP streams and generates a list of statistics on them including a graph.
The → → menu item is enabled only when the selected packet is an RTP packet. When the action is selected, the RTP Stream Analysis window is opened (if not already) and the RTP stream of the current packet is added for analysis. If is pressed when selecting the menu item, other RTP streams on the same addresses and ports (in both forward and reverse direction) are scanned for and added to the window too if found.
Every stream is shown on its own tab. Tabs are numbered as streams are added and each tooltip shows the identification of the stream. When a tab is closed, its number is not reused. The tab color matches the color of the corresponding graph on the graph tab.
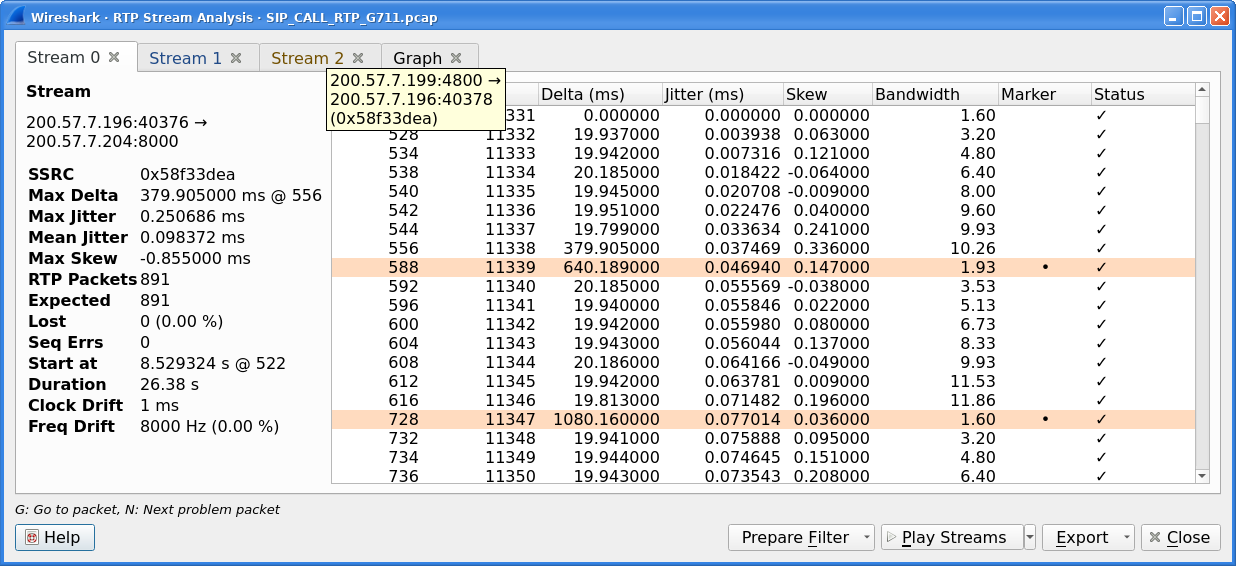
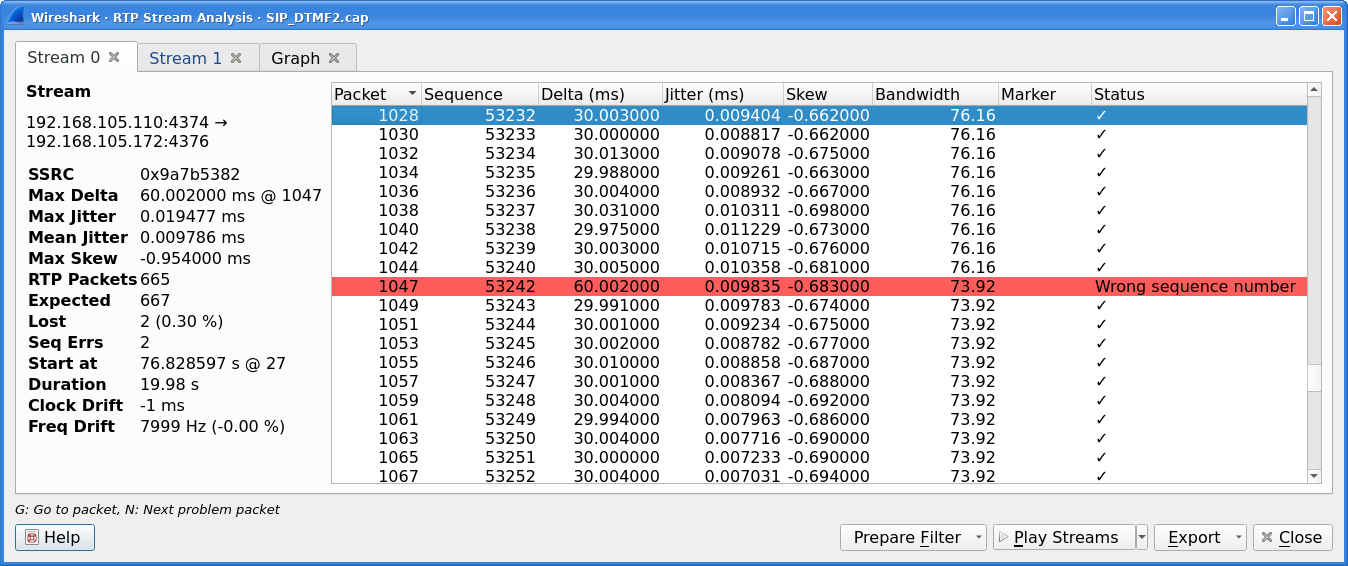
Per packet statistic shows:
- Packet number
- Sequence number
- Delta (ms) to last packet
- Jitter (ms)
- Skew
- Bandwidth
- Marker - packet is marked in RTP header
- Status - information related to the packet. E. g. change of codec, DTMF number, warning about incorrect sequence number.
Side panel left to packet list shows stream statistics:
- Maximal delta and at which packet it occurred
- Maximal jitter
- Mean jitter
- Maximal skew
- Count of packets
- Count of lost packets - calculated from sequence numbers
- When the stream starts and first packet number
- Duration of the stream
- Clock drift
- Frequency drift
|
Note |
|---|---|
|
Some statistic columns are calculated only when Wireshark is able to decode codec of RTP stream. |
Available shortcuts are:
- G - Go to selected packet of stream in packet list
- N - Move to next problem packet
Available controls are:
-
Prepare Filter
- prepares filter matching current tab and applies it.
- prepares filter matching all tabs and applies it.
- opens RTP Player window. Actions , and are available.
- allows export current stream or all streams as CSV or export graph as image in multiple different formats (PDF, PNG, BMP and JPEG).
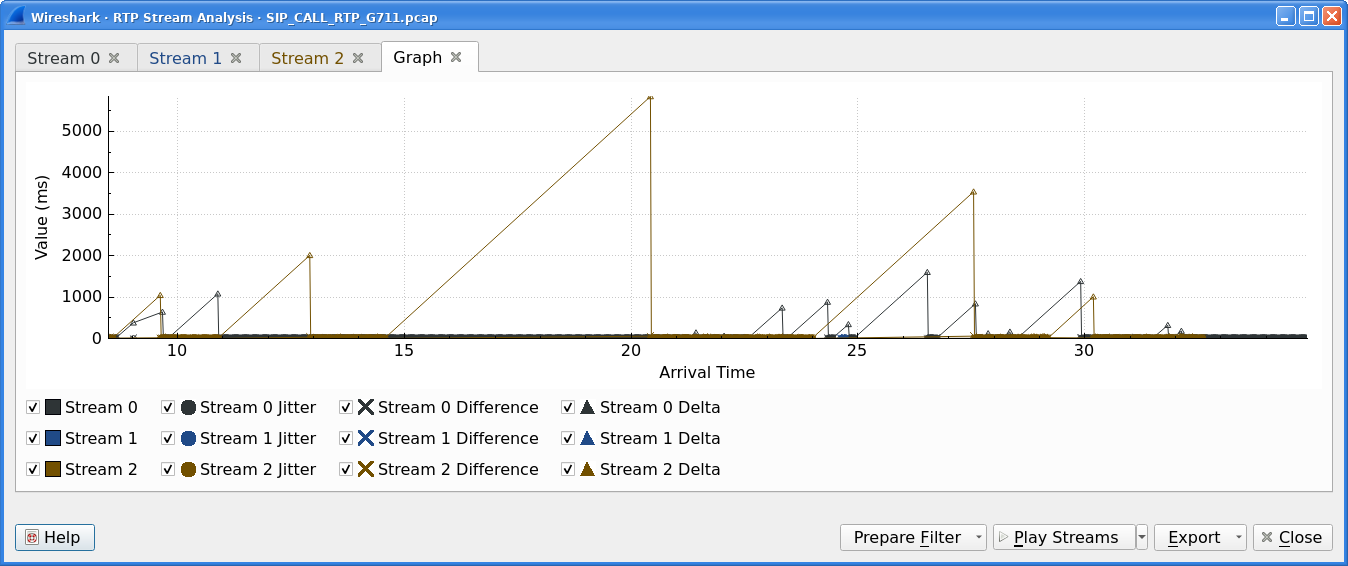
Graph view shows graph of:
- jitter
- difference - absolute value of difference between expected and real time of packet arrival
- delta - time difference from reception of previous packet
for every stream. Checkboxes below graph are enabling or disabling showing of a graph for every stream. checkbox enables or disables all graphs for the stream.
|
Note |
|---|---|
|
Stream Analysis window contained tool for save audio and payload for analyzed streams. This tool was moved in Wireshark 3.5.0 to RTP Player window. New tool has more features. |
The RTP Player function is a tool for playing VoIP calls. It shows RTP streams and their waveforms, and can play the streams and export them to file as audio or raw payload. See related concepts in Section 9.2, “Playing VoIP Calls”.
The → → menu item is enabled only when the selected packet is an RTP packet. When the action is selected, the RTP Player window is opened (if not already) and the RTP stream of the current packet is added to the playlist. If is pressed when selecting the menu item, other RTP streams on the same addresses and ports (in both forward and reverse direction) are scanned for and added to the playlist too if found.
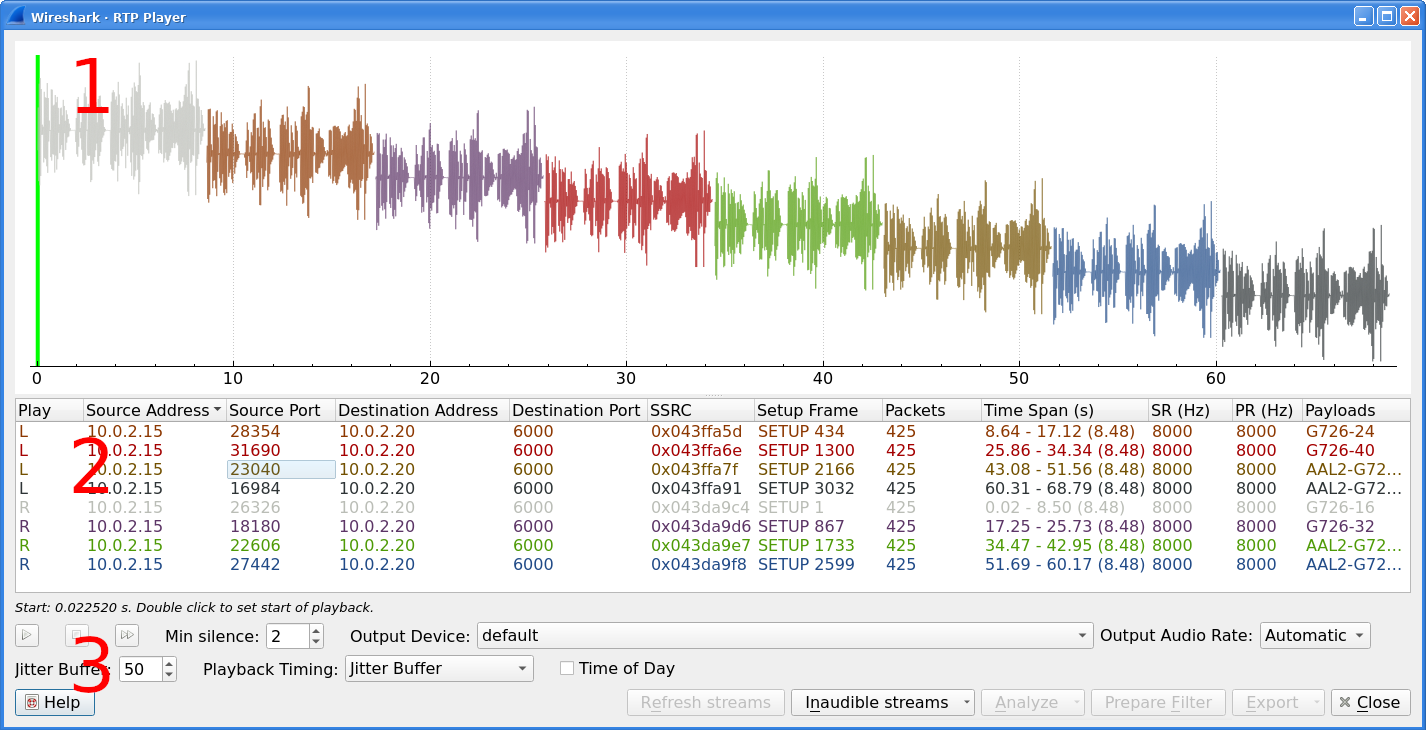
RTP Player Window consists of three parts:
- Waveform view
- Playlist
- Controls
Waveform view shows visual presentation of RTP stream. Color of waveform and playlist row are matching. Height of wave shows volume.
Waveform shows error marks for Out of Sequence, Jitter Drops, Wrong Timestamps and Inserted Silence marks if it happens in a stream.
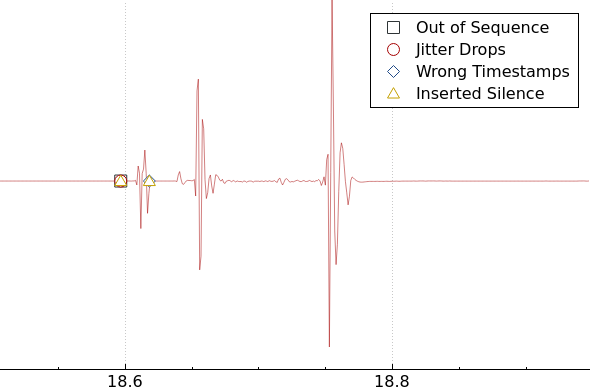
Playlist shows information about every stream:
- Play - Audio routing
- Source Address, Source Port, Destination Address, Destination Port, SSRC
-
Setup Frame
- SETUP <number> is shown, when there is known signaling packet. Number is packet number of signaling packet. Note: Word SETUP is shown even RTP stream was initiated e. g. by SKINNY where no SETUP message exists.
- RTP <number> is shown, when no related signaling was found. Number is packet number of first packet of the stream.
- Packets - Count of packets in the stream.
- Time Span - Start - Stop (Duration) of the stream
- SR - Sample rate of used codec
- PR - Decoded play rate used for stream playing
- Payloads - One or more payload types used by the stream
|
Note |
|---|---|
|
When rtp_udp is active, most of streams shows just RTP <number> even there is setup frame in capture. When RTP stream contains multiple codecs, SR and PR is based on first observed coded. Later codecs in stream are resampled to first one. |
Controls allow a user to:
- // playing of unmuted streams
-
enabling/disabling silence skipping
- Min silence - Minimal duration of silence to skip in seconds. Shorter silence is played as it is.
- Select and
-
Select
- Jitter Buffer - Packets outside size are discarded during decoding
- RTP Timestamp - Packets are ordered and played by its Timestamp, no Jitter Buffer is used
- Uninterrupted Mode - All gaps (e. g. Comfort Noise, lost packets) are discarded therefore audio is shorted than timespan
- selects whether waveform timescale is shown in seconds from start of capture or in absolute time of received packets
- refreshes streams during live capture (see Section 9.2.3, “Playing audio during live capture”). Button is disabled when no live capture is running.
-
Inaudible streams
- select all inaudible streams (streams with zero play rate)
- deselect all inaudible streams (streams with zero play rate)
- open RTP Stream Analysis window. Actions , and are available.
- prepare filter matching selected streams and apply it.
- - See Section 9.11.3.1, “Export”.
|
Note |
|---|---|
|
RTP Player detects silence just by missing voice samples (Comfort Noise, interrupted RTP, missing RTP, …) or when some streams are muted. |
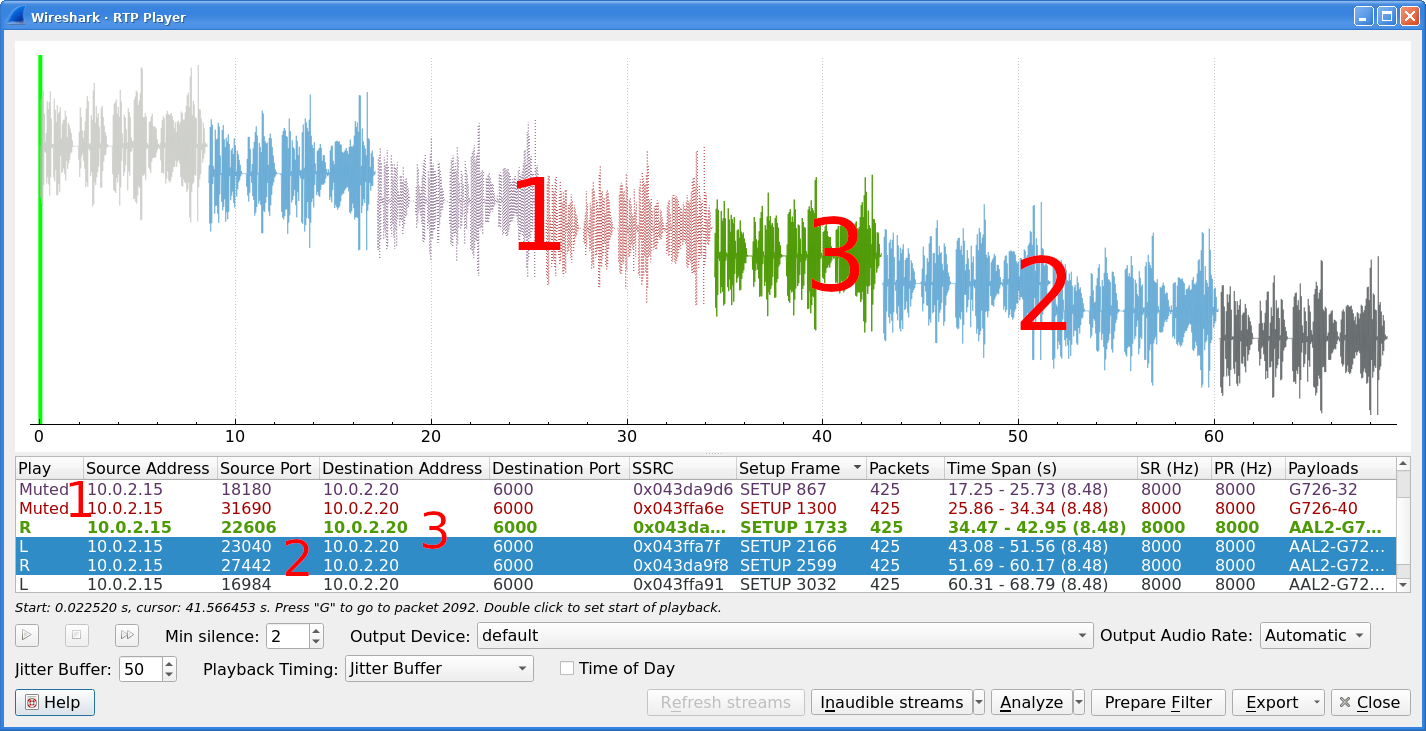
Waveform view and playlist shows state of a RTP stream:
- stream is muted (dashed waveform, is shown in Play column) or unmuted (non-dashed waveform, audio routing is shown in Play column)
- stream is selected (blue waveform, blue row)
- stream is below mouse cursor (bold waveform, bold font)
User can control to where audio of a stream is routed to:
- L - Left channel
- L+R - Left and Right (Middle) channel
- R - Left channel
- P - Play (when mono soundcard is available only)
- M - Muted
Audio routing can be changed by double-clicking on first column of a row, by shortcut or by menu.
User can use shortcuts:
-
Selection
- Ctrl+A - Select all streams
- Ctrl+I - Invert selection
- Ctrl+Shift+A - Select none
- Note: Common Mouse click, Shift+Mouse click and Ctrl+Mouse click works too
-
Go to packet
- G - Go to packet of stream under the mouse cursor
- Shift+G - Go to setup packet of stream under the mouse cursor
-
Audio routing
- M - Mute all selected streams
- Shift+M - Unmute all selected streams
- Ctrl+M - Invert muting of all selected streams
- P - Play audio
- S - Stop playing
- Del or Ctrl+X - Remove all selected streams from playlist
-
Inaudible streams
- N - Select all inaudible streams
- Shift+N - Deselect all inaudible streams
|
Note |
|---|---|
|
was moved from window to window in 3.5.0. Wireshark is able to export decoded audio in .au or .wav file format. Prior to version 3.2.0, Wireshark only supported exporting audio using the G.711 codec. From 3.2.0 it supports audio export using any codec with 8000 Hz sampling. From 3.5.0 is supported export of any codec, rate is defined by Output Audio Rate. |
Export options available:
-
for one or more selected non-muted streams
- From cursor - Streams are saved from play start cursor. If some streams are shorter, they are removed from the list before save and count of saved streams is lower than count of selected streams.
- Stream Synchronized Audio - File starts at the begin of earliest stream in export, therefore there is no silence at beginning of exported file.
- File Synchronized Audio - Streams starts at beginning of file, therefore silence can be at start of file.
-
for just one selected stream
- Payload - just payload with no information about coded is stored in the file
Audio is exported as multi-channel file - one channel per RTP stream. One or two channels are equal to mono or stereo, but Wireshark can export e.g., 100 channels. For playing a tool with multi-channel support must be used (e.g., https://www.audacityteam.org/).
Export of payload function is useful for codecs not supported by Wireshark.
|
Note |
|---|---|
|
Default value of is . When multiple codecs with different codec rates are captured, Wireshark decodes each stream with its own play audio rate. Therefore, each stream can have a different audio rate. If you attempt to export audio when there are multiple audio rates, it will fail because .au or .wav require a fixed audio rate. In this case user must manually select one of rates in , streams will be resampled and audio export succeeds. |
In the Real Time Streaming Protocol (RTSP) menu the user can check the Packet Counter window. It shows Total RTCP Packets and divided into RTSP Response Packets, RTSP Request Packets and Other RTSP packets. The user can filter, copy or save the data into a file.
Stream Control Transmission Protocol (SCTP) is a computer network protocol which provides a message transfer in telecommunication in the transport layer. It overcomes some lacks of User Datagram Protocol (UDP) and Transmission Control Protocol (TCP). The SCTP packets consist of the common header and the data chunks.
The SCTP Analyze Association window shows the statistics of the captured packets between two Endpoints. You can check the different chunk types by pressing button in the Statistics tab. In the Endpoint tabs you can see various statistics, such as IP addresses, ports and others. You can also check different graphs here.
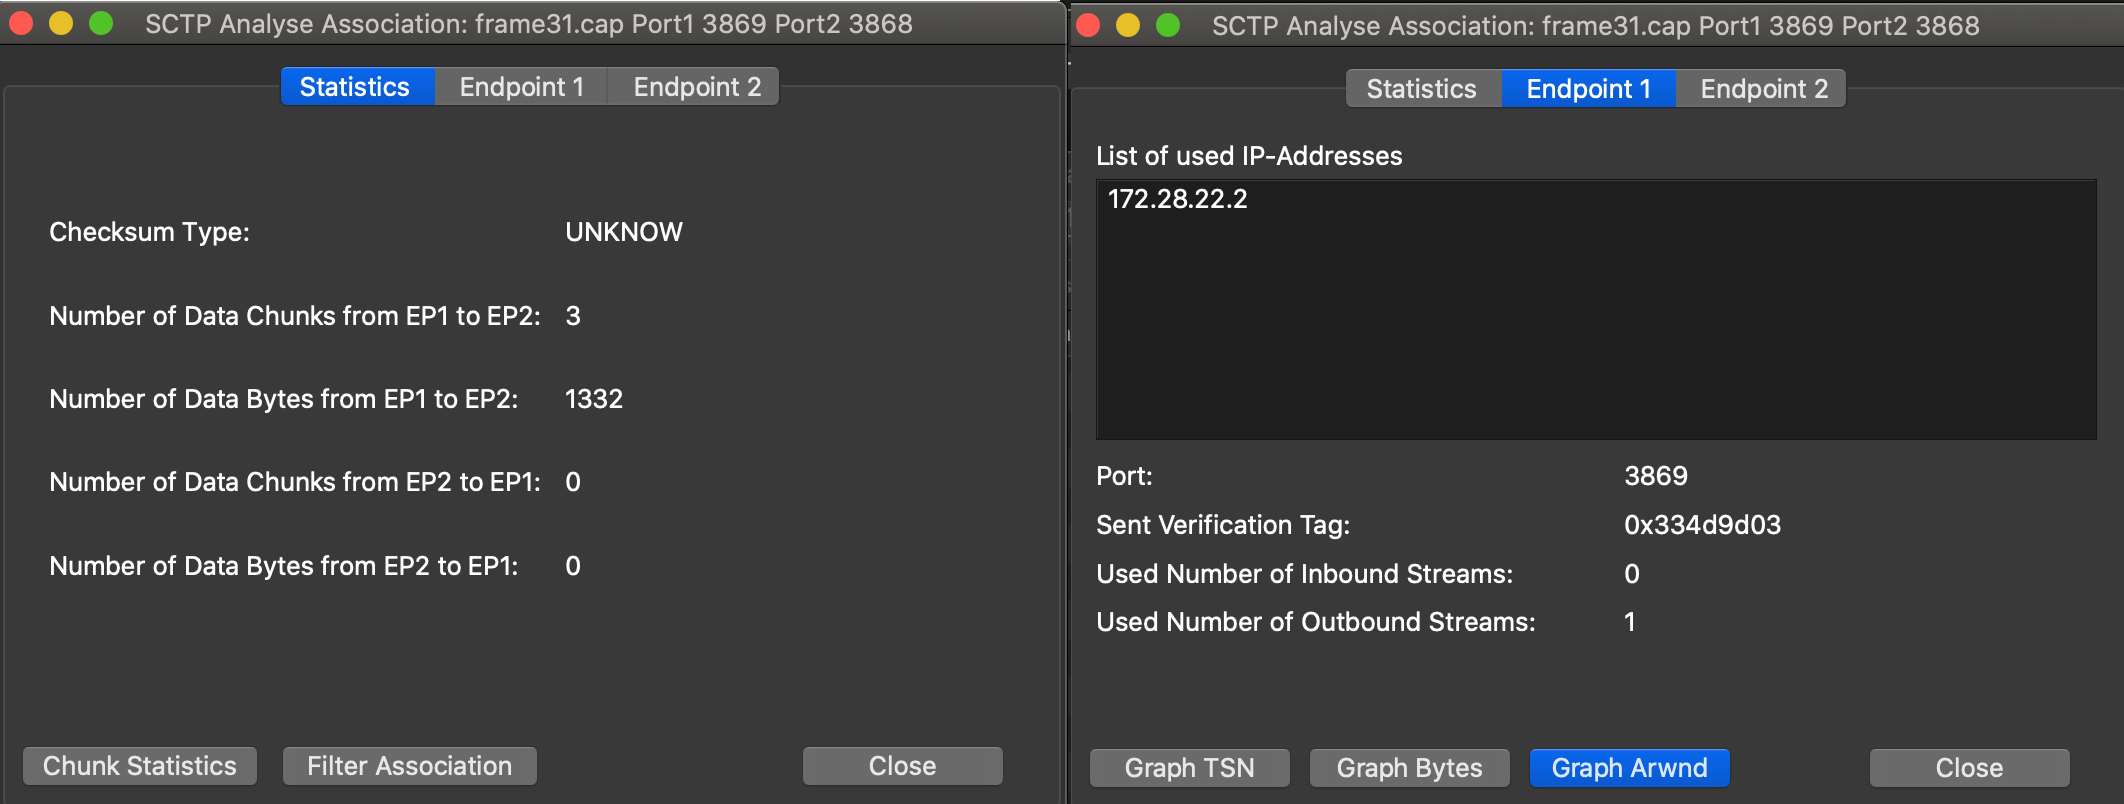
The SCTP Associations window shows the table with the data for captured packets, such as port and counter. You can also call for the SCTP Analyze Association window by pressing the button.
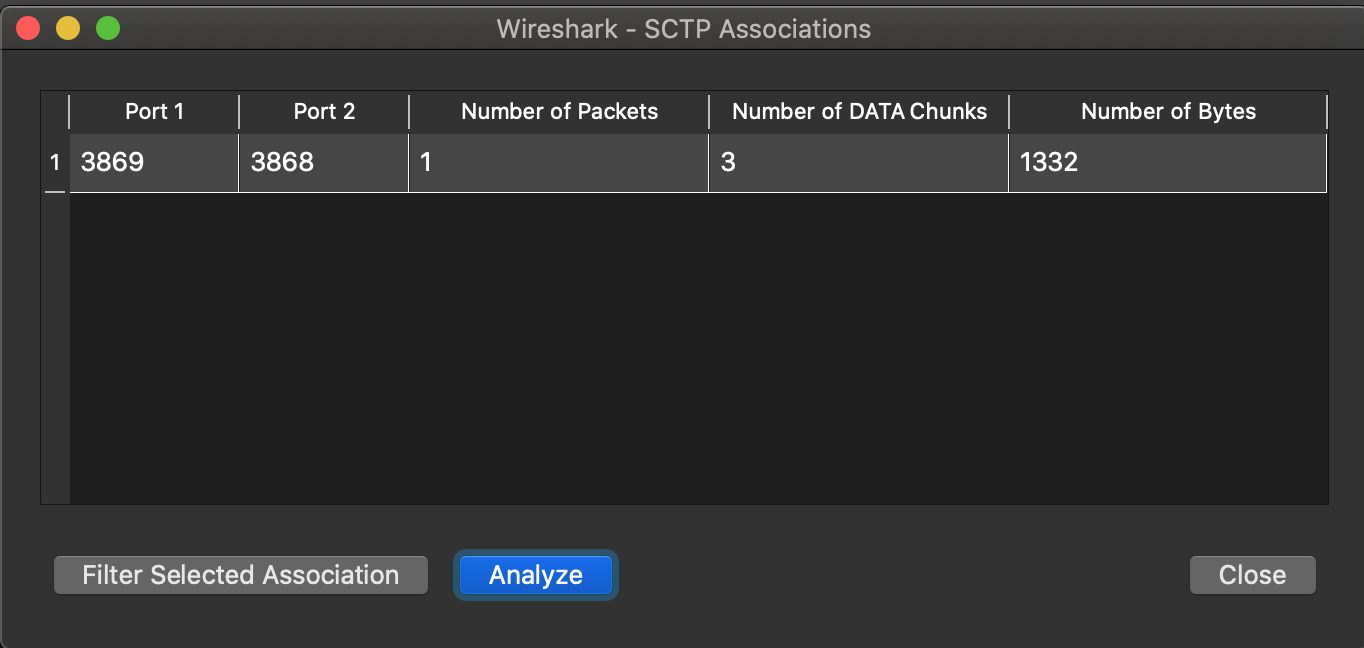
Short Message Peer-to-Peer (SMPP) protocol uses TCP protocol as its transfer for exchanging Short Message Service (SMS) Messages, mainly between Short Message Service Centers (SMSC). The dissector determines whether the captured packet is SMPP or not by using the heuristics in the fixed header. The SMPP Operations window displays the related statistical data. The user can filter, copy or save the data into a file.
The Universal Computer Protocol (UCP) plays role in transferring Short Messages between a Short Message Service Centre (SMSC) and an application, which is using transport protocol, such as TCP or X.25. The UCP Messages window displays the related statistical data. The user can filter, copy or save the data into a file.
F1AP is used to exchange signaling and user-plane data between CU and DU nodes as part of an O-RAN network. This window counts how many messages of each type are seen.
NGAP messages are exchanged between a gNB and core network. This window counts how many messages of each type are seen.
E2AP is used to configure and query nodes in an O-RAN network. This window counts how many messages of each type are seen.
H.225 telecommunication protocol which is responsible for messages in call signaling and media stream packetization for packet-based multimedia communication systems. The H.225 window shows the counted messages by types and reasons. The user can filter, copy or save the data into a file.
Session Initiation Protocol (SIP) Flows window shows the list of all captured SIP transactions, such as client registrations, messages, calls and so on.
This window will list both complete and in-progress SIP transactions.
Window has same features as VoIP Calls window.
SIP Statistics window shows captured SIP transactions. It is divided into SIP Responses and SIP Requests. In this window the user can filter, copy or save the statistics into a file.
Table of Contents
The Wireless menu provides access to statistics related to wireless traffic. For configuring keys to decrypt wireless traffic, see Section 11.10, “IEEE 802.11 WLAN Decryption Keys”
Bluetooth ATT Server Attributes window displays a list of captured Attribute Protocol (ATT) packets. The user can filter the list by the interfaces or devices, and also exclude repetitions by checking the Remove duplicates check box.
Handle is a unique attribute which is specific to the device.
UUID is a value which defines a type of an attribute.
UUID Name is a specified name for the captured packet.
The Bluetooth Devices window displays the list of the captured information about devices, such as MAC address, Organizationally Unique Identifier (OUI), Name and other. Users can filter it by interface.
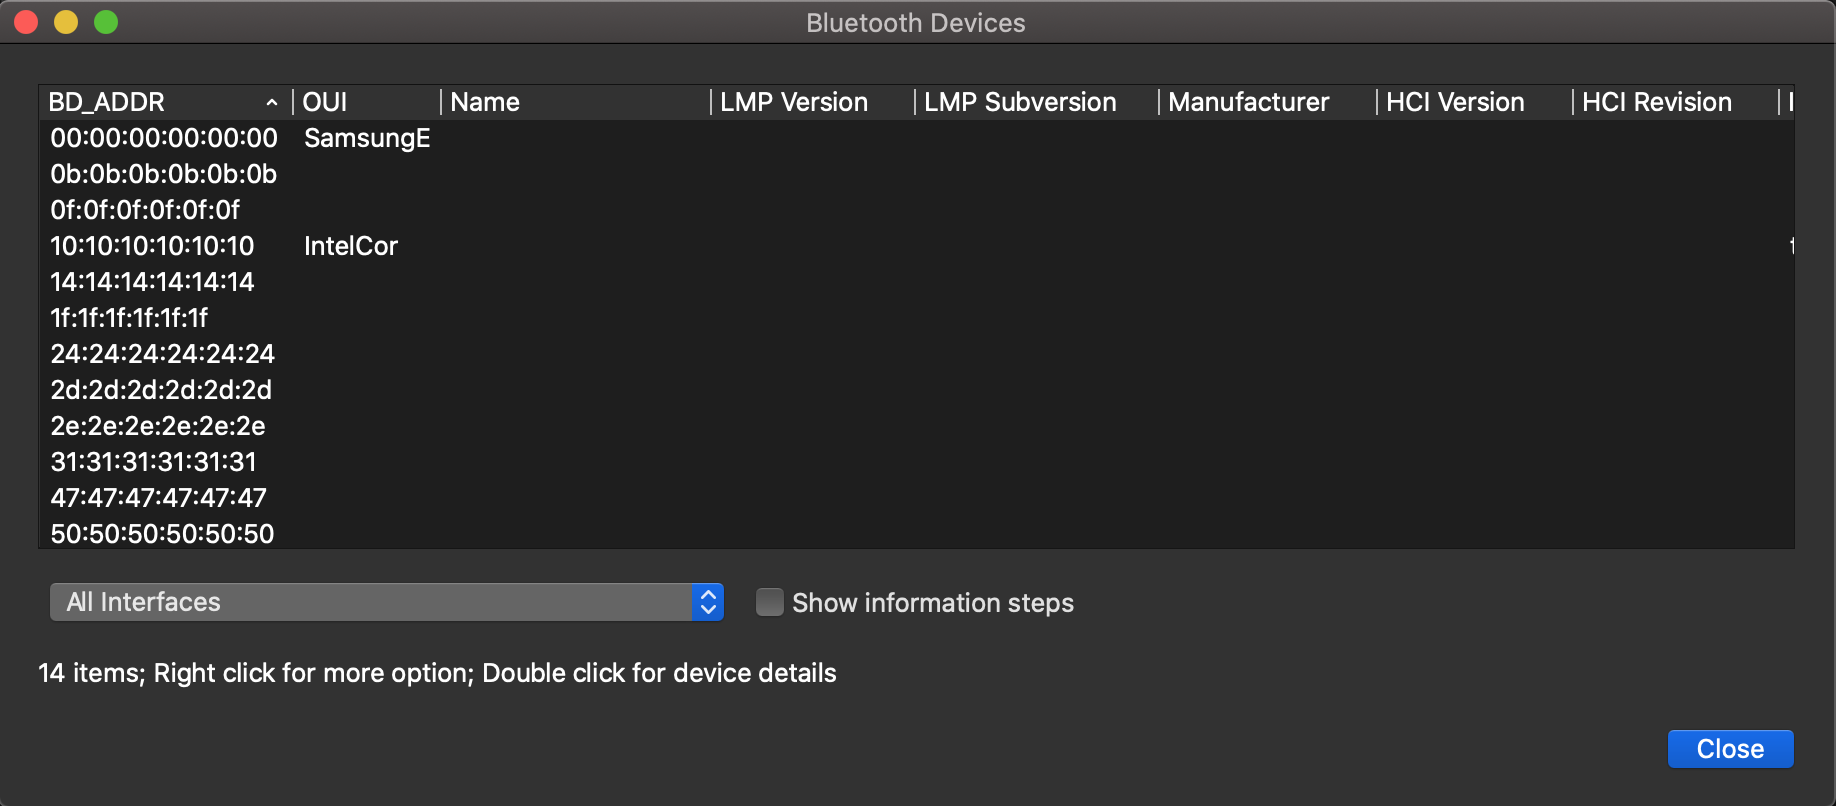
The Bluetooth HCI Summary window displays the summary for the captured Host Controller Interface (HCI) layer packets. This window allows users to apply filters and choose to display information about specific interfaces or devices.
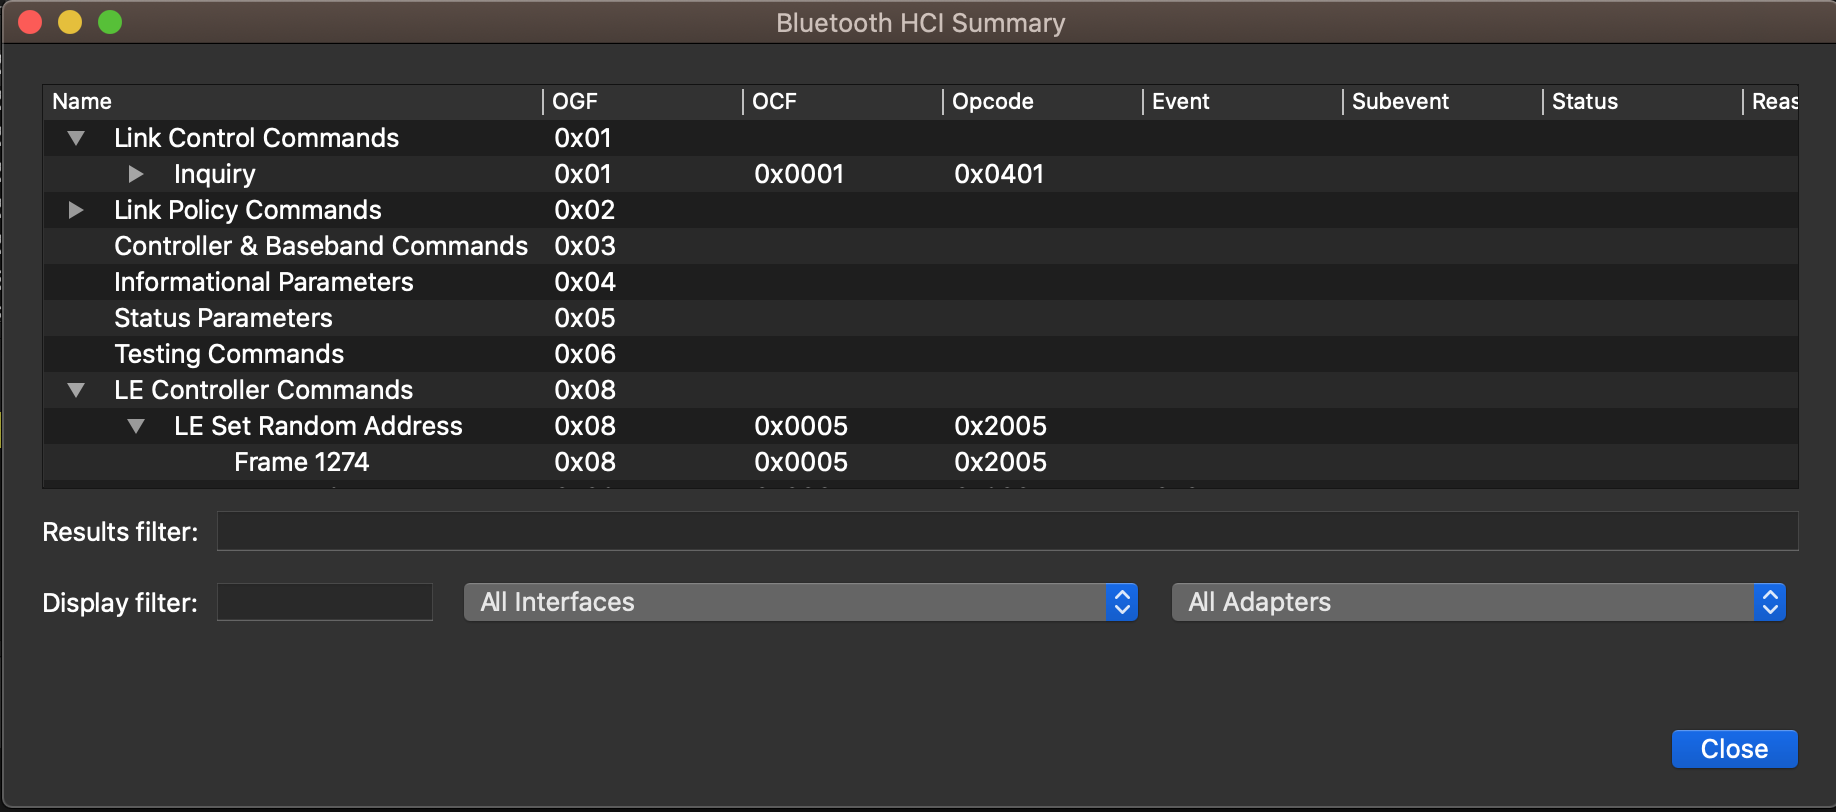
Statistics about captured WLAN traffic. This can be found under the menu and summarizes the wireless network traffic found in the capture. Probe requests will be merged into an existing network if the SSID matches.
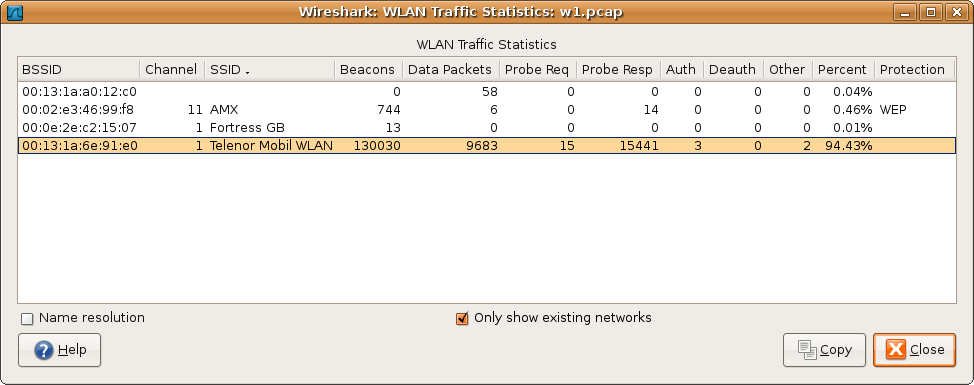
Each row in the list shows the statistical values for exactly one wireless network.
Name resolution will be done if selected in the window and if it is active for the MAC layer.
Only show existing networks will exclude probe requests with a SSID not matching any network from the list.
The button will copy the list values to the clipboard in CSV (Comma Separated Values) format.
|
Tip |
|---|---|
|
This window will be updated frequently, so it will be useful, even if you open it before (or while) you are doing a live capture. |
Table of Contents
- 11.1. Introduction
- 11.2. Start Wireshark from the command line
- 11.3. Packet colorization
- 11.4. Control Protocol Dissection
- 11.5. Preferences
- 11.6. Configuration Profiles
- 11.7. User Accessible Tables
- 11.8. ESS Category Attributes
- 11.9. MaxMind Database Paths
- 11.10. IEEE 802.11 WLAN Decryption Keys
- 11.11. IKEv2 decryption table
- 11.12. Object Identifiers
- 11.13. PRES Users Context List
- 11.14. SCCP users Table
- 11.15. SMI (MIB and PIB) Modules
- 11.16. SMI (MIB and PIB) Paths
- 11.17. SNMP Enterprise Specific Trap Types
- 11.18. SNMP users Table
- 11.19. Tektronix K12xx/15 RF5 protocols Table
- 11.20. User DLTs dissector table
- 11.21. Protobuf Search Paths
- 11.22. Protobuf UDP Message Types
- 11.23. Welcome Page Banner Slides
Wireshark’s default behavior will usually suit your needs pretty well. However, as you become more familiar with Wireshark, it can be customized in various ways to suit your needs even better. In this chapter we explore:
- How to start Wireshark with command line parameters
- How to colorize the packet list
- How to control protocol dissection
- How to use the various preference settings
You can start Wireshark from the command line, but it can also be started from most Window managers as well. In this section we will look at starting it from the command line.
Wireshark supports a large number of command line parameters. To see what they are, simply enter the command wireshark -h and the help information shown in Help information available from Wireshark (or something similar) should be printed.
Help information available from Wireshark.
Wireshark 4.5.0 (v4.5.0rc0-1896-g8ec46c963ceb)
Interactively dump and analyze network traffic.
See https://www.wireshark.org for more information.
Usage: wireshark [options] ... [ <infile> ]
Capture interface:
-i <interface>, --interface <interface>
name or idx of interface (def: first non-loopback)
-f <capture filter> packet filter in libpcap filter syntax
-s <snaplen>, --snapshot-length <snaplen>
packet snapshot length (def: appropriate maximum)
-p, --no-promiscuous-mode
don't capture in promiscuous mode
-I, --monitor-mode capture in monitor mode, if available
-B <buffer size>, --buffer-size <buffer size>
size of kernel buffer in MiB (def: 2MiB)
-y <link type>, --linktype <link type>
link layer type (def: first appropriate)
--time-stamp-type <type> timestamp method for interface
-D, --list-interfaces print list of interfaces and exit
-L, --list-data-link-types
print list of link-layer types of iface and exit
--list-time-stamp-types print list of timestamp types for iface and exit
Capture display:
-k start capturing immediately (def: do nothing)
-S update display when new items are captured
-l turn on automatic scrolling while -S is in use
--update-interval interval between updates with new items, in milliseconds (def: 100ms)
Capture stop conditions:
-c <item count> stop after n items (def: infinite)
-a <autostop cond.> ..., --autostop <autostop cond.> ...
duration:NUM - stop after NUM seconds
filesize:NUM - stop this file after NUM KB
files:NUM - stop after NUM files
packets:NUM - stop after NUM packets
Capture output:
-b <ringbuffer opt.> ..., --ring-buffer <ringbuffer opt.>
duration:NUM - switch to next file after NUM secs
filesize:NUM - switch to next file after NUM KB
files:NUM - ringbuffer: replace after NUM files
packets:NUM - switch to next file after NUM packets
interval:NUM - switch to next file when the time is
an exact multiple of NUM secs
Input file:
-r <infile>, --read-file <infile>
set the filename to read from (no pipes or stdin!)
Processing:
-R <read filter>, --read-filter <read filter>
filter in display filter (wireshark-filter(4)) syntax
-n disable all name resolutions (def: all enabled)
-N <name resolve flags> enable specific name resolution(s): "mtndsNvg"
-d <layer_type>==<selector>,<decode_as_protocol> ...
"Decode As", see the man page for details
Example: tcp.port==8888,http
--enable-protocol <proto_name>
enable dissection of proto_name
--disable-protocol <proto_name>
disable dissection of proto_name
--only-protocols <protocols>
Only enable dissection of these protocols, comma
separated. Disable everything else
--disable-all-protocols
Disable dissection of all protocols
--enable-heuristic <short_name>
enable dissection of heuristic protocol
--disable-heuristic <short_name>
disable dissection of heuristic protocol
User interface:
-C <config profile> start with specified configuration profile
-H hide the capture info dialog during capture
-Y <display filter>, --display-filter <display filter>
start with the given display filter
-g <item number> go to specified item number after "-r"
-J <jump filter> jump to the first item matching the display
filter
-j search backwards for a matching item after "-J"
-t (a|ad|adoy|d|dd|e|r|u|ud|udoy)[.[N]]|.[N]
format of time stamps (def: r: rel. to first)
-u s|hms output format of seconds (def: s: seconds)
-X <key>:<value> eXtension options, see man page for details
-z <statistics> show various statistics, see man page for details
Output:
-w <outfile|-> set the output filename (or '-' for stdout)
-F <capture type> set the output file type; default is pcapng.
an empty "-F" option will list the file types.
--capture-comment <comment>
add a capture file comment, if supported
--temp-dir <directory> write temporary files to this directory
(default: /tmp)
Diagnostic output:
--log-level <level> sets the active log level ("critical", "warning", etc.)
--log-fatal <level> sets level to abort the program ("critical" or "warning")
--log-domains <[!]list> comma-separated list of the active log domains
--log-fatal-domains <list>
list of domains that cause the program to abort
--log-debug <[!]list> list of domains with "debug" level
--log-noisy <[!]list> list of domains with "noisy" level
--log-file <path> file to output messages to (in addition to stderr)
Miscellaneous:
-h, --help display this help and exit
-v, --version display version info and exit
-P <key>:<path> persconf:path - personal configuration files
persdata:path - personal data files
-o <name>:<value> ... override preference or recent setting
-K <keytab> keytab file to use for kerberos decryption
--display <X display> X display to use
--fullscreen start Wireshark in full screen
We will examine each of the command line options in turn.
The first thing to notice is that issuing the command wireshark by itself will
launch Wireshark. However, you can include as many of the command line
parameters as you like. Their meanings are as follows ( in alphabetical order ):
- -a <capture autostop condition>, --autostop <capture autostop condition>
-
Specify a criterion that specifies when Wireshark is to stop writing to a capture file. The criterion is of the form test:value, where test is one of:
- duration:value
- Stop writing to a capture file after value of seconds have elapsed.
- filesize:value
- Stop writing to a capture file after it reaches a size of value kilobytes (where a kilobyte is 1000 bytes, not 1024 bytes). If this option is used together with the -b option, Wireshark will stop writing to the current capture file and switch to the next one if filesize is reached.
- files:value
- Stop writing to capture files after value number of files were written.
- packets:value
- Stop writing to a capture file after value number of packets were written.
- -b <capture ring buffer option>
-
If a maximum capture file size was specified, this option causes Wireshark to run in “ring buffer” mode, with the specified number of files. In “ring buffer” mode, Wireshark will write to several capture files. Their name is based on the number of the file and on the creation date and time.
When the first capture file fills up Wireshark will switch to writing to the next file, and so on. With the files option it’s also possible to form a “ring buffer.” This will fill up new files until the number of files specified, at which point the data in the first file will be discarded so a new file can be written.
If the optional duration is specified, Wireshark will also switch to the next file when the specified number of seconds has elapsed even if the current file is not completely filled up.
- duration:value
- Switch to the next file after value seconds have elapsed, even if the current file is not completely filled up.
- filesize:value
- Switch to the next file after it reaches a size of value kilobytes (where a kilobyte is 1000 bytes, not 1024 bytes).
- files:value
- Begin again with the first file after value number of files were written (form a ring buffer).
- packets:value
- Switch to the next file after value number of packets were written, even if the current file is not completely filled up.
- interval:value
- Switch to the next file when the time is an exact multiple of value seconds.
- -B <capture buffer size>, --buffer-size <capture buffer size>
- Set capture buffer size (in MB, default is 2MB). This is used by the capture driver to buffer packet data until that data can be written to disk. If you encounter packet drops while capturing, try to increase this size. Not supported on some platforms.
- -C <config profile>
- Start with the specified configuration profile.
- -c <capture packet count>
-
This option specifies the maximum number of packets to capture when capturing
live data. It would be used in conjunction with the
-koption. - --capture-comment <comment>
- Add the comment string to the capture file, if supported by the file format.
- -d <layer_type>==<selector>,<decode_as_dissector>
-
"Decode As": override what protocol is called under specific circumstances. See Section 11.4.2, “User Specified Decodes” for details about how this feature works.
An example of causing TCP traffic on port 8888 to be decoded as HTTP:
wireshark -d tcp.port==8888,http
To see all possible values for <layer_type>, run Wireshark or tshark with
-d help. You can see all possible values for <decode_as_dissectors> by runningtshark -G dissectorsbut note that not all dissectors can be used at all layers. - -D, --list-interfaces
-
Print a list of the interfaces on which Wireshark can capture, then exit. For each network interface, a number and an interface name, possibly followed by a text description of the interface, is printed. The interface name or the number can be supplied to the
-iflag to specify an interface on which to capture.This can be useful on systems that don’t have a command to list them (e.g., Windows systems, or UNIX systems lacking
ifconfig -a). The number can be especially useful on Windows, where the interface name is a GUID.Note that “can capture” means that Wireshark was able to open that device to do a live capture. If, on your system, a program doing a network capture must be run from an account with special privileges, then, if Wireshark is run with the
-Dflag and is not run from such an account, it will not list any interfaces. - --display <DISPLAY>
- Set the X display to use, instead of the one defined in the environment, or the default display.
- --enable-protocol <proto_name>, --disable-protocol <proto_name>
- Enable and disable the dissection of the protocol.
- --enable-heuristic <short_name>, --disable-heuristic <short_name>
- Enable and disable the dissection of the heuristic protocol.
- -f <capture filter>
- This option sets the initial capture filter expression to be used when capturing packets.
- --fullscreen
- Start Wireshark in full screen.
- -g <packet number>
- After reading in a capture file using the -r flag, go to the given packet number.
- -h, --help
- This option requests Wireshark to print its version and usage instructions (as shown here) and exit.
- -H
- Hide the capture info dialog during live packet capture.
- -i <capture interface>, --interface <capture interface>
-
Set the name of the network interface or pipe to use for live packet capture.
Network interface names should match one of the names listed in
wireshark -D(described above). A number, as reported bywireshark -D, can also be used. If you’re using UNIX,netstat -i,ifconfig -aorip linkmight also work to list interface names, although not all versions of UNIX support the-aflag toifconfig.If no interface is specified, Wireshark searches the list of interfaces, choosing the first non-loopback interface if there are any non-loopback interfaces, and choosing the first loopback interface if there are no non-loopback interfaces; if there are no interfaces, Wireshark reports an error and doesn’t start the capture.
Pipe names should be either the name of a FIFO (named pipe) or “-” to read data from the standard input. Data read from pipes must be in standard libpcap format.
- -J <jump filter>
-
After reading in a capture file using the
-rflag, jump to the first packet which matches the filter expression. The filter expression is in display filter format. If an exact match cannot be found the first packet afterwards is selected. - -I, --monitor-mode
- Capture wireless packets in monitor mode if available.
- -j
-
Use this option after the
-Joption to search backwards for a first packet to go to. - -k
-
The
-koption specifies that Wireshark should start capturing packets immediately. This option requires the use of the-iparameter to specify the interface that packet capture will occur from. - -K <keytab file>
- Use the specified file for Kerberos decryption.
- -l
-
This option turns on automatic scrolling if the packet list pane is being
updated automatically as packets arrive during a capture (as specified by the
-Sflag). - -L, --list-data-link-types
- List the data link types supported by the interface and exit.
- --list-time-stamp-types
- List timestamp types configurable for the interface and exit.
- -m <font>
- This option sets the name of the font used for most text displayed by Wireshark.
- -n
- Disable network object name resolution (such as hostname, TCP and UDP port names).
- -N <name resolving flags>
-
Turns on name resolving for particular types of addresses and port numbers. The argument is a string that may contain the following letters:
- N
- Use external name resolver.
- d
- Enable name resolution from captured DNS packets.
- m
- Enable MAC address resolution.
- n
- Enable network address resolution.
- t
- Enable transport layer port number resolution.
- v
- Enable VLAN ID resolution.
- -o <preference or recent settings>
-
Sets a preference or recent value, overriding the default value and any value read from a preference or recent file. The argument to the flag is a string of the form prefname:value, where prefname is the name of the preference (which is the same name that would appear in the
preferencesorrecentfile), and value is the value to which it should be set. Multiple instances of `-o <preference settings> ` can be given on a single command line.Preferences and Profiles The preferences you specify on the command line will override any settings you have changed in any of your profiles; this includes when switching from one profile to another.
If you change a setting using the Preferences dialog (see Section 11.5, “Preferences”) that you have also set on the command line, the command line option will then be ignored, and the setting will change as normal when you switch profiles.
An example of setting a single preference would be:
wireshark -o mgcp.display_dissect_tree:TRUE
An example of setting multiple preferences would be:
wireshark -o mgcp.display_dissect_tree:TRUE -o mgcp.udp.callagent_port:2627
You can get a list of all available preference strings from the preferences file. See Section A.2.4, “[Stream setup by PROTOCOL (frame 123)]” for details.
User Accessible Tables (UATs) can be overridden using “uat:” followed by the UAT file name (not the preference name) and a valid record for the file:
wireshark -o "uat:user_dlts:\"User 0 (DLT=147)\",\"http\",\"0\",\"\",\"0\",\"\""
The example above would dissect packets with a libpcap data link type 147 as HTTP, just as if you had configured it in the DLT_USER protocol preferences.
|
Note |
|---|---|
|
You can only add UAT entries from the command line. You can not modify or remove existing entries in a UAT in this way. |
- -p, --no-promiscuous-mode
-
Don’t put the interface into promiscuous mode. Note that the interface might be
in promiscuous mode for some other reason. Hence,
-pcannot be used to ensure that the only traffic that is captured is traffic sent to or from the machine on which Wireshark is running, broadcast traffic, and multicast traffic to addresses received by that machine. - -P <path setting>
-
Special path settings usually detected automatically. This is used for special cases, e.g., starting Wireshark from a known location on an USB stick.
The criterion is of the form key:path, where key is one of:
- persconf:path
- Path of personal configuration files, like the preferences files.
- persdata:path
- Path of personal data files, it’s the folder initially opened. After the initialization, the recent file will keep the folder last used.
- -r <infile>, --read-file <infile>
- This option provides the name of a capture file for Wireshark to read and display. This capture file can be in one of the formats Wireshark understands.
- -R <read (display) filter>, --read-filter <read (display) filter>
- This option specifies a display filter to be applied when reading packets from a capture file. The syntax of this filter is that of the display filters discussed in Section 6.3, “Filtering Packets While Viewing”. Packets not matching the filter are discarded.
- -s <capture snapshot length>, --snapshot-length <capture snapshot length>
- This option specifies the snapshot length to use when capturing packets. Wireshark will only capture snaplen bytes of data for each packet.
- -S
- This option specifies that Wireshark will display packets as it captures them. This is done by capturing in one process and displaying them in a separate process. This is the same as “Update list of packets in real time” in the “Capture Options” dialog box.
- -t <time stamp format>
-
This option sets the format of packet timestamps that are displayed in the packet list window. The format can be one of:
- r
- Relative, which specifies timestamps are displayed relative to the first packet captured.
- rc
- Relative to Capture Start, which specifies timestamps are displayed relative to the start of the capturing.
- a
- Absolute, which specifies that actual times be displayed for all packets.
- ad
- Absolute with date, which specifies that actual dates and times be displayed for all packets.
- adoy
- Absolute with YYYY/DOY date, which specifies that actual dates and times be displayed for all packets.
- d
- Delta, which specifies that timestamps are relative to the previous packet.
dd: Delta, which specifies that timestamps are relative to the previous displayed packet.
- e
- Epoch, which specifies that timestamps are seconds since epoch (Jan 1, 1970 00:00:00)
- u
- Absolute, which specifies that actual times be displayed for all packets in UTC.
- ud
- Absolute with date, which specifies that actual dates and times be displayed for all packets in UTC.
- udoy
- Absolute with YYYY/DOY date, which specifies that actual dates and times be displayed for all packets in UTC.
- -u <s | hms>
- Show timestamps as seconds (“s”, the default) or hours, minutes, and seconds (“hms”)
- -v, --version
- This option requests Wireshark to print out its version information and exit.
- -w <savefile>
- This option sets the name of the file to be used to save captured packets. This can be '-' for stdout.
- -y <capture link type>, --link-type <capture like types>
-
If a capture is started from the command line with
-k, set the data link type to use while capturing packets. The values reported by-Lare the values that can be used. - --time-stamp-type <type>
-
If a capture is started from the command line with
-k, set the time stamp type to use while capturing packets. The values reported by--list-time-stamp-typesare the values that can be used. - -X <eXtension option>
-
Specify an option to be passed to a Wireshark/TShark module. The eXtension option is in the form extension_key:value, where extension_key can be:
- lua_script:<lua_script_filename>
- Tells Wireshark to load the given script in addition to the default Lua scripts.
- lua_script[num]:argument
-
Tells Wireshark to pass the given argument to the Lua script identified by
num, which is the number indexed order of the lua_script command. For
example, if only one script was loaded with
-X lua_script:my.lua, then-X lua_script1:foowill pass the string foo to the my.lua script. If two scripts were loaded, such as-X lua_script:my.lua -X lua_script:other.luain that order, then a-X lua_script2:barwould pass the string bar to the second Lua script, ie., other.lua. - read_format:<file_type>
- Tells Wireshark to use a specific input file type, instead of determining it automatically.
- stdin_descr:<description>
- Define a description for the standard input interface, instead of the default: "Standard input".
- -Y <display filter>, --display-filter <display filter>
- Start with the given display filter.
- -z <statistics-string>
- Get Wireshark to collect various types of statistics and display the result in a window that updates in semi-real time. For the currently implemented statistics consult the Wireshark manual page.
A very useful mechanism available in Wireshark is packet colorization. You can set up Wireshark so that it will colorize packets according to a display filter. This allows you to emphasize the packets you might be interested in.
You can find a lot of coloring rule examples at the Wireshark Wiki Coloring Rules page at https://wiki.wireshark.org/ColoringRules.
There are two types of coloring rules in Wireshark: temporary rules that are only in effect until you quit the program, and permanent rules that are saved in a preference file so that they are available the next time you run Wireshark.
Temporary rules can be added by selecting a packet and pressing the Ctrl key together with one of the number keys. This will create a coloring rule based on the currently selected conversation. It will try to create a conversation filter based on TCP first, then UDP, then IP and at last Ethernet. Temporary filters can also be created by selecting the → menu items when right-clicking in the packet detail pane.
To permanently colorize packets, select → . Wireshark will display the “Coloring Rules” dialog box as shown in Figure 11.1, “The “Coloring Rules” dialog box”.
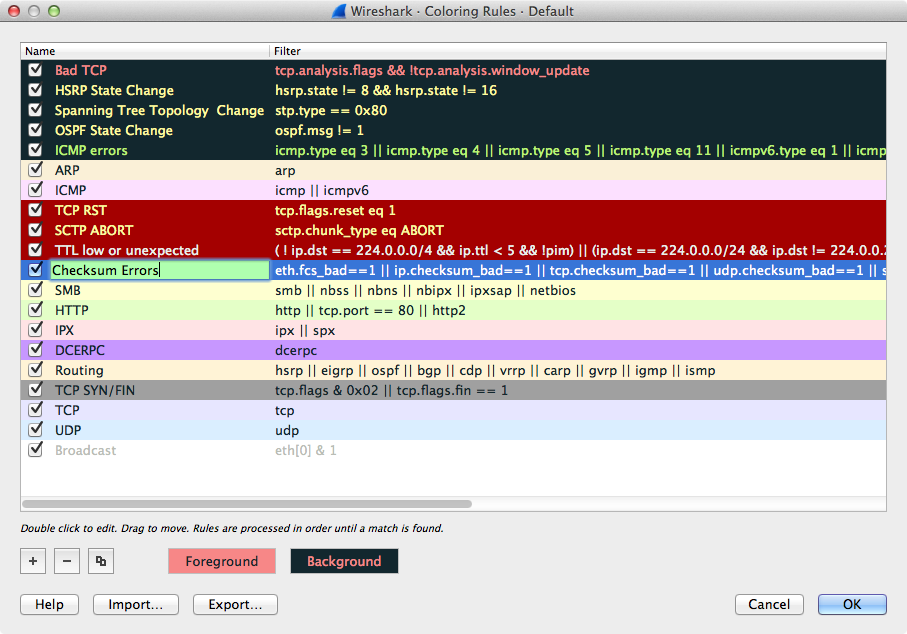
If this is the first time using the Coloring Rules dialog and you’re using the default configuration profile you should see the default rules, shown above.
|
The first match wins |
|---|---|
|
More specific rules should usually be listed before more general rules. For example, if you have a coloring rule for UDP before the one for DNS, the rule for DNS may not be applied (DNS is typically carried over UDP and the UDP rule will match first). |
You can create a new rule by clicking on the button. You can delete one or more rules by clicking the button. The “copy” button will duplicate a rule.
You can edit a rule by double-clicking on its name or filter. In Figure 11.1, “The “Coloring Rules” dialog box” the name of the rule “Checksum Errors” is being edited. Clicking on the and buttons will open a color chooser (Figure 11.2, “A color chooser”) for the foreground (text) and background colors respectively.

The color chooser appearance depends on your operating system. The macOS color picker is shown. Select the color you desire for the selected packets and click .
Figure 11.3, “Using color filters with Wireshark” shows an example of several color filters being used in Wireshark. Note that the frame detail shows that the “Bad TCP” rule was applied, along with the matching filter.
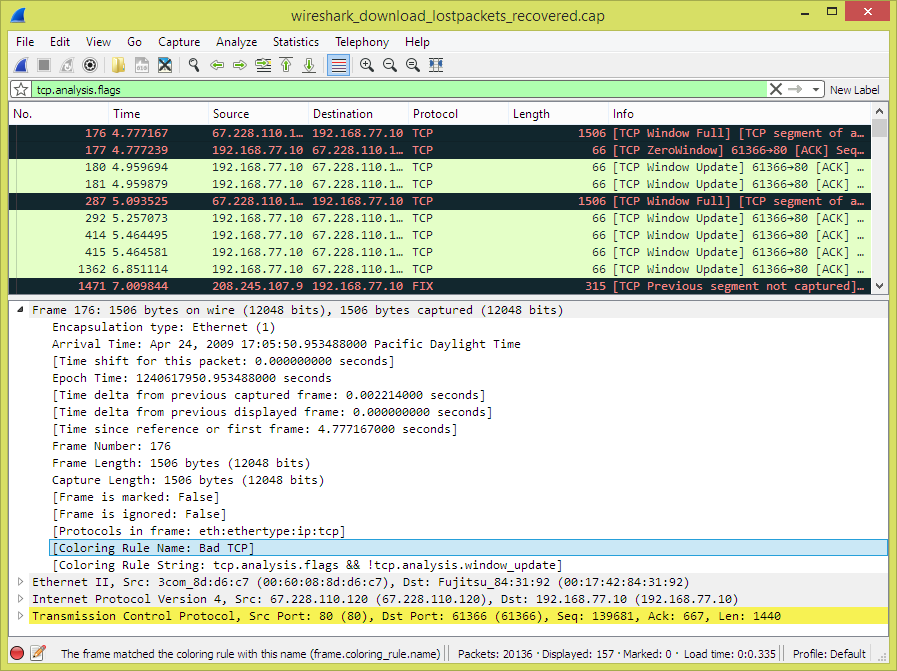
The user can control how protocols are dissected.
Each protocol has its own dissector, so dissecting a complete packet will typically involve several dissectors. As Wireshark tries to find the right dissector for each packet (using static “routes” and heuristics “guessing”), it might choose the wrong dissector in your specific case. For example, Wireshark won’t know if you use a common protocol on an uncommon TCP port, e.g., using HTTP on TCP port 800 instead of the standard port 80.
There are two ways to control the relations between protocol dissectors: disable a protocol dissector completely or temporarily divert the way Wireshark calls the dissectors.
The Enabled Protocols dialog box lets you enable or disable specific protocols. Most protocols are enabled by default. When a protocol is disabled, Wireshark stops processing a packet whenever that protocol is encountered.
|
Note |
|---|---|
|
Disabling a protocol will prevent information about higher-layer protocols from being displayed. For example, suppose you disabled the IP protocol and selected a packet containing Ethernet, IP, TCP, and HTTP information. The Ethernet information would be displayed, but the IP, TCP and HTTP information would not - disabling IP would prevent it and the higher-layer protocols from being displayed. |
To enable or disable protocols select → . Wireshark will pop up the “Enabled Protocols” dialog box as shown in Figure 11.4, “The “Enabled Protocols” dialog box”.
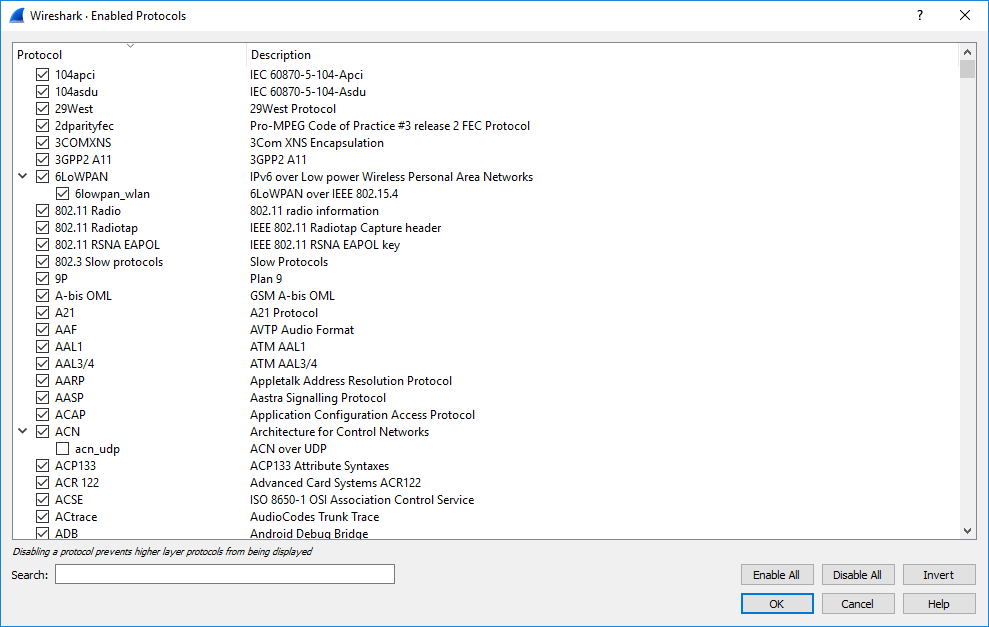
To disable or enable a protocol, simply click the checkbox using the mouse. The search functionality can be used to quickly find the protocol dissector you want to disable or enable by limiting the list of protocols displayed.
The Search field is case-insensitive and matches any protocol dissector that contains the search string in its name. Typing a few letters of the protocol name in the search box will limit the list to those dissectors that contain these letters.
The first drop down menu allows you to limit the search to enabled or disabled protocol dissectors, while the second drop down menu allows you to limit the search to heuristic and non-heuristic dissectors.
Heuristic dissectors are dissectors that are not identified by a known relationship to other dissectors (i.e. IANA registered port number) but by heuristics "guessing" based on the content of the packet (i.e. A set sequence of bytes at the start of a packet). Disabling a heuristic dissector will prevent it from being used in the heuristics process, but it may still be used if it is identified by a known relationship to other dissectors. Heuristic protocol dissectors are identified as subtrees in the protocol list.
You can choose from the following actions:
- Enable all protocols in the list.
- Disable all protocols in the list.
- Toggle the state of all protocols in the list.
- Save and apply the changes and close the dialog box, see Section A.2.4, “[Stream setup by PROTOCOL (frame 123)]” for details.
- Cancel the changes and close the dialog box.
The “Decode As” functionality lets you override what protocol is called under specific circumstances. This might be useful if Wireshark is incorrectly choosing which dissector to use for a particular TCP port, for example, or if you do some uncommon experiments on your network.
|
Note |
|---|---|
|
Not all protocols support this feature, and not just any protocol field can be used to override Wireshark’s choice of dissector. |
Decode As is accessed by selecting the → . Wireshark will pop up the “Decode As” dialog box as shown in Figure 11.5, “The “Decode As” dialog box”.
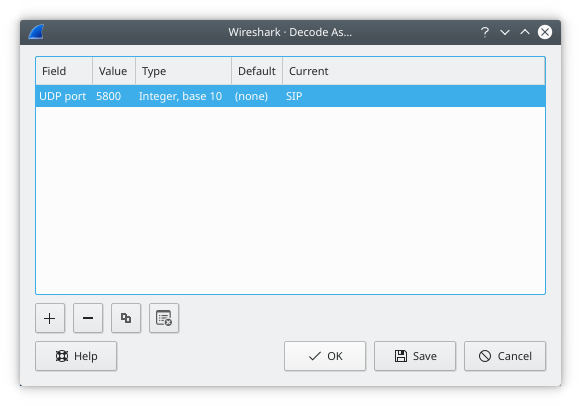
In this dialog you are able to edit entries by means of the edit buttons on the left.
You can also pop up this dialog box from the context menu in the “Packet List” or “Packet Details” panes. It will then contain a new line based on the currently selected packet.
These settings will be lost if you quit Wireshark or change profile unless you save the entries.
- Add new entry for selected packet
- Remove the selected entry.
- Copy the selected entry.
- Clear the list of user specified decodes.
- Apply the user specified decodes and close the dialog box.
- Save and apply the user specified decodes and close the dialog box.
- Cancel the changes and close the dialog box.
Each entry in this dialog will have the following columns. You can double-click on an entry’s field to change its value, as long as it’s not an informational (read-only) field.
| Heading | Description |
|---|---|
Field |
The field whose value should be examined when determining the dissector to use. Double-click to show a list of all fields which are supported for this feature. |
Value |
The specific value of the chosen field which should indicate to Wireshark to use your chosen dissector override. |
Type |
Read-only. Shows the type of the chosen field’s value; for example, integer or string. |
Default |
Read-only. Shows what dissector would normally be called if the chosen field had the chosen value. |
Current |
The dissector you wish to be called instead. You will only be able to choose dissectors for protocols which could be directly carried by the containing protocol. For example, you cannot specify that data carried over TCP should be passed to the Ethernet dissector. |
|
Tip |
|---|---|
|
You can also specify “Decode As” entries on the Wireshark or tshark
command line. See the documentation of the |
There are a large number of preferences you can set. Simply select the → ( → on macOS) and Wireshark will pop up the Preferences dialog box as shown in Figure 11.6, “The preferences dialog box”, with the “Appearance” page as default. On the left side is a tree where you can select the page to be shown.
- The button will apply the preferences settings and close the dialog.
- The button will restore all preferences settings to the last saved state.
|
Tip |
|---|---|
|
You can also see a protocol’s preferences from the pop-up menus for the “Packet List” or “Packet Details” panes, by going to the Protocol Preferences menu item, which will pop open a sub-menu. The top entry in this new menu will take you to the Preferences dialog box as shown in Figure 11.6, “The preferences dialog box”, with the chosen protocol’s page showing. The final entry in this menu will completely disable the dissection of the chosen protocol. See Section 11.4.1, “The “Enabled Protocols” dialog box” for how to re-enable the protocol. Any other entries in this menu will let you quickly adjust individual preferences for this protocol without needing to open the full Preferences dialog box. |
These preferences give you the option to control the makeup of the GUI.
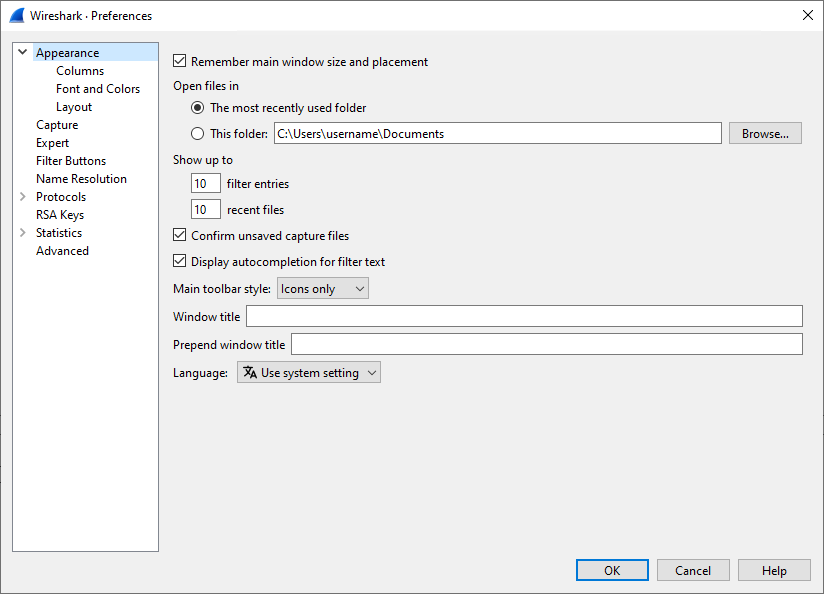
Selecting Remember main window size and placement allow for a repeatable experience when restarting Wireshark.
Selecting Open files in allows you to determine where to start the file selection dialog when opening capture files.
The preference Show up to allows you to determine how much history is tracked for display filter entries and recent files shown in the main application window.
Selecting Confirm unsaved capture files causes a dialog to appear when closing a capture file when it was not yet saved. This may help preventing inadvertent loss of data, eg., when Wireshark is closed.
Selecting Display autocompletion for filter text causes a drop down list to appear when you enter a display filter. This drop down list contains known display filters for easy selection.
The preference Main toolbar style allows you to tailor the toolbar style in one of three ways.
The Wireshark main window title is replaced by the name of the opened capture file. The preferences Window title and Prepend window title allow you to add bracketed strings after and before the window title. These window title strings can contain variables which will be replaced by their respective values.
The following variables are available.
- %C = Capture comment from command line
- %F = File path of the capture file
- %P = Currently selected profile name
- %S = Conditional separator (dash) that only shows when surrounded by variables with values or static text
- %V = Wireshark version info
The Language preference allows you to select the language used in the GUI. Note that the protocol information and details are kept in the language commonly used in this field, that being English.
These preferences give you the option to control the definition of the columns shown in the packet list, once a capture file is loaded.
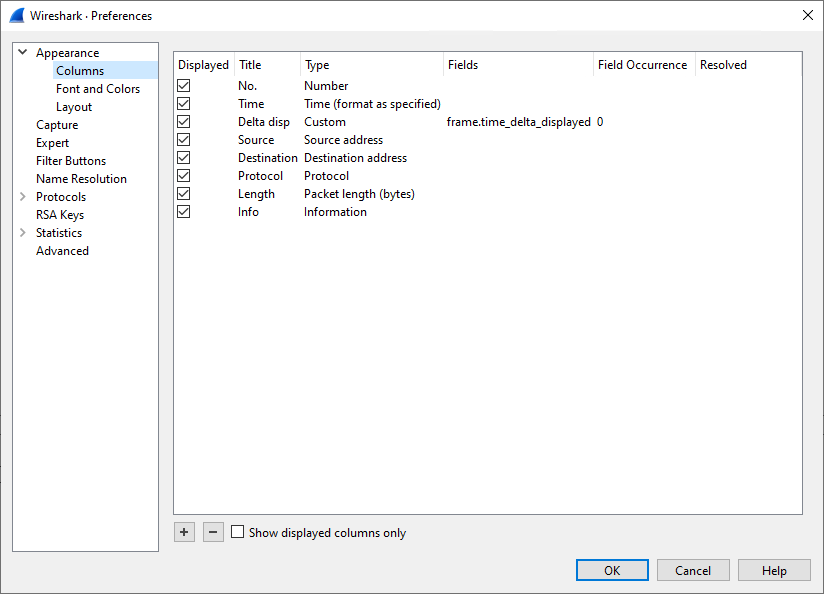
- Add new entry to the list.
- Remove the selected entry.
Selecting Show displayed columns only hides all non-displayed columns from the list, possibly making navigating the list easier.
The rows can be dragged and dropped to arrange them in the desired order.
The columns in the entries are as follows.
Selecting Displayed causes the column to be shown in the packet list.
The Title is the text shown in the header of the column in the packet list.
The Type is the type of value to be shown. This can be a predefined type, ie. a value in a defined format, or custom.
The following settings are applicable when the Type is set to "custom"
The Fields setting is the display filter name of the field to be shown in the column in the packet list.
The Field Occurrence setting is the count of the given field in the frame, for fields that appear more than once in a frame.
Selecting Resolved causes name resolution to be applied to the field value, when available.
The Width is the width of the column.
The Alignment is the alignment of the text in the column.
These preferences allow you to define the layout of the GUI once a capture file is loaded.
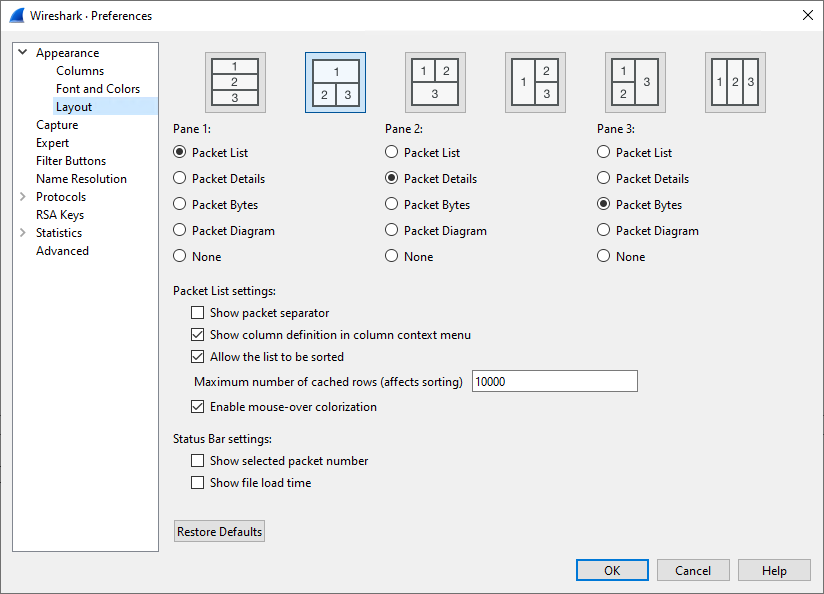
Make sure that you have at least one pane configured to contain the Packet list. Three panes can be active at the same time and they can be laid out as shown in the top layer. The exact sizes of these panes can be changed as needed once a capture file is opened.
Selecting Show packet list separator causes the packet list entries to be slightly set apart, which may improve readability at the cost of the amount of packets shown in the packet list.
Selecting Show column definition in column context menu make the column context menu wider to show the currently configured field type for the column. This may help identify the column to select or modify.
Selecting Allow the list to be sorted enables the sort operator on all the columns. This may prevent inadvertently triggering a sort, which may take considerable time for larger capture files.
The Maximum number of cached rows setting determines how much packet list information is cached to speed up sort operations, where a larger number causes more memory to be consumed by the cache. Be aware that changing other dissection settings may invalidate the cache content.
Selecting Enable mouse-over colorization enables the highlighting of the currently pointed to packet in the packet list. The currently selected packet is always highlighted.
Selecting Show selected packet number adds the selected packet number to the capture file details in the status bar, taking up some space in the status bar.
Selecting Show file load time adds the time it took to load the capture file to the status bar, taking up some space in the status bar.
The button Restore Defaults allows you to get back to a working basic configuration.
These preferences let you choose the application theme, the light or dark appearance mode, and the font used in the packet panes.
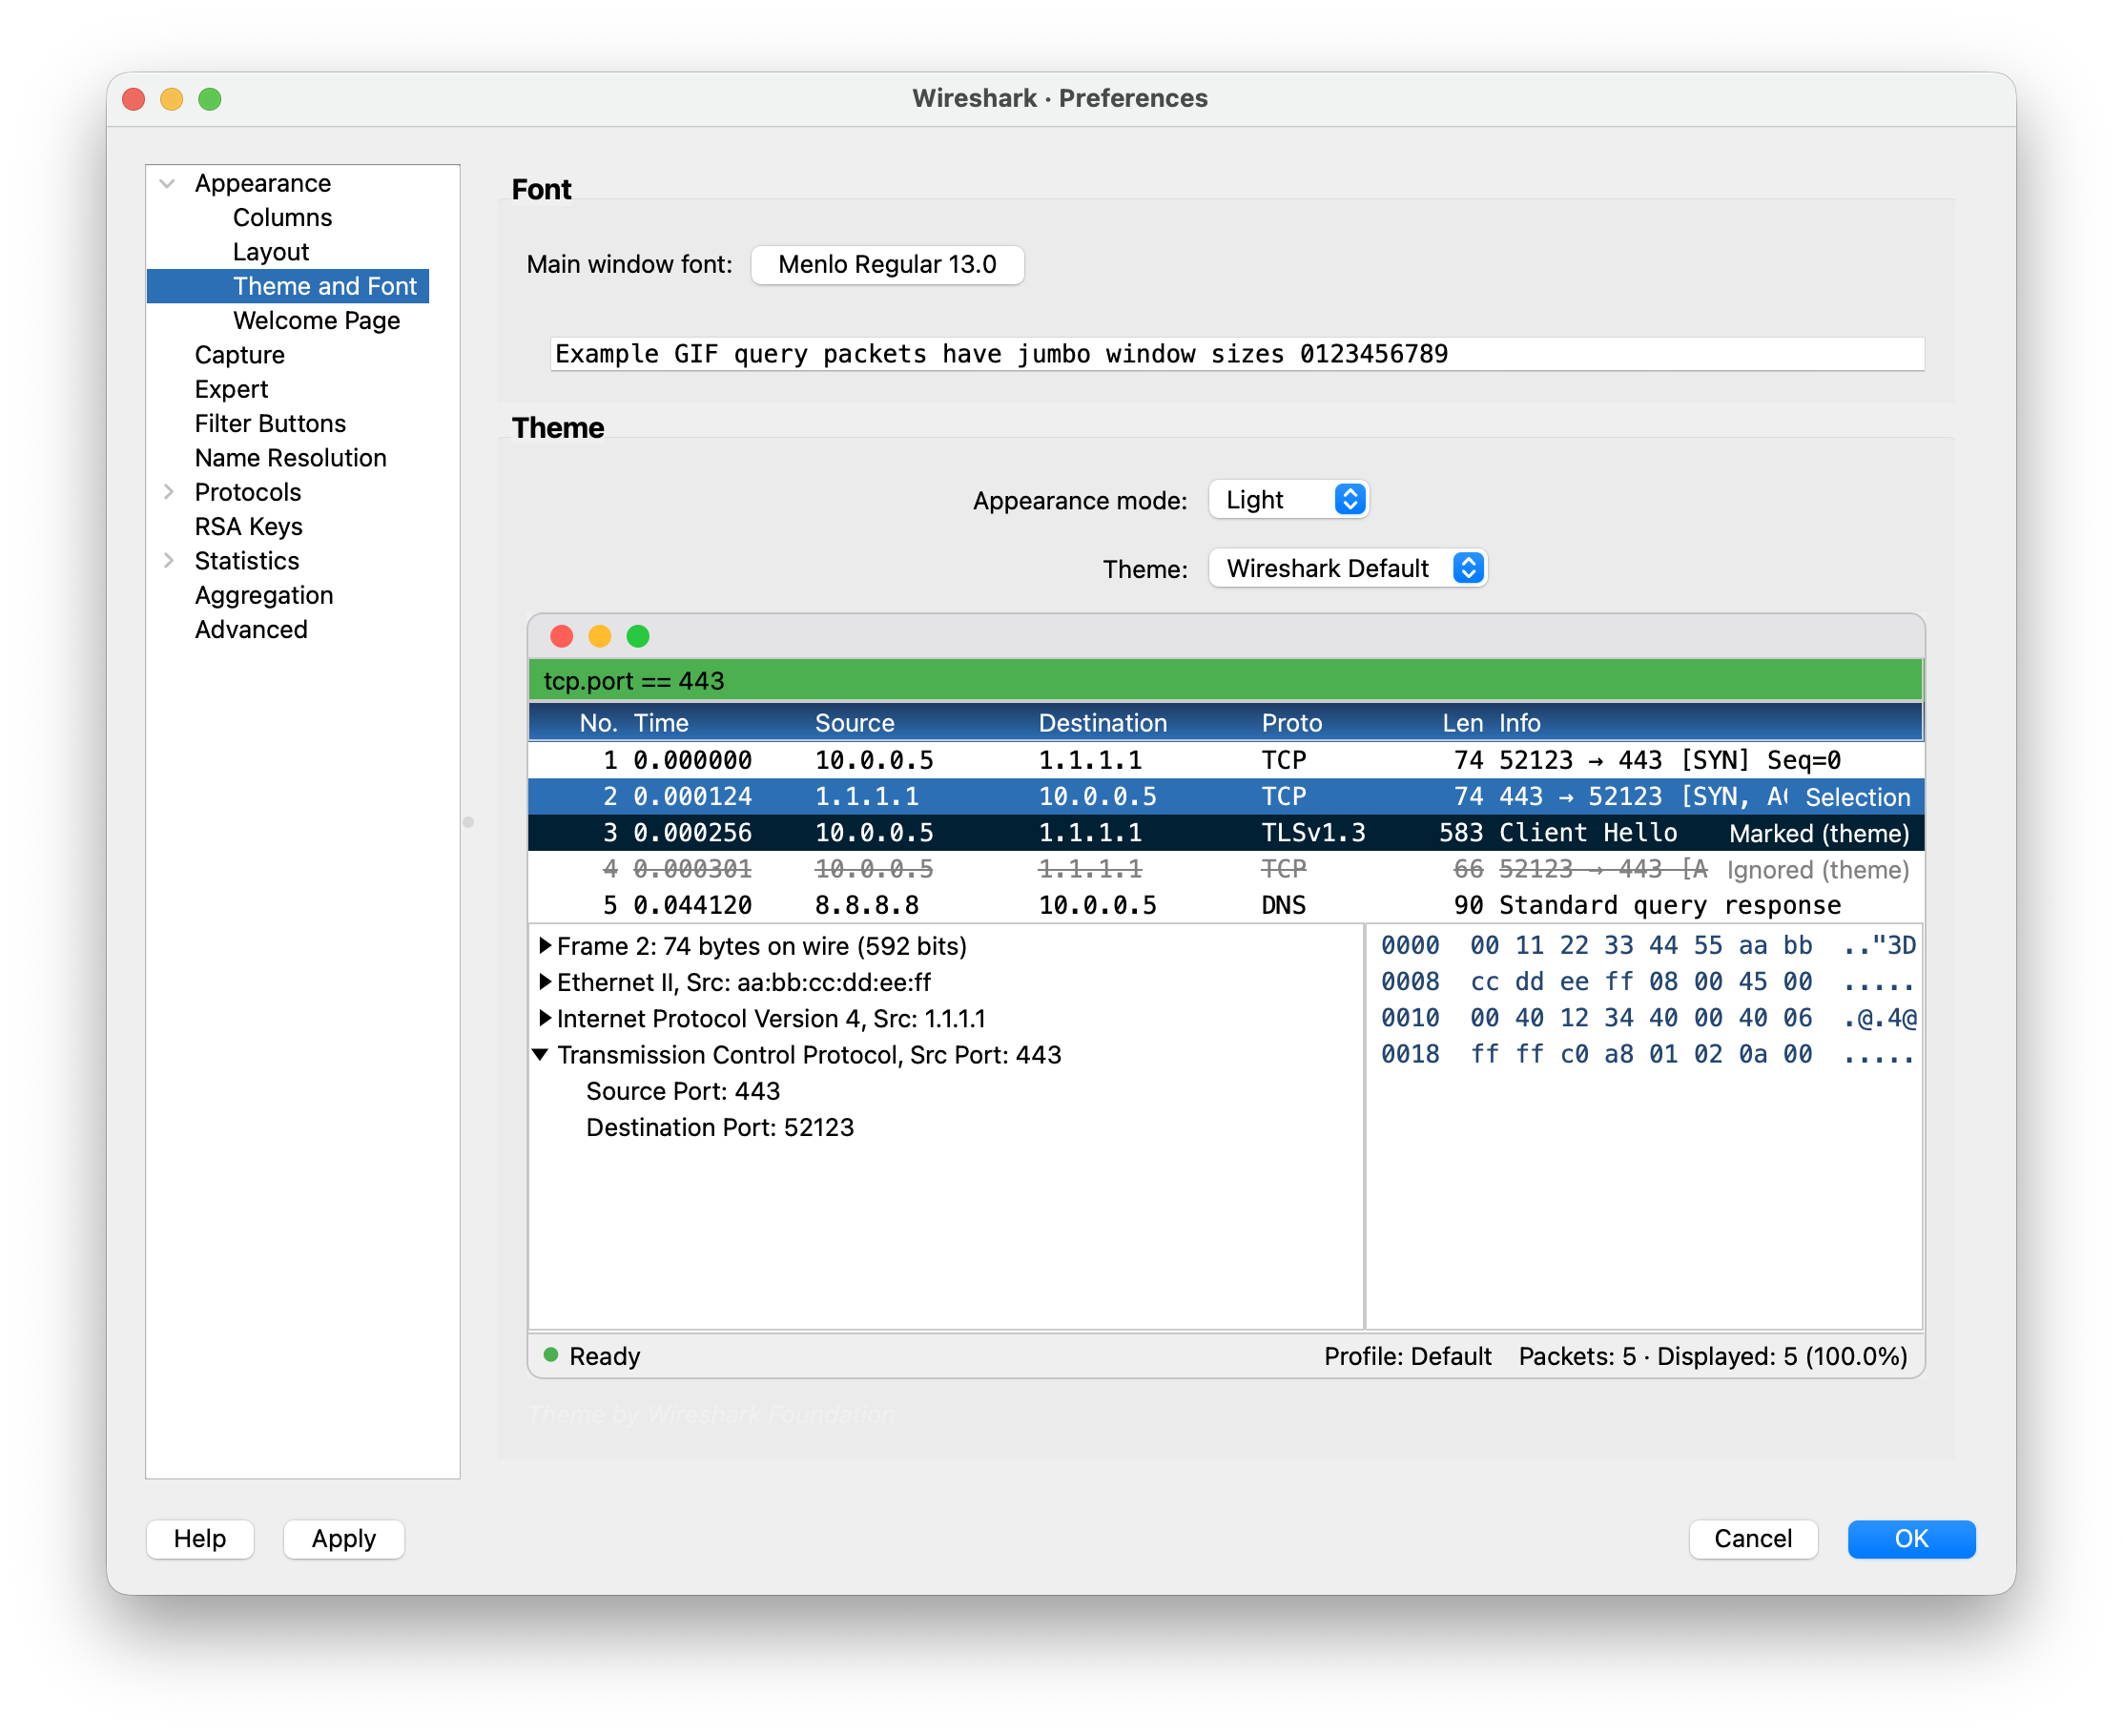
The Main window font button opens a font chooser for the font used in the packet list, the packet details and the other packet panes. A mono spaced font usually gives the cleanest presentation, but a proportional font can be used as well. The sample text below the button previews the currently selected font.
The Appearance mode setting controls whether Wireshark uses a light or a dark color scheme. System follows the operating system setting, while Light and Dark force the respective scheme regardless of the system setting.
The Theme setting selects the color theme applied to the application. Themes bundle the colors used throughout the GUI — including the packet list selection, marked and ignored packets, the “Follow Stream” client and server text, and valid and invalid display filter highlighting — so these colors are no longer configured individually. When the selected theme declares an author, it is shown below the preview.
|
Note |
|---|---|
|
The individual color settings from earlier versions of Wireshark (for example marked and ignored packets, the “Follow Stream” client and server text, display filter validity, and the selected packet) have been removed. These colors now come from the selected theme. |
The preview shows a mockup of a capture window rendered with the selected theme and appearance mode, so you can see how the combination will look before applying it. Changes to the appearance mode and theme take effect once you accept the preferences dialog with ; the preview itself updates immediately as you try different combinations.
In addition to the themes bundled with the application, Wireshark looks for user-supplied themes in a personal themes directory:
- On Unix-like systems: $HOME/.local/lib/wireshark/themes
- On Windows: %APPDATA%\Wireshark\themes
(For Stratoshark, replace wireshark / Wireshark with stratoshark / Stratoshark.)
Personal themes are single .jsonc files dropped directly into that directory — there is no per-theme subdirectory. The filename (without the .jsonc extension) becomes the theme’s internal name and is what appears in the Theme dropdown. For example, midnight.jsonc shows up as a selectable theme named midnight.
The exact path can also be seen under → in the Folders tab, labelled Personal Themes.
The file format is identical to the bundled themes; see the README.md next to the built-in default theme in the source distribution for the schema and the list of supported color tokens.
If a personal theme file shares a name with a built-in theme (for example default.jsonc), the built-in copy wins and the personal file is ignored with a warning on stderr. This guarantees that core themes the application falls back to can never be accidentally shadowed by a broken override.
These preferences allow you to define the layout of the GUI welcome page, before a capture file is loaded.
These preferences allow you to set the default conditions for packet capture.
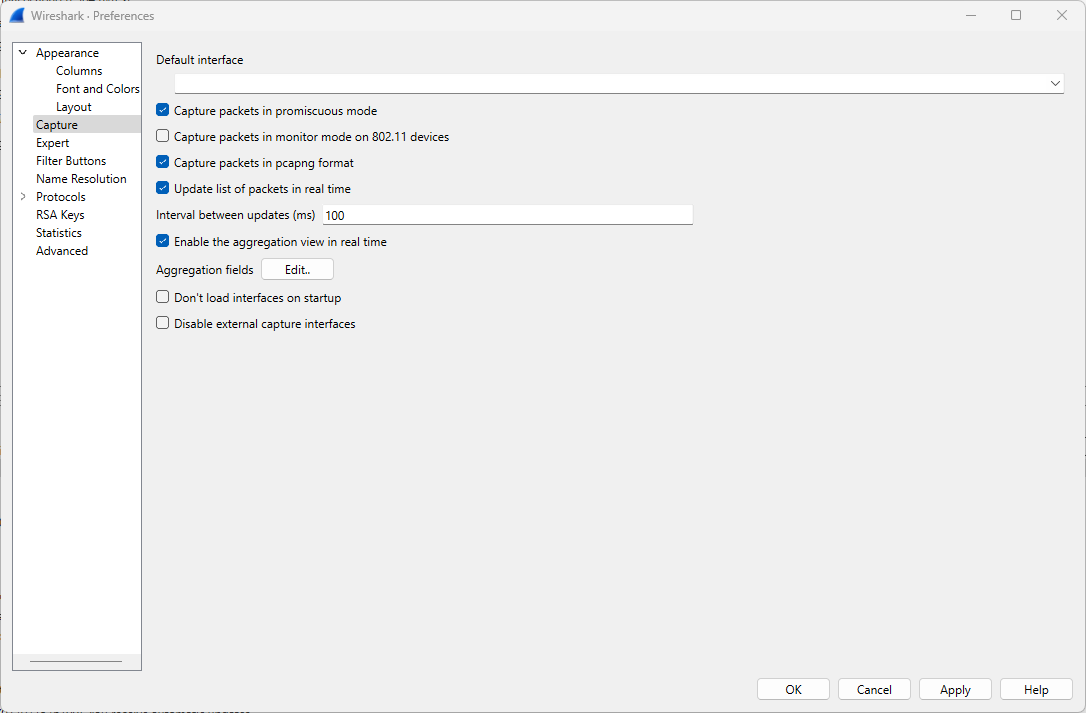
The default interface is the interface used for packet capture in case no other is selected on the opening page of GUI. Note that this can be multiple interfaces separated by a comma.
Selecting Capture packets in promiscuous mode causes the network interface(s) to capture on to be configured in promiscuous mode. This allows all (Ethernet) frames to be received by the network interface to be capture, not only those that are addressed to the capture interface.
Selecting Capture packets in monitor mode on 802.11 devices causes the WiFi interface(s) to capture on to be configured in monitor mode. This allows all WiFi frames to be received by the WiFi interface to be captured, not only those that are addressed to the capture interface. Results may vary, depending on the actual capabilities of the operating system, the WiFi driver software and WiFi interface itself.
Selecting Capture packets in pcapng format causes the Next-Generation packet capture file format to be used when capturing. This much more capable packet capture file format has many advantages over the original format, although not every external tool may be capable of handling packet captures in this format.
Selecting Update list of packets in real time causes the packet list to fill up and possibly scroll up during the packet capture process. This does give an insight in the packets captured, although it takes processing power to dissect the capture packets.
The preference Interval between updates (ms) allows you to configure how often the packet list is updated during the packet capture process. A higher interval reduces processing, but causes more delay between capture and display in the packet list.
Selecting Don’t load interfaces on startup prevents Wireshark from spawning dumpcap to populate the list of capture interfaces on the local system. This might be a time consuming operation delaying the start of the program, however on most systems this is not an issue. The interface list can always be populated after Wireshark is started via → .
Selecting Disable external capture interfaces prevents Wireshark from spawning extcap programs to list off their capture interfaces. This might be a time consuming operation delaying the start of the program, however on most systems this is not an issue.
These preferences allow you to configure the aggregation fields.
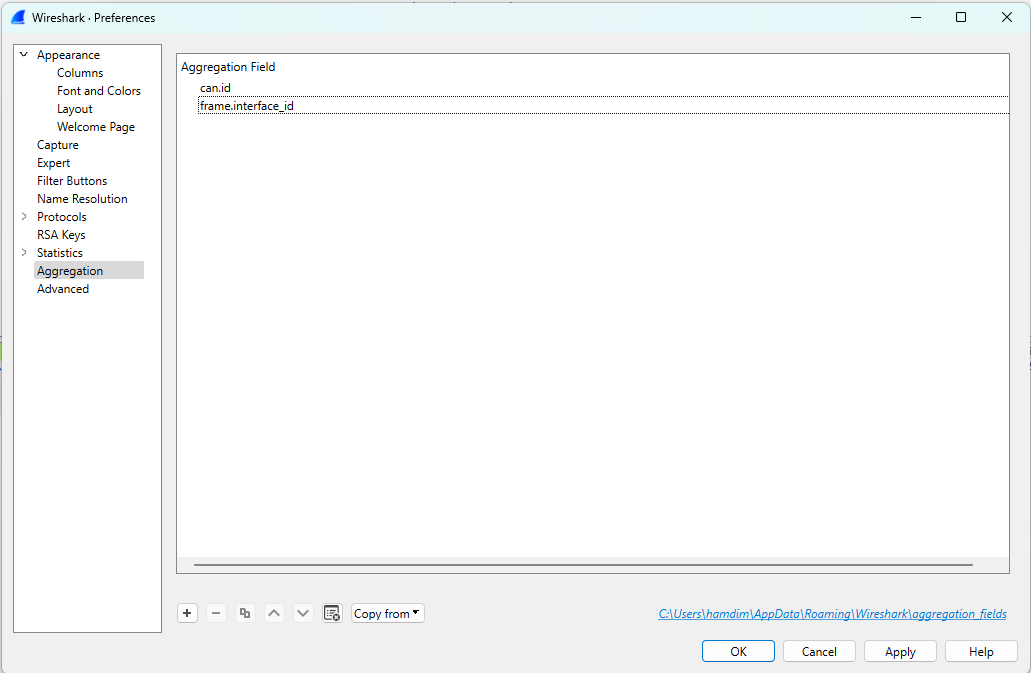
The preference Aggregation fields lets you choose which packet fields Wireshark uses to group packets in the Aggregation View. Packets with the same frame key appear in the same row. For example, on a CAN bus, you can use the CAN ID as the frame key. This way, all frames with the same CAN ID are grouped together, and the Aggregation View will show the most recently received frame for each CAN ID.
- Add new entry to the list.
- Remove the selected entry.
- Copy the selected entry.
- Move the selected entry up in the list.
- Move the selected entry down in the list.
- Clear the list of user specified aggregation fields.
- Copy the list of user specified aggregation fields from another profile.
These preferences allow you to modify the severity set for expert items.
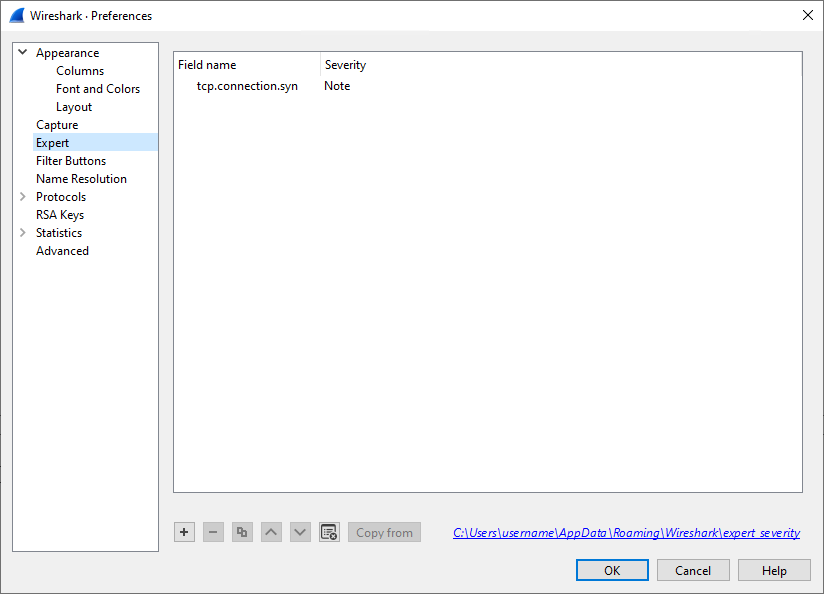
If, for whatever reason, you find that the severity for certain expert items does not match your needs you can change them here and have them used as such, showing up in the appropriate lists and overviews. Get the Field name from selecting the field in the packet details pane, then observe the name shown in the status bar. This is the name you enter on a new line in the list, while setting the desired Severity in the next column.
- Add new entry to the list.
- Remove the selected entry.
- Copy the selected entry.
- Move the selected entry up in the list.
- Move the selected entry down in the list.
- Clear the list of user specified expert item severities.
- Copy the list of user specified expert item severities from another profile.
Having quick access to regularly used display filter expressions can be a real productivity boost. Here you can define your own display filter buttons.
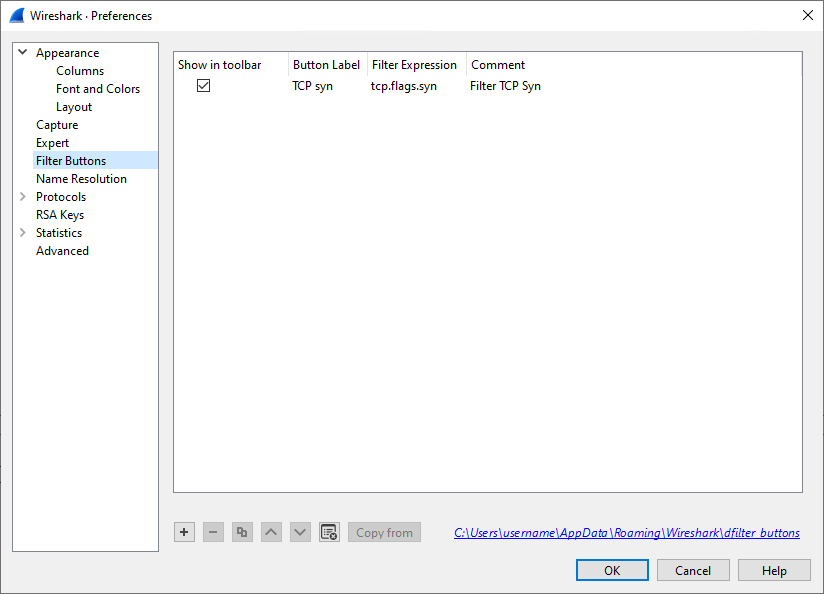
- Add new entry to the list.
- Remove the selected entry.
- Copy the selected entry.
- Move the selected entry up in the list.
- Move the selected entry down in the list.
- Clear the list of user specified display filter buttons.
- Copy the list of user specified display filter buttons from another profile.
The columns in the entries are as follows.
Selecting Show in toolbar causes the button to be shown in the toolbar besides the display filter text entry.
The Button Label is the text shown on the button in the toolbar. The use of a double slash causes the button to create a dropdown list to allow grouping of multiple buttons, e.g. TCP//Syn and TCP//Res.
The Filter Expression is the display filter expression entered into the display filter text entry when the button is clicked.
The Comment is the comment text which appears in a bubble when the mouse hovers over the button.
These preferences allow you to configure which numeric identifiers in protocols are translated into human readable text. For some of these identifiers the readable texts are read from configurable external sources.
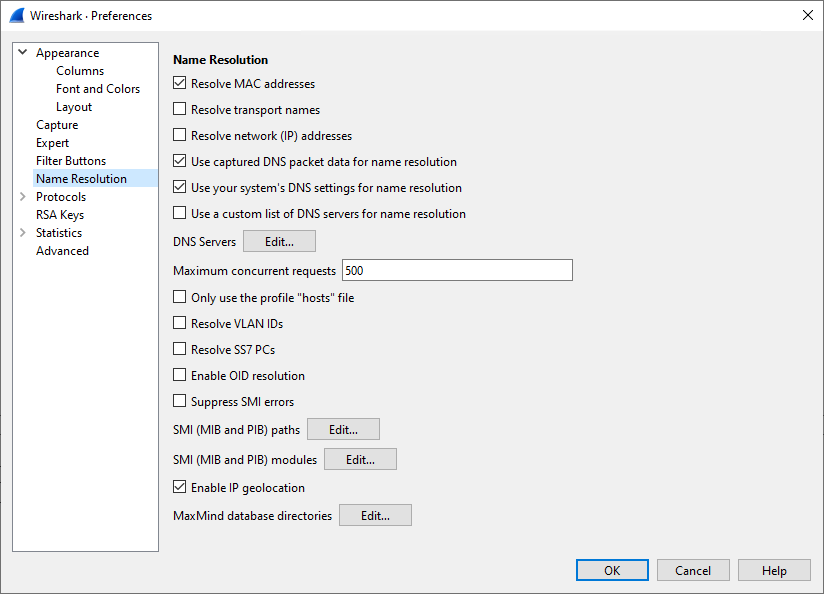
Selecting Resolve MAC addresses causes the OUI (Organizationally Unique Identifier) at the start of an Ethernet address to be translated into the name registered with the IEEE for that OUI.
Selecting Resolve transport names causes the UDP and TCP port numbers to be translated into the service registered to these ports by IANA.
Selecting Resolve network (IP) addresses causes IPv4, IPv6 and IPX addresses to be translated into their corresponding host name. To do this Wireshark reaches out to DNS servers to request names for addresses it finds in packets. There are several way to do this, which can be controlled through the following preferences.
Selecting Use captured DNS packet data for name resolution causes DNS response packets in the capture file to fill the network address resolution table. These can then be used to resolve addresses found in the packets.
Selecting Use SNI information from captured handshake packets causes TLS client hello packets with a Server Name Indication extension to fill the network address resolution table.
Selecting Use your system’s DNS settings for name resolution causes DNS requests to be made as would be for other network applications.
Selecting Use a custom list of DNS servers for name resolution causes DNS requests to be made to manually configured DNS servers.
The DNS Servers button provides access to the dialog to manage these manually configured DNS servers.
The Maximum concurrent requests input field allows you to limit the amount of DNS queries made at the same time.
Selecting Resolve VLAN IDs causes the file "vlans" to be read and used to name VLANs. This file has the simple format of one line per VLAN, starting wit VLAN ID, a tab character, followed by the name of the VLAN.
Selecting Resolve SS7 PCs causes the file "ss7pcs" to be read and used to name SS7 Point Codes. This file has the simple format of one line per Point Code, starting with Network Indicator, a dash, the Point Code in decimal, a tab character, followed by the name of the Point Code.
Selecting Enable OID resolution causes the SMI library to be initialized. This library is capable of loading MIB/PIB files to provide name resolution for SMI objects, as present in SNMP packets.
Selecting Suppress SMI errors prevents the SMI library from emitting error messages while loading MIB/PIB files. The SMI library is very sensitive to irregularities in these files often resulting in harmless error being emitted.
The SMI (MIB and PIB) paths button provides access to the dialog to manage the directories where the MIB/PIB files to be loaded can be found.
The SMI (MIB and PIB) modules button provides access to the dialog to manage the MIB/PIB modules to be loaded.
Selecting Enable IP geolocation causes the background MaxMind database IP geolocation resolver to be used to attempt to geolocate IP addresses in the packets.
The MaxMind database directories button provides access to the dialog to manage the directories where the MaxMind database files can be found. See Section 11.9, “MaxMind Database Paths”.
Wireshark supports quite a few protocols, which is reflected in the long list of child entries of the “Protocols” pane. You can jump to the preferences for a specific protocol by expanding “Protocols” and typing the first few letters of the protocol name.
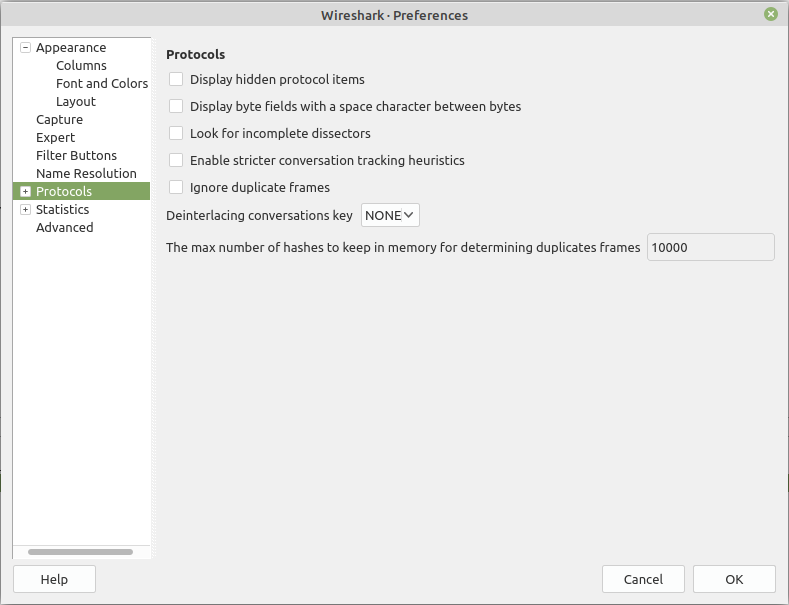
There are a few general protocol related preferences, listed below.
Selecting Display hidden protocol items influences what is shown in the packet details pane of the packet selected from the packet list. Some protocol dissectors add hidden protocol items that provide additional interpretations of the packet data, or with different display filter strings. These may or may not provide valuable information to the user and may clutter the output, therefor these items can be hidden.
Selecting Display byte fields with a space character between bytes influences the way a byte field in shown in the packet details pane of the packet selected in the packet list, if the dissector creates a byte field that is. The bytes in the byte field are normally shown as a concatenated sequence of hexadecimals. This preference allows you to get the representation of each byte separated by a space. This may improve readability of the individual bytes in the byte field.
The preference Format absolute times like asctime allows you to define how absolute times are formatted, in the columns and in the protocol tree. Either in the old format used in previous Wireshark versions, or using the more unambiguous method defined in ISO 8601.
Selecting Look for incomplete dissectors causes expert items to be added to the dissection of packet data for which the dissector does not create an interpretation. Dissectors should strive to not skip packet bytes and this preference allows you to be made aware of this.
Selecting Enable stricter conversation tracking heuristics allows dissectors to take more identifiers into consideration when creating "conversations". These are used to track related packets. The heuristics for these conversations are sensitive to mis-identification of packets, possibly corrupting conversation analysis. Adding more identifiers can reduce the change of this happening. Currently only the IPv4, ICMP and ICMPv6 dissector use this preference.
Selecting Ignore duplicate frames causes a duplicate frame to appear in the packet list, but flagged as ignored, hence not dissected. The determination of a duplicate frame is made based on the SHA256 hash of the bytes in the frame.
The preference Deinterlacing conversations key gives you options for deinterlacing the conversations, for the Ethernet encapsulation only. As opposed to hardware duplicates which show absolutely similar frames, capture duplicates are the consequence of the capture method (capture on multiple interfaces for example) and show similar payloads with one or more different fields. While NONE keeps the historical behaviour, the other options are built on three keys with the following meanings: V (VLAN), M (MAC Address), I (Interface). The presence of packets which seem to be duplicates because they have the same payload but aren’t filtered by the other preference Ignore duplicate frames, is a strong indication that a deinterlacing key is likely to change the interpretation. Check carefully the different values of Interface IDs, MAC Addresses, and VLAN Tags, to identify which deinterlacing key is appropriate for isolating the conversations and bringing the proper interpretation, but keep in mind that capturing on different interfaces or VLANs doesn’t necessarily mean that deinterlacing is needed.
When the deinterlacing key has any impact on the dissection, either the IPv4/IPv6 tabs of the Conversations dialog or the tuple values related to Ethernet or IPv4/IPv6 in the Conversation Hash Tables dialog will make this obvious (protocols supporting multiple incarnations of a connection such as TCP are harder to interpret and then rather not checked first).
The preference The max number of hashes to keep in memory for determining duplicate frames allows you to set how large the set of frames to consider for duplication is.
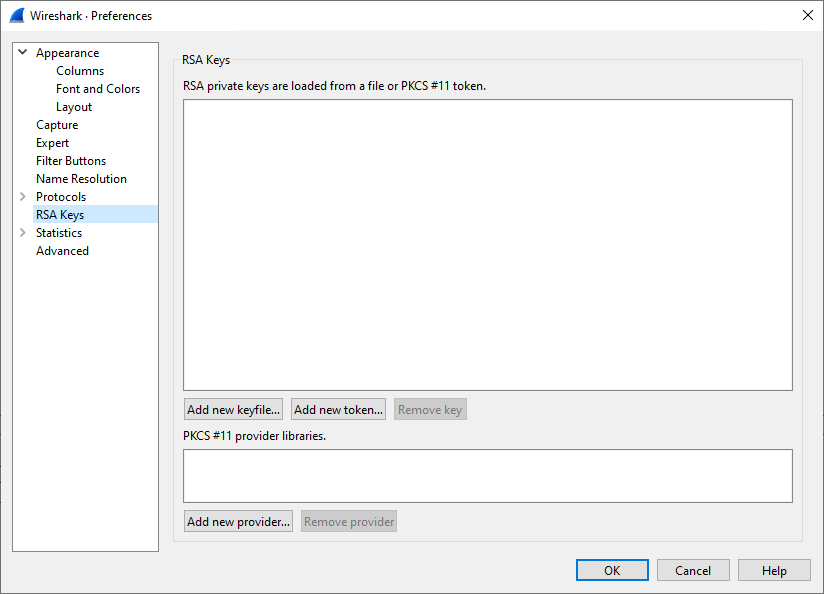
These preference have influence on the Statistics Tree (stats_tree) based dialogs accessible via the Statistics menu.
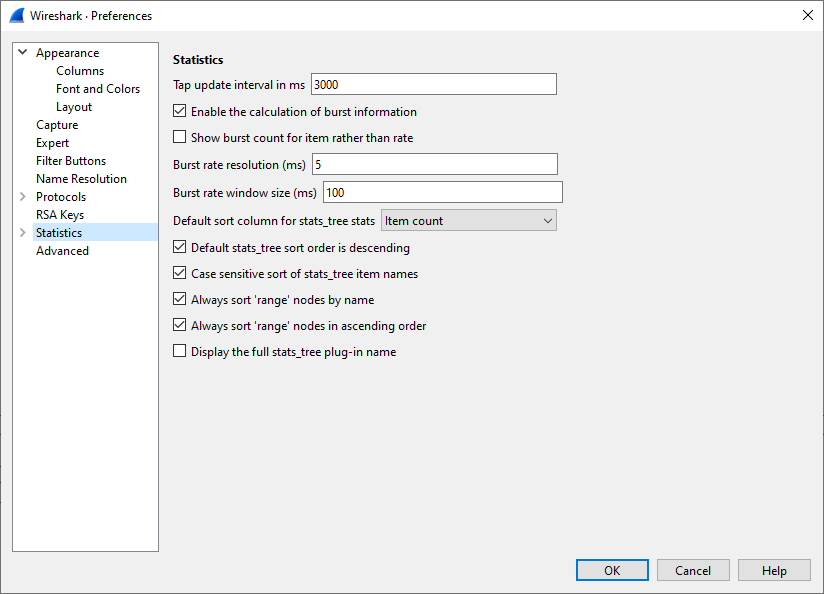
The preference Tap update interval in ms allows you to set how quickly protocol taps are being updated, partially determining the update speed of various dialogs and graphs.
The preference Maximum Flow Graph items to export as image allows you to set how dense or expansive the exported graph may become.
Selecting Enable the calculation of burst information allows the Statistics Tree system to calculate burst information.
Selecting Show burst count for item rather than rate allows the statistics nodes to show the count of events within the burst window instead of a burst rate. Burst rate is calculated as number of events within burst window divided by the burst window length.
The preference Burst rate resolution (ms) sets the duration of the time interval into which events are grouped when calculating the burst rate. Setting a higher resolution (ie., a smaller number) increases processing overhead.
The preference Burst rate window size (ms) sets the duration of the sliding window during which the burst rate is measured. Longer window relative to burst rate resolution increases processing overhead. This value will be truncated to a multiple of the Burst rate resolution preference setting.
The preference Default sort column for stats_tree stats gives you to option to select one of the columns to sort on.
Selecting Default stats_tree sort order is descending causes a descending sort order based on the previously selected column.
Selecting Case sensitive sort of stats_tree item names causes a case sensitive sort based on the previous selected order and column.
Selecting Always sort 'range' nodes by name causes the sort to take place by name rather than values.
Selecting Always sort 'range' nodes in ascending order makes an exception for range nodes to the previously selected sort order.
Selecting Display the full stats_tree plug-in name causes the full menu path of the Statistics Tree plugin to be shown in the title.
The preference Default output format allows you to select how you want the statistics to be saved by default, either as plain text or some structured format.
The “Advanced” pane will let you view and edit all of Wireshark’s preferences, similar to about:config and chrome:flags in the Firefox and Chrome web browsers.
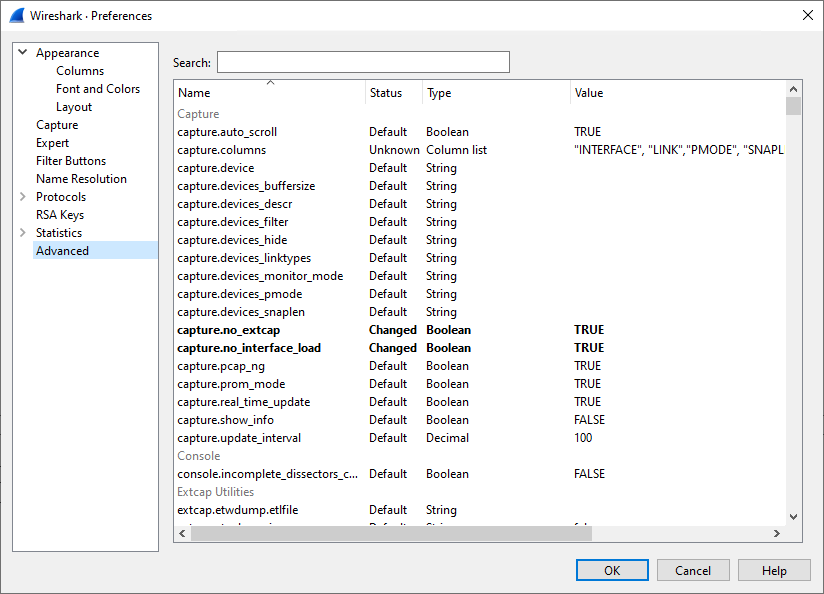
You can search for a preference by typing text into the “Search” entry. The search text will be matched against the internal name of the preference, but also associated help texts in order to improve discoverability.
Selecting Show changed values restricts the list to settings having non-default values. This may help finding what has changed more easily.
You can also pass preference names to Wireshark and TShark on the command line. For example, the gui.prepend_window_title can be used to differentiate between different instances of Wireshark on your screen:
$ wireshark -o "gui.prepend_window_title:LAN" & $ wireshark -o "gui.prepend_window_title:External Network" &
For more information, including how to specify a User Accessible Table
entry on the command line, see the documentation for -o in Section 11.2, “Start Wireshark from the command line”.
Configuration Profiles can be used to configure and use more than one set of preferences and configurations. Select the → menu item or press Shift+Ctrl+A or Shift+Cmd+A (macOS) and Wireshark will pop up the Configuration Profiles dialog box as shown in Figure 11.19, “The configuration profiles dialog box”. It is also possible to click in the “Profile” part of the statusbar to popup a menu with available Configuration Profiles (Figure 3.23, “The Statusbar with a configuration profile menu”).
Configuration files stored in each profile include:
- Preferences (preferences) (Section 11.5, “Preferences”)
- Capture Filters (cfilters) (Section 6.6, “Defining And Saving Filters”)
- Display Filters (dfilters) (Section 6.6, “Defining And Saving Filters”)
- Display Filter Macros (dmacros) (Section 6.7, “Defining And Saving Filter Macros”)
- Coloring Rules (colorfilters) (Section 11.3, “Packet colorization”)
- Disabled Protocols (disabled_protos) (Section 11.4.1, “The “Enabled Protocols” dialog box”)
- Most User Accessible Tables (Section 11.7, “User Accessible Tables”)
- Changed dissector assignments (decode_as_entries), which can be set in the “Decode As…” dialog box (Section 11.4.2, “User Specified Decodes”).
- Some recent settings (recent), such as pane sizes in the Main window (Section 3.3, “The Main window”), column widths in the packet list (Section 3.18, “The “Packet List” Pane”), all selections in the menu (Section 3.7, “The “View” Menu”) and the last directory navigated to in the “File Open” dialog.
All other configurations are stored in the personal configuration folder and are common to all profiles.
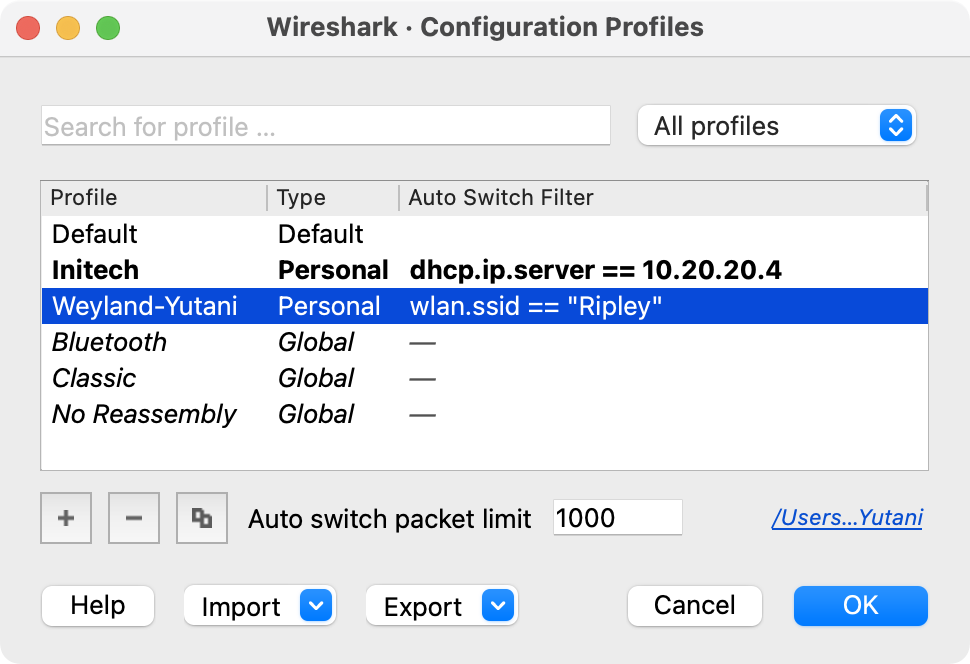
- Search for profile …
- The list of profiles can be filtered by entering part of the profile’s name into the search box.
- Type selection
-
Profiles can be filtered between displaying "All profiles", "Personal profiles" and "Global profiles"
- Personal profiles - these are profiles stored in the user’s configuration directory
- Global profiles - these are profiles provided with Wireshark
- New (+)
- Create a new profile. The name of the created profile is “New profile” and is highlighted so that you can more easily change it.
- Delete (-)
- Deletes the selected profile. This includes all configuration files used in this profile. Multiple profiles can be selected and deleted at the same time. It is not possible to delete the “Default” profile or global profiles. Deletion of the "Default" profile will reset this profile.
- Copy
- Copies the selected profile. This copies the configuration of the profile currently selected in the list. The name of the created profile is the same as the copied profile, with the text “(copy)” and is highlighted so that you can more easily change it.
- Auto switch packet limit
- The number of packets to check for automatic profile switching, described below. Setting this to zero disables automatic profile switching.
- Profiles can be imported from zip-archives as well as directly from directory structures. Profiles, which already exist by name will be skipped, as well as profiles named "Default".
- Profiles can be exported to a zip-archive. Global profiles, as well as the default profile will be skipped during export. Profiles can be selected in the list individually and only the selected profiles will be exported
- This button saves all changes, applies the selected profile and closes the dialog.
- Close this dialog. This will discard unsaved settings, new profiles will not be added and deleted profiles will not be deleted.
- Show this help page.
You can configure Wireshark to automatically change configuration profiles by adding a display filter to the "Auto Switch Filter" setting for a profile. When you open a capture file, Wireshark will check each filter against a limited number of packets and will switch to the first profile with a matching filter. The number of packets is determined by the "Auto switch packet limit" setting, and a limit of 0 will disable this feature. Manually changing your profile will disable this behavior until you open a different capture file.
User Accessible Tables (UATs) are a type of preference table which may be associated with particular protocols or with the application as a whole.
User Accessible Tables have a common editor dialog which works as described in Section 11.5.8, “Expert Items” and Section 11.5.9, “Filter Buttons”. Note that the name of the file appears in the lower right corner of the dialog.
The files are saved in a CSV format, where values are either double quoted ASCII strings (using C-style backslash escapes for non-printable characters) or unquoted hexstrings, depending on the field type. They can be edited directly when Wireshark is not running, though this is discouraged. Entries can also be appended to the table by passing an appropriate CSV formatted record string on the command line.
Most UATs are stored in the configuration profile:
- Custom HTTP headers (custom_http_header_fields)
- Custom IMF headers (imf_header_fields)
- Custom LDAP AttributeValue types (custom_ldap_attribute_types)
- Display Filter Buttons (dfilter_buttons)
- Display Filter Macros (dfilter_macros), prior to Wireshark 4.4
- DNS Servers (addr_resolve_dns_servers)
- ESS Category Attributes (ess_category_attributes)
- Expert Item Severity (expert_severity)
- IEEE 802.11 WLAN Decryption Keys (80211_keys)
- IKEv2 decryption table (ikev2_decryption_table)
- I/O Graphs (io_graphs)
- Plots (plots)
- K12 Protocols (k12_protos)
- Object Identifier Names and Associated Syntaxes ()
- Packet Lengths (packet_lengths)
- PRES Users Context List (pres_context_list)
- SCCP Users Table (sccp_users)
- SNMP Enterprise Specific Trap Types (snmp_specific_traps)
- SNMP Users (snmp_users)
- User DLTs Table (user_dlts)
- Protobuf Search Paths (protobuf_search_paths)
- Protobuf UDP Message Types (protobuf_udp_message_types)
Other UATs are stored in the personal configuration directory and are common to all profiles:
- MaxMind Database Paths (maxmind_db_paths)
- RSA Private Keys (rsa_keys) and PKCS #11 Provider Libraries (pkcs11_libs)
- SMI Modules (smi_modules) and SMI Paths (smi_paths)
Wireshark uses this table to map ESS Security Category attributes to textual representations. The values to put in this table are usually found in an XML SPIF, which is used for defining security labels.
This table is a user table, as described in Section 11.7, “User Accessible Tables”, with the following fields:
- Tag Set
- An Object Identifier representing the Category Tag Set.
- Value
- The value (Label And Cert Value) representing the Category.
- Name
- The textual representation for the value.
If your copy of Wireshark supports MaxMind’s MaxMindDB library, you can use their databases to match IP addresses to countries, cites, autonomous system numbers, and other bits of information. Some databases are available at no cost for registered users, while others require a licensing fee. See the MaxMind web site for more information.
The configuration for the MaxMind database is a user table, as described in Section 11.7, “User Accessible Tables”, with the following fields:
- Database pathname
- This specifies a directory containing MaxMind data files. Any files ending with .mmdb will be automatically loaded.
By default Wireshark will always search for data files in
/usr/share/GeoIP and /var/lib/GeoIP on non-Windows platforms
and in C:\ProgramData\GeoIP and C:\GeoIP on Windows. You can
put any additional search paths here, e.g. C:\Program Files\Wireshark\GeoIP
might be a good choice on Windows.
|
Note |
|---|---|
|
While the default search paths are not listed in the user table, they are in the list viewable by opening → and selecting the "Folders" tab. |
Previous versions of Wireshark supported MaxMind’s original GeoIP Legacy database format. They were configured similar to MaxMindDB files above, except GeoIP files must begin with Geo and end with .dat. They are no longer supported and MaxMind stopped distributing GeoLite Legacy databases in April 2018.
Wireshark can decrypt WEP and WPA/WPA2/WPA3 in pre-shared (or personal) mode, as well as in enterprise mode. Security improvements in more recent 802.11 releases require distinct session keys, instead of being able to decipher all traffic to a given access point with a single known password and SSID.
You can add decryption keys using Wireshark’s IEEE 802.11 preferences. Up to 64 keys are supported.
Go to → → → , or, from the pop-up menu in the "Packet List" or "Packet Details" pane from a frame that contains IEEE 802.11, → . You should see a window that looks like this:
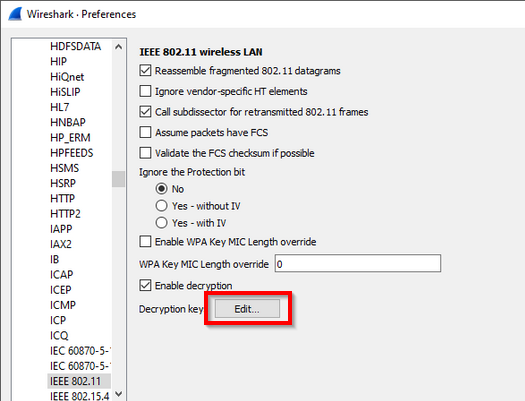
Click on the "Edit…" button next to "Decryption Keys" to add keys. You should see a window that looks like this:
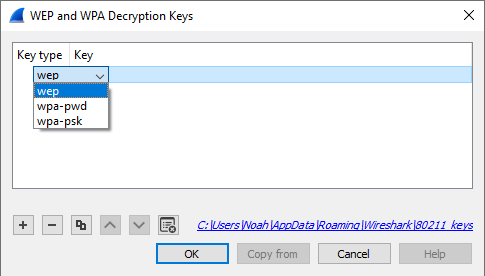
When you click the + button to add a new key, there are five key types you can choose from: wep, wpa-pwd, wpa-psk, tk, or msk. The correct key type(s) depend on the Cipher Suite and Authentication and Key Management Suite (AKMS) used to encrypt the wireless traffic.
- wep
-
The key must be provided as a string of hexadecimal numbers, with or without colons, and will be parsed as a WEP key. WEP keys can be 40-bit (5 bytes, or 10 hexadecimal characters), 104-bit, or occasionally 128-bit:
a1:b2:c3:d4:e5
0102030405060708090a0b0c0d
- wpa-pwd
-
The password and SSID are used to create a raw pre-shared WPA key. The password can be between 8 and 63 characters, and the SSID can be up to 32 bytes. (Typically both are printable ASCII, but that is not a hard limitation of the specification, only a recommendation.)
MyPassword:MySSID
You can optionally omit the colon and SSID, and Wireshark will try to decrypt packets using the last-seen SSID. This may not work for captures taken in busy environments, since the last-seen SSID may not be correct.
MyPassword
|
Note |
|---|---|
|
The WPA passphrase and SSID let you encode non-printable or otherwise troublesome
characters using URI-style percent escapes, e.g., |
|
Warning |
|---|---|
|
The WPA pass-phrase and SSID method is for WPA/WPA2-Personal only. It will not work for WPA3-Personal, which uses SAE (Simultaneous Authentication of Equals), nor for the Enterprise / 802.1X / EAP modes. |
- wpa-psk
-
The key must be provided as a hexadecimal string, and is parsed as a PSK (Pre-Shared Key) or PMK (Pairwise Master Key). For WPA/WPA2-Personal, the PSK and the PMK are identical, and directly derived from the passphrase and SSID above. The keys can be 256 bits (32 bytes, 64 hex characters) or 384 bits (48 bytes, 96 hex characters).
0102030405060708091011...6061626364
- tk
- The key must be provided as a hexadecimal string, and is parsed as a PTK (Pairwise Transient Key) or GTK (Group Temporal Key). The keys can be 16 or 32 bytes (128 or 256 bits), depending on the cipher suite used. (5 and 13 byte WEP TKs are not yet supported.)
- msk
- The key must be provided as a hexadecimal string, and is parsed as a MSK (Master Session Key). This is used for FT-EAP (IEEE 802.11r Fast BSS Transition with EAP authentication). The key can be 64 or 128 bytes.
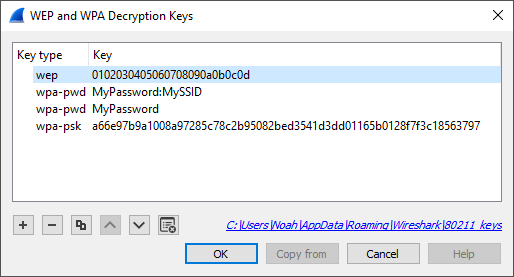
Along with decryption keys there are other preference settings that affect decryption.
- Make sure Enable decryption is selected.
- You may have to toggle Assume Packets Have FCS and Ignore the Protection bit depending on how your 802.11 driver delivers frames.
WPA and WPA2 use keys derived from an EAPOL handshake, which occurs when a machine joins a Wi-Fi network, to encrypt traffic. Unless all four handshake packets are present for the session you’re trying to decrypt, Wireshark won’t be able to decrypt the traffic. You can use the display filter eapol to locate EAPOL packets in your capture.
In order to capture the handshake for a machine, you will need to force the machine to (re-)join the network while the capture is in progress. One way to do this is to put the machine to sleep (for smartphones and tablets, "turning off" the machine puts it to sleep) before you start the capture, start the capture, and then wake the machine up. You will need to do this for all machines whose traffic you want to see.
If a TK is provided as a key, then the EAPOL 4-way handshake is not necessary, as the TK is what the handshake derives. However, all available TKs will be tried agi
WPA and WPA2 use individual keys for each device. Wireshark is able to handle up to 256 active associations, which should be enough in most circumstances. Nevertheless, if a capture has too many devices and too many associations, then while the packet list may show all packets decoded on the first pass, randomly accessing different packets in the packet details will result in some packets failing to be properly deciphered.
Filtering out only the relevant packets (e.g. with "wlan.addr") and saving into a new file should get decryption working in all cases, though it may require editing keys in the preferences or restarting Wireshark in order to free used associations. For the same reason, it is possible to be able to decode packets in a capture file without any EAPOL packets in it, as long as Wireshark did see the handshake for this communication in another capture without being restarted or editing keys. This can sometimes lead to exporting selected packets to a new file, opening that file and decoding seeming to work, but then decoding suddenly fail on the new file after Wireshark is restarted or keys are edited. If decoding suddenly stops working on a capture make sure the needed EAPOL packets are still in it.
As long as you can somehow extract the PMK from either the client or the Radius Server and configure the key (as PSK) all supported Wireshark versions will decode the traffic just fine up to the first EAPOL rekey.
EAPoL rekey is often enabled for WPA/WPA2 enterprise and will change the used encryption key similar to the procedure for the initial connect, but it can also be configured and used for pre-shared (personal) mode.
Decrypting IEEE 802.11r Fast BSS Transition roaming requires capturing reassociation frames for similar reasons, and is supported by recent Wireshark versions.
In WPA3, a different PMK is used for each connection in order to achieve forward
secrecy. Capturing the 4-way handshake and knowing the network password is not
enough to decrypt packets; you must obtain the PMK from either the client or
access point (typically by enabling logging in wpa_supplicant or hostapd
with the -d -K flags) and use this as the decryption key in Wireshark. Even
then, the decryption will only work for packets between that client and access
point, not for all devices on that network.
The TKs are the actual transient keys used to encrypt packets, which are derived during the handshake. If known, they can decrypt packets without having the handshake packets in a capture. However, having TKs as encryption keys in the table will affect IEEE 802.11 dissector performance as each encrypted packet will be tested against every TK until decryption is successful. If the table is configured with many TKs, none of which match any encrypted frame in the capture, performance can be slow.
Once a match is found, an association is formed similar to in the usual method and decryption of other frames with the same key should be on par with normal decryption flow. Thus, if most frames in the capture match TKs (or other keys), and only a limited number of TKs are configured, the performance impact is slight.
Wireshark can decrypt Encrypted Payloads of IKEv2 (Internet Key Exchange version 2) packets if necessary information is provided. Note that you can decrypt only IKEv2 packets with this feature. If you want to decrypt IKEv1 packets or ESP packets, edit ISAKMP protocol preference IKEv1 Decryption Table or ESP protocol preference ESP SAs respectively.
This is handled by a UAT, as described in Section 11.7, “User Accessible Tables”, with the following fields:
- Initiator’s SPI
- Initiator’s SPI of the IKE_SA. This field takes hexadecimal string without “0x” prefix and the length must be 16 hex chars (represents 8 octets).
- Responder’s SPI
- Responder’s SPI of the IKE_SA. This field takes hexadecimal string without “0x” prefix and the length must be 16 hex chars (represents 8 octets).
- SK_ei
- Key used to encrypt/decrypt IKEv2 packets from initiator to responder. This field takes hexadecimal string without “0x” prefix and its length must meet the requirement of the encryption algorithm selected.
- SK_er
- Key used to encrypt/decrypt IKEv2 packets from responder to initiator. This field takes hexadecimal string without “0x” prefix and its length must meet the requirement of the encryption algorithm selected.
- Encryption Algorithm
- Encryption algorithm of the IKE_SA.
- SK_ai
- Key used to calculate Integrity Checksum Data for IKEv2 packets from responder to initiator. This field takes hexadecimal string without “0x” prefix and its length must meet the requirement of the integrity algorithm selected.
- SK_ar
- Key used to calculate Integrity Checksum Data for IKEv2 packets from initiator to responder. This field takes hexadecimal string without “0x” prefix and its length must meet the requirement of the integrity algorithm selected.
- Integrity Algorithm
- Integrity algorithm of the IKE_SA.
Many protocols that use ASN.1 use Object Identifiers (OIDs) to uniquely identify certain pieces of information. In many cases, they are used in an extension mechanism so that new object identifiers (and associated values) may be defined without needing to change the base standard.
While Wireshark has knowledge about many of the OIDs and the syntax of their associated values, the extensibility means that other values may be encountered.
Wireshark uses this table to allow the user to define the name and syntax of Object Identifiers that Wireshark does not know about (for example, a privately defined X.400 extension). It also allows the user to override the name and syntax of Object Identifiers that Wireshark does know about (e.g., changing the name “id-at-countryName” to just “c”).
This table is a user table, as described in Section 11.7, “User Accessible Tables”, with the following fields:
- OID
- The string representation of the Object Identifier e.g., “2.5.4.6”.
- Name
- The name that should be displayed by Wireshark when the Object Identifier is dissected e.g., (“c”);
- Syntax
- The syntax of the value associated with the Object Identifier. This must be one of the syntaxes that Wireshark already knows about (e.g., “PrintableString”).
Wireshark uses this table to map a presentation context identifier to a given object identifier when the capture does not contain a PRES package with a presentation context definition list for the conversation.
This table is a user table, as described in Section 11.7, “User Accessible Tables”, with the following fields:
- Context Id
- An Integer representing the presentation context identifier for which this association is valid.
- Syntax Name OID
- The object identifier representing the abstract syntax name, which defines the protocol that is carried over this association.
Wireshark uses this table to map specific protocols to a certain DPC/SSN combination for SCCP.
This table is a user table, as described in Section 11.7, “User Accessible Tables”, with the following fields:
- Network Indicator
- An Integer representing the network indicator for which this association is valid.
- Called DPCs
- A range of integers representing the dpcs for which this association is valid.
- Called SSNs
- A range of integers representing the ssns for which this association is valid.
- User protocol
- The protocol that is carried over this association
If your copy of Wireshark supports libSMI, you can specify a list of MIB and PIB modules here. The COPS and SNMP dissectors can use them to resolve OIDs.
- Module name
- The name of the module, e.g., IF-MIB.
If your copy of Wireshark supports libSMI, you can specify one or more paths to MIB and PIB modules here.
- Directory name
-
A module directory, e.g.,
/usr/local/snmp/mibs. Wireshark automatically uses the standard SMI path for your system, so you usually don’t have to add anything here.
Wireshark uses this table to map specific-trap values to user defined descriptions in a Trap PDU. The description is shown in the packet details specific-trap element.
This table is a user table, as described in Section 11.7, “User Accessible Tables”, with the following fields:
- Enterprise OID
- The object identifier representing the object generating the trap.
- Trap Id
- An Integer representing the specific-trap code.
- Description
- The description to show in the packet details.
Wireshark uses this table to verify authentication and to decrypt encrypted SNMPv3 packets.
This table is a user table, as described in Section 11.7, “User Accessible Tables”, with the following fields:
- Engine ID
- If given this entry will be used only for packets whose engine id is this. This field takes a hexadecimal string in the form 0102030405.
- Username
- This is the userName. When a single user has more than one password for different SNMP-engines the first entry to match both is taken, if you need a catch all engine-id (empty) that entry should be the last one.
- Authentication model
- Which auth model to use (either “MD5”, “SHA1”, "SHA2-224", "SHA2-256", "SHA2-384" or "SHA2-512").
- Password
- The authentication password. Use \xDD for unprintable characters. A hexadecimal password must be entered as a sequence of \xDD characters. For example, the hex password 010203040506 must be entered as \x01\x02\x03\x04\x05\x06. The \ character must be treated as an unprintable character, i.e., it must be entered as \x5C or \x5c.
- Privacy protocol
- Which encryption algorithm to use (either “DES”, “AES”, "AES192" or "AES256").
- Privacy password
- The privacy password. Use \xDD for unprintable characters. A hexadecimal password must be entered as a sequence of \xDD characters. For example, the hex password 010203040506 must be entered as \x01\x02\x03\x04\x05\x06. The \ character must be treated as an unprintable character, i.e., it must be entered as \x5C or \x5c.
- Key expansion method
- Which method to use to expand the key when the generated key provides too few bytes for the selected encryption method (either based on "draft-reeder-snmpv3-usm-3desede-00" or as implemented in AGENT++).
The Tektronix K12xx/15 rf5 file format uses helper files (*.stk) to identify the various protocols that are used by a certain interface. Wireshark doesn’t read these stk files, it uses a table that helps it identify which lowest layer protocol to use.
Stk file to protocol matching is handled by a user table, as described in Section 11.7, “User Accessible Tables”, with the following fields:
- Match string
- A partial match for an stk filename, the first match wins, so if you have a specific case and a general one the specific one must appear first in the list.
- Protocol
- This is the name of the encapsulating protocol (the lowest layer in the packet data) it can be either just the name of the protocol (e.g., mtp2, eth_withoutfcs, sscf-nni ) or the name of the encapsulation protocol and the “application” protocol over it separated by a colon (e.g., sscop:sscf-nni, sscop:alcap, sscop:nbap, …)
When a pcap file uses one of the user DLTs (147 to 162) Wireshark uses this table to know which dissector(s) to use for each user DLT.
This table is a user table, as described in Section 11.7, “User Accessible Tables”, with the following fields:
- DLT
- One of the user dlts.
- Payload dissector
- This is the name of the payload dissector (the lowest layer in the packet data). (e.g., “eth_withfcs, "eth_withoutfcs”, and "eth_maybefcs" respectively for Ethernet frames that do, do not, or might possibly include the FCS at the end, “ip” for trying IPv4 then IPv6)
- Header size
- If there is a header (before the payload) this tells which size this header is. A value of 0 disables the header dissector.
- Header dissector
- The name of the header dissector to be used (uses “data” as default).
- Trailer size
- If there is a trailer (after the payload) this tells which size this trailer is. A value of 0 disables the trailer dissector.
- Trailer dissector
- The name of the trailer dissector to be used (uses “data” as default).
The
binary wire format
of Protocol Buffers (Protobuf) messages are not self-described protocol. For
example, the varint wire type in protobuf packet may be converted to int32, int64,
uint32, uint64, sint32, sint64, bool or enum field types of
protocol buffers language.
Wireshark should be configured with Protocol Buffers language files (*.proto) to
enable proper dissection of protobuf data (which may be payload of
gRPC) based on the message, enum and field definitions.
You can specify protobuf search paths at the Protobuf protocol preferences.
For example, if you defined a proto file with path d:/my_proto_files/helloworld.proto
and the helloworld.proto contains a line of import "google/protobuf/any.proto";
because the any type of official protobuf library is used. And the real path of
any.proto is d:/protobuf-3.4.1/include/google/protobuf/any.proto. You should
add the d:/protobuf-3.4.1/include/ and d:/my_proto_files paths into protobuf
search paths.
The configuration for the protobuf search paths is a user table, as described in Section 11.7, “User Accessible Tables”, with the following fields:
- Protobuf source directory
-
This specifies a directory containing protobuf source files. For example,
d:/protobuf-3.4.1/include/andd:/my_proto_filesin Windows, or/usr/include/and/home/alice/my_proto_filesin Linux/UNIX. - Load all files
-
If this option is enabled, Wireshark will load all *.proto files in this directory
and its subdirectories when Wireshark startup or protobuf search paths preferences
changed. Note that the source directories that configured to protobuf official or third
libraries path (like
d:/protobuf-3.4.1/include/) should not be set to load all files, that may cause unnecessary memory use.
If the payload of UDP on certain ports is Protobuf encoding, Wireshark use this table to know which Protobuf message type should be used to parsing the data on the specified UDP port(s).
The configuration for UDP Port(s) to Protobuf message type maps is a user table, as described in Section 11.7, “User Accessible Tables”, with the following fields:
- UDP Ports
- The range of UDP ports. The format may be "8000" or "8000,8008-8088,9080".
- Message Type
- The Protobuf message type as which the data on the specified udp port(s) should be parsed. The message type is allowed to be empty, that means let Protobuf to dissect the data on specified UDP ports as normal wire type without precise definitions.
Tips: You can create your own dissector to call Protobuf dissector. If your dissector is
written in C language, you can pass the message type to Protobuf dissector by data
parameter of call_dissector_with_data() function. If your dissector is written in Lua, you
can pass the message type to Protobuf dissector by pinfo.private["pb_msg_type"]. The format
of data and pinfo.private["pb_msg_type"] is
"message," message_type_name
For example:
message,helloworld.HelloRequest
the helloworld is package name, HelloRequest is message type.
The welcome page displays a rotating banner carousel with slides for events, sponsorship information, and tips. These slides are loaded from JSON resource files embedded in the application at build time.
Each slide has a type that determines its color scheme and category:
| Type | Description |
|---|---|
Events |
Conference announcements, meetups, and other community events. |
Sponsorship |
Information about supporting the Wireshark project. |
Tips |
Usage tips and feature highlights. |
Slide visibility can be toggled per type in the welcome page sidebar preferences.
Table of Contents
MATE: Meta Analysis and Tracing Engine
What is MATE? Well, to keep it very short, with MATE you can create user configurable extension(s) of the display filter engine.
MATE’s goal is to enable users to filter frames based on information extracted from related frames or information on how frames relate to each other. MATE was written to help troubleshooting gateways and other systems where a "use" involves more protocols. However, MATE can be used as well to analyze other issues regarding an interaction between packets like response times, incompleteness of transactions, presence/absence of certain attributes in a group of Protocol Data Units (PDUs) and more.
MATE is a Wireshark plugin that allows the user to specify how different frames are related to each other. To do so, MATE extracts data from the frames' tree and then, using that information, tries to group the frames based on how MATE is configured. Once the PDUs are related, MATE will create a "protocol" tree with fields the user can filter with. The fields will be almost the same for all the related frames, so one can filter a complete session spanning several frames containing more protocols based on an attribute appearing in some related frame. Other than that MATE allows to filter frames based on response times, number of PDUs in a group and a lot more.
So far MATE has been used to:
- Filter all packets of a call using various protocols knowing just the calling number. (MATE’s original goal)
- Filter all packets of all calls using various protocols based on the release cause of one of its "segments".
- Extrapolate slow transactions from very "dense" captures. (finding requests that timeout)
- Find incomplete transactions (no responses)
- Follow requests through more gateways/proxies.
- more…
These are the steps to try out MATE:
- Run Wireshark and check if the plugin is installed (MATE should appear in Help→About Wireshark:Plugins)
- Get a configuration file e.g., tcp.mate (see Mate/Examples for more) and place it somewhere on your harddisk.
- Go to Edit→Preferences…→Protocols→MATE and set the Configuration Filename to the file you want to use and restart Wireshark.
-
Load a corresponding capture file (e.g.,
http.cap) and see if MATE
has added some new display filter fields, something like:
mate tcp_pdu:1→tcp_ses:1or, at prompt:path_to/wireshark -o "mate.config: tcp.mate" -r http.cap.
If everything went well, your packet details might look something like this:
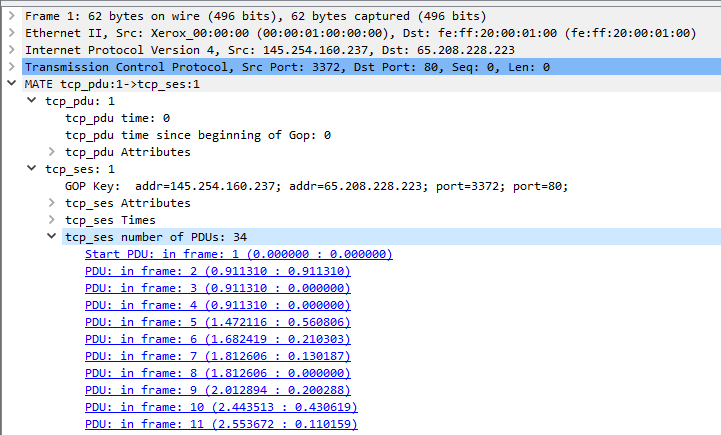
MATE creates a filterable tree based on information contained in frames that share some relationship with information obtained from other frames. The way these relationships are made is described in a configuration file. The configuration file tells MATE what makes a PDU and how to relate it to other PDUs.
MATE analyzes each frame to extract relevant information from the "protocol" tree of that frame. The extracted information is contained in MATE PDUs; these contain a list of relevant attributes taken from the tree. From now on, I will use the term "PDU" to refer to the objects created by MATE containing the relevant information extracted from the frame; I’ll use "frame" to refer to the "raw" information extracted by the various dissectors that pre-analyzed the frame.
For every PDU, MATE checks if it belongs to an existing "Group of PDUs" (GOP). If it does, it assigns the PDU to that GOP and moves any new relevant attributes to the GOP’s attribute list. How and when do PDUs belong to GOPs is described in the configuration file as well.
Every time a GOP is assigned a new PDU, MATE will check if it matches the conditions to make it belong to a "Group of Groups" (GOG). Naturally the conditions that make a GOP belong to a GOG are taken from the configuration file as well.
Once MATE is done analyzing the frame it will be able to create a "protocol" tree for each frame based on the PDUs, the GOPs they belong to and naturally any GOGs the former belongs to.
How to tell MATE what to extract, how to group it and then how to relate those groups is made using AVPs and AVPLs.
Information in MATE is contained in Attribute Value Pairs (AVPs). AVPs are made of two strings: the name and the value. AVPs are used in the configuration and there they have an operator as well. There are various ways AVPs can be matched against each other using those operators.
AVPs are grouped into AVP Lists (AVPLs). PDUs, GOPs and GOGs have an AVPL each. Their AVPLs will be matched in various ways against others coming from the configuration file.
MATE will be instructed how to extract AVPs from frames in order to create a PDU with an AVPL. It will be instructed as well, how to match that AVPL against the AVPLs of other similar PDUs in order to relate them. In MATE the relationship between PDUs is a GOP, it has an AVPL as well. MATE will be configured with other AVPLs to operate against the GOP’s AVPL to relate GOPs together into GOGs.
A good understanding on how AVPs and AVPLs work is fundamental to understand how MATE works.
MATE was originally written by Luis Ontanon, a Telecommunications systems troubleshooter, as a way to save time filtering out the packets of a single call from huge capture files using just the calling number. Later he used the time he had saved to make it flexible enough to work with protocols other than the ones he was directly involved with.
Information used by MATE to relate different frames is contained in Attribute Value Pairs (AVPs). AVPs are made of two strings - the name and the value. When AVPs are used in the configuration, an operator is defined as well. There are various ways AVPs can be matched against each other using those operators.
avp_name="avp's value" another_name= "1234 is the value"
The name is a string used to refer to a "type" of an AVP. Two AVPs won’t match unless their names are identical.
The name must start with a lowercase letter (a-z) and can contain only alphanumeric characters (a-zA-Z0-9) and the special characters "_", "-", and ".". The name ends with an operator.
You should not use uppercase characters in names, or names that start with “.” or “_”. Capitalized names are reserved for configuration parameters (we’ll call them keywords); nothing forbids you from using capitalized strings for other things as well but it probably would be confusing. I’ll avoid using capitalized words for anything but the keywords in this document, the reference manual, the examples and the base library. Names that start with a “.” would be very confusing as well because in the old grammar, AVPL transforms use names starting with a “.” to indicate they belong to the replacement AVPL.
The value is a string that is either set in the configuration (for configuration AVPs) or by Wireshark while extracting interesting fields from a frame’s tree. The values extracted from fields use the same representation as they do in filter strings except that no quotes are used.
The value will be dealt with as a string even if it is a number. If there are any spaces in the value, the value must be between quotes "". Values that are also keywords such as True and False should also be wrapped in quotes ("True", "False").
ip_addr=10.10.10.11 tcp_port=1234 binary_data=01:23:45:67:89:ab:cd:ef parameter12=0x23aa parameter_with_spaces="this value has spaces"
The way two AVPs with the same name might match is described by the operator. Remember two AVPs won’t match unless their names are identical. In MATE, match operations are always made between the AVPs extracted from frames (called data AVPs) and the configuration’s AVPs.
Currently defined MATE AVP match operators are:
- Equal = will match if the string given completely matches the data AVP’s value string
- Not Equal ! will match only if the given value string is not equal to the data AVP’s value string
- One Of {} will match if one of the possible strings listed is equal to the data AVP’s value string
- Starts With ^ will match if the string given matches the first characters of the data AVP’s value string
- Ends With $ will match if the string given matches the last characters of the data AVP’s value string
- Contains ~ will match if the string given matches any substring of the data AVP’s value string
- Lower Than < will match if the data AVP’s value string is semantically lower than the string given
- Higher Than > will match if the data AVP’s value string is semantically higher than the string given
- Exists ? (the ? can be omitted) will match as far as a data AVP of the given name exists
An AVPL is a set of diverse AVPs that can be matched against other AVPLs. Every PDU, GOP and GOG has an AVPL that contains the information regarding it. The rules that MATE uses to group PDUs and GOPs are AVPL operations.
There will never be two identical AVPs in a given AVPL. However, we can have more than one AVP with the same name in an AVPL as long as their values are different.
Some AVPL examples:
( addr=10.20.30.40, addr=192.168.0.1, tcp_port=21, tcp_port=32534, user_cmd=PORT,
data_port=12344, data_addr=192.168.0.1 )
( addr=10.20.30.40, addr=192.168.0.1, channel_id=22:23, message_type=Setup,
calling_number=1244556673 )
( addr=10.20.30.40, addr=192.168.0.1, ses_id=01:23:45:67:89:ab:cd:ef )
( user_id=pippo, calling_number=1244556673, assigned_ip=10.23.22.123 )
In MATE there are two types of AVPLs:
- data AVPLs that contain information extracted from frames.
- configuration AVPLs that come from the configuration and are used to tell MATE how to relate items based on their data AVPLs.
Data AVPLs can be operated against configuration AVPLs in various ways:
- Loose Match: Will match if at least one of the AVPs of each AVPL match. If it matches it will return an AVPL containing all AVPs from the data AVPL that did match the configuration AVPs.
- "Every" Match: Will match if none of the AVPs of the configuration AVPL fails to match a present AVP in the data AVPL, even if not all of the configuration AVPs have a match. If it matches it will return an AVPL containing all AVPs from the data AVPL that did match one AVP in the configuration AVPL.
- Strict Match: Will match if and only if every one of the configuration AVPs have at least one match in the data AVPL. If it matches it will return an AVPL containing the AVPs from the data AVPL that matched.
- There’s also a Merge operation that is to be performed between AVPLs where all the AVPs that don’t exist in the data AVPL but exist in the configuration will be added to the data AVPL.
- Other than that, there are Transforms - a combination of a match AVPL and an AVPL to merge.
MATE’s analysis of a frame is performed in three phases:
- In the first phase, MATE attempts to extract a MATE PDU from the frame’s protocol tree. MATE will create a PDU if MATE’s config has a Pdu declaration whose Proto is contained in the frame.
- In the second phase, if a PDU has been extracted from the frame, MATE will try to group it to other PDUs into a GOP (Group of PDUs) by matching the key criteria given by a Gop declaration. If there is no GOP yet with the key criteria for the PDU, MATE will try to create a new GOP for it if it matches the Start criteria given in the Gop declaration.
- In the third phase, if there’s a GOP for the PDU, MATE will try to group this GOP with other GOPs into a GOG (Group of Groups) using the criteria given by the Member criteria of a Gog declaration.
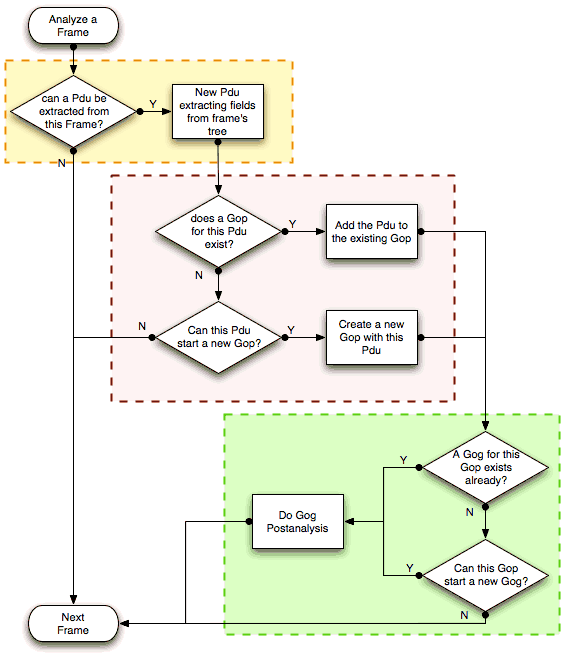
The extraction and matching logic comes from MATE’s configuration; MATE’s configuration file is specified by the mate.config preference. By default it is an empty string which means: do not configure MATE.
The config file tells MATE what to look for in frames; How to make PDUs out of it; How will PDUs be related to other similar PDUs into GOPs; And how GOPs relate into GOGs.
The MATE configuration file is a list of declarations. There are 4 types of declarations: Transform, Pdu, Gop, and Gog. A Transform block must be before any of the other block declarations that may use it.
MATE will look in the tree of every frame to see if there is useful data to extract, and if there is, it will create one or more PDU objects containing the useful information.
The first part of MATE’s analysis is the "PDU extraction".
MATE will make a PDU for each different proto field of Proto type present in the frame. MATE will fetch from the field’s tree those fields that are defined in the Section 12.9.1, “PDU declaration block” declaration whose initial offset in the frame is within the boundaries of the current Proto and those of the given Transport and Payload statements.
Pdu dns_pdu Proto dns Transport ip {
Extract addr From ip.addr;
Extract dns_id From dns.id;
Extract dns_resp From dns.flags.response;
};
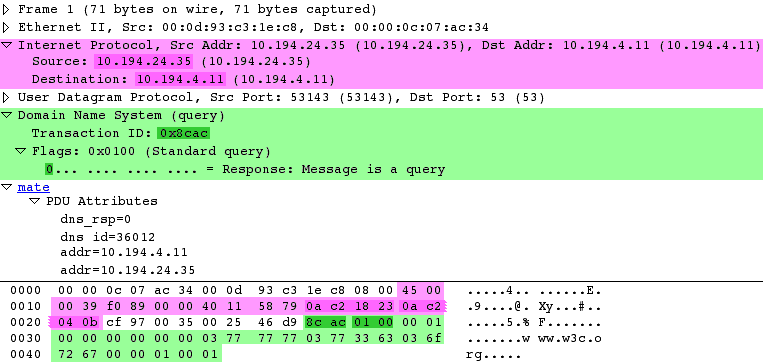
Once MATE has found a Proto field for which to create a PDU from the frame it will move backwards in the frame looking for the respective Transport fields. After that it will create AVPs named as each of those given in the rest of the AVPL for every instance of the fields declared as its values.
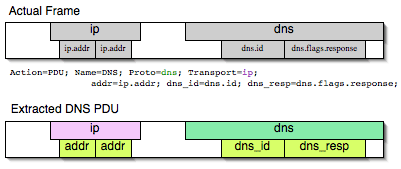
Sometimes we need information from more than one Transport protocol. In that case MATE will check the frame looking backwards to look for the various Transport protocols in the given stack. MATE will choose only the closest transport boundary per "protocol" in the frame.
This way we’ll have all PDUs for every Proto that appears in a frame match its relative transports.
Pdu isup_pdu Proto isup Transport mtp3/ip {
Extract addr From ip.addr;
Extract m3pc From mtp3.dpc;
Extract m3pc From mtp3.opc;
Extract cic From isup.cic;
Extract isup_msg From isup.message_type;
};
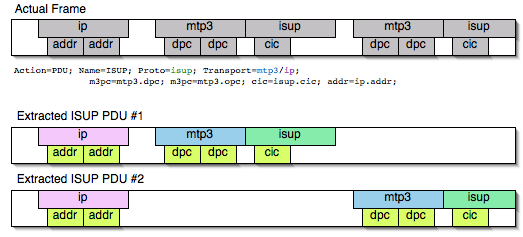
This allows to assign the right Transport to the PDU avoiding duplicate transport protocol entries (in case of tunneled ip over ip for example).
Pdu ftp_pdu Proto ftp Transport tcp/ip {
Extract addr From ip.addr;
Extract port From tcp.port;
Extract ftp_cmd From ftp.command;
};
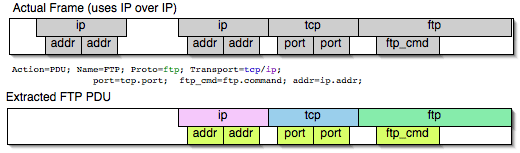
Other than the mandatory Transport there is also an optional Payload statement, which works pretty much as Transport but refers to elements after the Proto's range. It is useful in those cases where the payload protocol might not appear in a PDU but nevertheless the PDU belongs to the same category.
Pdu mmse_over_http_pdu Proto http Transport tcp/ip {
Payload mmse;
Extract addr From ip.addr;
Extract port From tcp.port;
Extract content From http.content_type;
Extract host From http.host;
Extract http_rq From http.request;
Extract method From http.request.method;
Extract resp From http.response.code;
Extract msg_type From mmse.message_type;
Extract notify_status From mmse.status;
Extract send_status From mmse.response_status;
Extract trx From mmse.transaction_id;
};
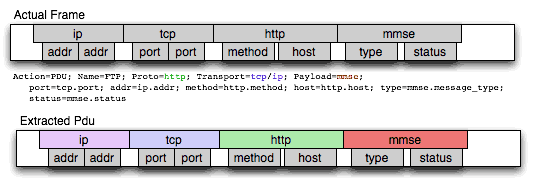
There might be cases in which we won’t want MATE to create a PDU unless some of its extracted attributes meet or do not meet some criteria. For that we use the Criteria statements of the Pdu declarations.
Pdu isup_pdu Proto isup Transport mtp3/ip {
...
// MATE will create isup_pdu PDUs only when there is not a point code '1234'
Criteria Reject Strict (m3pc=1234);
};
Pdu ftp_pdu Proto ftp Transport tcp/ip {
...
// MATE will create ftp_pdu PDUs only when they go to port 21 of our ftp_server
Criteria Accept Strict (addr=10.10.10.10, port=21);
};
The Criteria statement is given an action (Accept or Reject), a match type (Strict, Loose or Every) and an AVPL against which to match the currently extracted one.
Once the fields have been extracted into the PDU’s AVPL, MATE will apply any declared Transform to it. The way transforms are applied and how they work is described later on. However, it’s useful to know that once the AVPL for the PDU is created, it may be transformed before being analyzed. That way we can massage the data to simplify the analysis.
Every successfully created PDU will add a MATE tree to the frame dissection. If the PDU is not related to any GOP, the tree for the PDU will contain just the PDU’s info. If it is assigned to a GOP, the tree will also contain the GOP items, and the same applies for the GOG level.
mate dns_pdu:1
dns_pdu: 1
dns_pdu time: 3.750000
dns_pdu Attributes
dns_resp: False
dns_id: 0x8cac
addr: 10.194.4.11
addr: 10.194.24.35
The PDU’s tree contains some filterable fields
- mate.dns_pdu will contain the number of the "dns_pdu" PDU
- mate.dns_pdu.RelativeTime will contain the time passed since the beginning of the capture in seconds
-
the tree will contain the various attributes of the PDU as well, these will all be strings (to be used in filters as "10.0.0.1", not as 10.0.0.1)
- mate.dns_pdu.dns_resp
- mate.dns_pdu.dns_id
- mate.dns_pdu.addr
Once MATE has created the PDUs it passes to the PDU analysis phase. During the PDU analysis phase MATE will try to group PDUs of the same type into 'Groups of PDUs' (aka GOPs) and copy some AVPs from the PDU’s AVPL to the GOP’s AVPL.
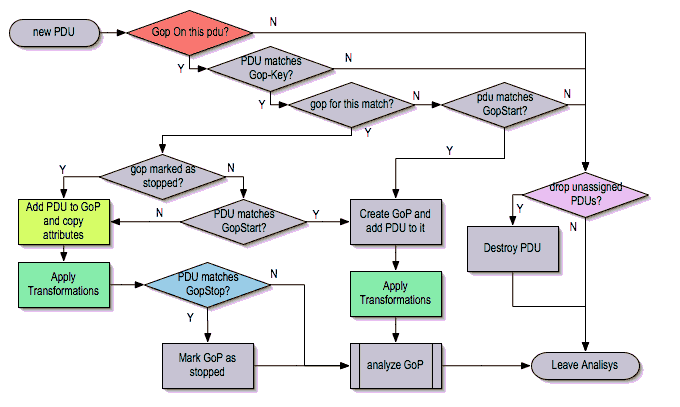
Given a PDU, the first thing MATE will do is to check if there is any GOP declaration in the configuration for the given PDU type. If so, it will use its Match AVPL to match it against the PDU’s AVPL; if they don’t match, the analysis phase is done. If there is a match, the AVPL is the GOP’s candidate key which will be used to search the index of GOPs for the GOP to which to assign the current PDU. If there is no such GOP and this PDU does not match the Start criteria of a Gop declaration for the PDU type, the PDU will remain unassigned and only the analysis phase will be done.
Gop ftp_ses On ftp_pdu Match (addr, addr, port, port) {...};
Gop dns_req On dns_pdu Match (addr, addr, dns_id) {...};
Gop isup_leg On isup_pdu Match (m3pc, m3pc, cic) {...};
If there was a match, the candidate key will be used to search the index of GOPs to see if there is already a GOP matching the GOP’s key the same way. If there is such a match in the GOPs collection, and the PDU doesn’t match the Start AVPL for its type, the PDU will be assigned to the matching GOP. If it is a Start match, MATE will check whether or not that GOP has been already stopped. If the GOP has been stopped, a new GOP will be created and will replace the old one in the index of GOPs.
Gop ftp_ses On ftp_pdu Match (addr, addr, port, port) {
Start (ftp_cmd=USER);
};
Gop dns_req On dns_pdu Match (addr, addr, dns_id) {
Start (dns_resp="True");
};
Gop isup_leg On isup_pdu Match (m3pc, m3pc, cic) {
Start (isup_msg=1);
};
If no Start is given for a GOP, a PDU whose AVPL matches an existing GOP’s key will act as the start of a GOP.
Once we know a GOP exists and the PDU has been assigned to it, MATE will copy into the GOP’s AVPL all the attributes matching the key plus any AVPs of the PDU’s AVPL matching the Extra AVPL.
Gop ftp_ses On ftp_pdu Match (addr, addr, port, port) {
Start (ftp_cmd=USER);
Extra (pasv_prt, pasv_addr);
};
Gop isup_leg On isup_pdu Match (m3pc, m3pc, cic) {
Start (isup_msg=1);
Extra (calling, called);
};
Once the PDU has been assigned to the GOP, MATE will check whether or not the PDU matches the Stop, if it happens, MATE will mark the GOP as stopped. Even after stopped, a GOP may get assigned new PDUs matching its key, unless such PDU matches Start. If it does, MATE will instead create a new GOP starting with that PDU.
Gop ftp_ses On ftp_pdu Match (addr, addr, port, port) {
Start (ftp_cmd=USER);
Stop (ftp_cmd=QUIT); // The response to the QUIT command will be assigned to the same GOP
Extra (pasv_prt, pasv_addr);
};
Gop dns_req On dns_pdu Match (addr, addr, dns_id) {
Start (dns_resp="False");
Stop (dns_resp="True");
};
Gop isup_leg On isup_pdu Match (m3pc, m3pc, cic) {
Start (isup_msg=1); // IAM
Stop (isup_msg=16); // RLC
Extra (calling, called);
};
If no Stop criterium is stated for a given GOP, the GOP will be stopped as soon as it is created. However, as with any other GOP, PDUs matching the GOP’s key will still be assigned to the GOP unless they match a Start condition, in which case a new GOP using the same key will be created. To group multiple PDUs that match the Start, add a bogus Stop such as
Gop frame_ses On frame_pdu Match (frame_time) {
Start (frame_time);
Stop (frame_time="FOO");
};
For every frame containing a PDU that belongs to a GOP, MATE will create a tree for that GOP.
The example below represents the tree created by the dns_pdu and dns_req examples.
...
MATE dns_pdu:6->dns_req:1
dns_pdu: 6
dns_pdu time: 2.103063
dns_pdu time since beginning of Gop: 2.103063
dns_pdu Attributes
dns_resp: True
dns_id: 0x8cac
addr: 10.194.4.11
addr: 10.194.24.35
dns_req: 1
GOP Key: addr=10.194.4.11; addr=10.194.24.35; dns_id=0x8cac;
dns_req Attributes
dns_id: 0x8cac
addr: 10.194.4.11
addr: 10.194.24.35
dns_req Times
dns_req start time: 0.000000
dns_req hold time: 2.103063
dns_req duration: 2.103063
dns_req number of PDUs: 2
Start PDU: in frame 1
Stop PDU: in frame 6 (2.103063 : 2.103063)
Other than the PDU’s tree, this one contains information regarding the relationship between the PDUs that belong to the GOP. That way we have:
- mate.dns_req which contains the id of this dns_req GOP. This will be present in frames that belong to dns_req GOPs.
- mate.dns_req.dns_id and mate.dns_req.addr which represent the values of the attributes copied into the GOP.
-
the timers of the GOP
- mate.dns_req.StartTime time (in seconds) passed since beginning of capture until GOP’s start.
- mate.dns_req.Time time passed between the start PDU and the stop PDU assigned to this GOP (only created if a Stop criterion has been declared for the GOP and a matching PDU has arrived).
- mate.dns_req.Duration time passed between the start PDU and the last PDU assigned to this GOP.
-
mate.dns_req.NumOfPdus the number of PDUs that belong to this GOP
- mate.dns_req.Pdu a filterable list of frame numbers of the PDUs of this GOP
Note that there are two "timers" for a GOP:
- Time, which is defined only for GOPs that have been Stopped, and gives the time passed between the Start and the Stop PDUs.
- Duration, which is defined for every GOP regardless of its state, and give the time passed between its Start PDU and the last PDU that was assigned to that GOP.
So:
- we can filter for PDUs that belong to GOPs that have been Stopped with mate.xxx.Time
- we can filter for PDUs that belong to unstopped GOPs with mate.xxx && !mate.xxx.Time
- we can filter for PDUs that belong to stopped GOPs using mate.xxx.Duration
- we can filter for PDUs that belong to GOPs that have taken more (or less) time that 0.5s to complete with mate.xxx.Time > 0.5 (you can try these also as color filters to find out when response times start to grow)
When GOPs are created, or whenever their AVPL changes, GOPs are (re)analyzed to check if they match an existent group of groups (GOG) or can create a new one. The GOP analysis is divided into two phases. In the first phase, the still unassigned GOP is checked to verify whether it belongs to an already existing GOG or may create a new one. The second phase eventually checks the GOG and registers its keys in the index of GOGs.
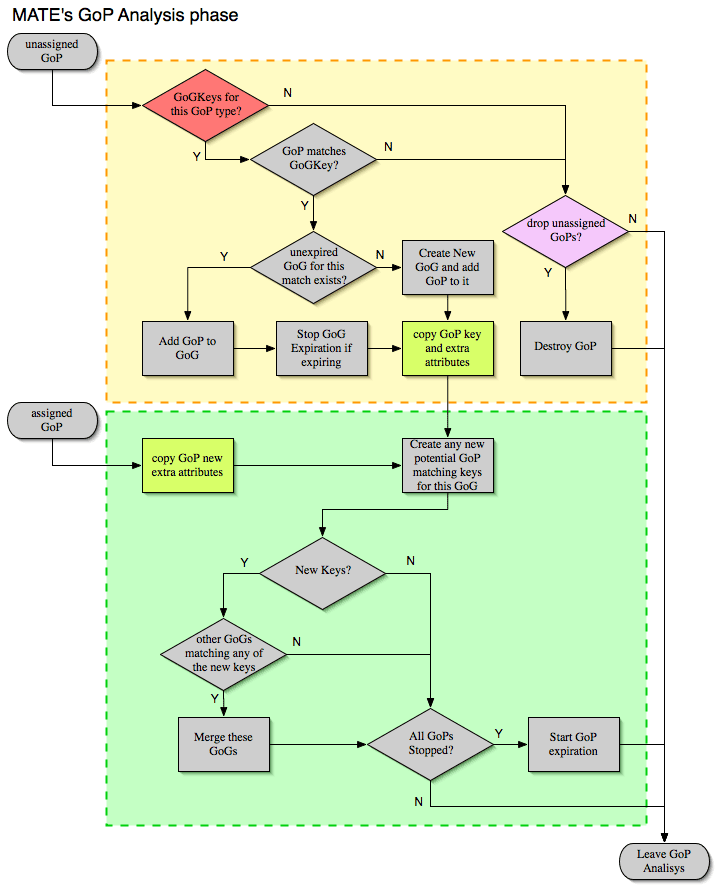
There are several reasons for the author to believe that this feature needs to be reimplemented, so probably there will be deep changes in the way this is done in the near future. This section of the documentation reflects the version of MATE as of Wireshark 0.10.9; in future releases this will change.
The first thing we have to do configuring a GOG is to tell MATE that it exists.
Gog http_use {
...
};
Then we have to tell MATE what to look for a match in the candidate GOPs.
Gog http_use {
Member http_ses (host);
Member dns_req (host);
};
Most often, also other attributes than those used for matching would be interesting. In order to copy from GOP to GOG other interesting attributes, we might use Extra like we do for GOPs.
Gog http_use {
...
Extra (cookie);
};
mate http_pdu:4->http_req:2->http_use:1
http_pdu: 4
http_pdu time: 1.309847
http_pdu time since beginning of Gop: 0.218930
http_req: 2
... (the gop's tree for http_req: 2) ..
http_use: 1
http_use Attributes
host: www.example.com
http_use Times
http_use start time: 0.000000
http_use duration: 1.309847
number of GOPs: 3
dns_req: 1
... (the gop's tree for dns_req: 1) ..
http_req: 1
... (the gop's tree for http_req: 1) ..
http_req of current frame: 2
We can filter on:
-
the timers of the GOG
- mate.http_use.StartTime time (in seconds) passed since beginning of capture until GOG’s start.
- mate.http_use.Duration time elapsed between the first frame of a GOG and the last one assigned to it.
-
the attributes passed to the GOG
- mate.http_use.host
- mate.http_use.NumOfGops the number of GOPs that belong to this GOG
- mate.http_use.GopStart the start frame of a GOP
- mate.http_use.GopStop the stop frame of a GOP
A Transform is a sequence of Match rules optionally completed with modification of the match result by an additional AVPL. Such modification may be an Insert (merge) or a Replace. Transforms can be used as helpers to manipulate an item’s AVPL before it is processed further. They come to be very helpful in several cases.
AVPL Transforms are declared in the following way:
Transform name {
Match [Strict|Every|Loose] match_avpl [Insert|Replace] modify_avpl;
...
};
The name is the handle to the AVPL transform. It is used to refer to the transform when invoking it later.
The Match declarations instruct MATE what and how to match against the data AVPL and how to modify the data AVPL if the match succeeds. They will be executed in the order they appear in the config file whenever they are invoked.
The optional match type qualifier (Strict, Every, or Loose) is used to choose the Match type; Strict is the default value which may be omitted.
The optional modification mode qualifier instructs MATE how the modify AVPL should be used:
- the default value Insert (which may be omitted) causes the modify_avpl to be merged to the existing data AVPL,
- Replace causes all the matching AVPs from the data AVPL to be replaced by the modify_avpl.
The modify_avpl may be an empty one; this comes useful in some cases for both Insert and Replace modification modes.
Transform rm_client_from_http_resp1 {
Match (http_rq); //first match wins so the request won't get the not_rq attribute inserted
Match Every (addr) Insert (not_rq); //this line won't be evaluated if the first one matched so not_rq won't be inserted to requests
};
Transform rm_client_from_http_resp2 {
Match (not_rq, client) Replace (); //replace "client and not_rq" with nothing
};
Examples:
Transform insert_name_and {
Match Strict (host=10.10.10.10, port=2345) Insert (name=JohnDoe);
};
adds name=JohnDoe to the data AVPL if it contains host=10.10.10.10 and port=2345
Transform insert_name_or {
Match Loose (host=10.10.10.10, port=2345) Insert (name=JohnDoe);
};
adds name=JohnDoe to the data AVPL if it contains host=10.10.10.10 or port=2345
Transform replace_ip_address {
Match (host=10.10.10.10) Replace (host=192.168.10.10);
};
replaces the original host=10.10.10.10 by host=192.168.10.10
Transform add_ip_address {
Match (host=10.10.10.10) (host=192.168.10.10);
};
adds (inserts) host=192.168.10.10 to the AVPL, keeping the original host=10.10.10.10 in it too
Transform replace_may_be_surprising {
Match Loose (a=aaaa, b=bbbb) Replace (c=cccc, d=dddd);
};
gives the following results:
- (a=aaaa, b=eeee) gets transformed to (b=eeee, c=cccc, d=dddd) because a=aaaa did match so it got replaced while b=eeee did not match so it has been left intact,
- (a=aaaa, b=bbbb) gets transformed to (c=cccc, d=dddd) because both a=aaaa and b=bbbb did match.
Once declared, Transforms can be added to the declarations of PDUs, GOPs or GOGs. This is done by adding the Transform name_list statement to the declaration:
Pdu my_proto_pdu Proto my_proto Transport ip {
Extract addr From ip.addr;
...
Transform my_pdu_transform[, other_pdu_transform[, yet_another_pdu_transform]];
};
- In case of PDU, the list of transforms is applied against the PDU’s AVPL after its creation.
- In case of GOP and GOG, the list of transforms is applied against their respective AVPLs when they are created and every time they change.
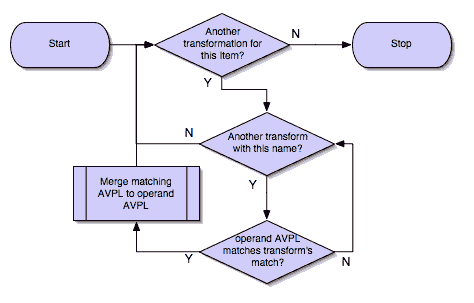
- A list of previously declared Transforms may be given to every Item (Pdu, Gop, or Gog), using the Transform statement.
- Every time the AVPL of an item changes, it will be operated against all the Transforms on the list given to that item. The Transforms on the list are applied left to right.
- Inside each of the Transforms, the item’s AVPL will be operated against the Transform’s Match clauses starting from the topmost one, until all have been tried or until one of them succeeds.
MATE’s Transforms can be used for many different things, like:
Using Transforms we can add more than one start or stop condition to a GOP.
Transform start_cond {
Match (attr1=aaa,attr2=bbb) (msg_type=start);
Match (attr3=www,attr2=bbb) (msg_type=start);
Match (attr5^a) (msg_type=stop);
Match (attr6$z) (msg_type=stop);
};
Pdu pdu ... {
...
Transform start_cond;
}
Gop gop ... {
Start (msg_type=start);
Stop (msg_type=stop);
...
}
Transform marks {
Match (addr=10.10.10.10, user=john) (john_at_host);
Match (addr=10.10.10.10, user=tom) (tom_at_host);
}
...
Gop my_gop ... {
...
Transform marks;
}
After that we can use a display filter mate.my_gop.john_at_host or mate.my_gop.tom_at_host
Transform direction_as_text {
Match (src=192.168.0.2, dst=192.168.0.3) Insert (direction=from_2_to_3);
Match (src=192.168.0.3, dst=192.168.0.2) Insert (direction=from_3_to_2);
};
Pdu my_pdu Proto my_proto Transport tcp/ip {
Extract src From ip.src;
Extract dst From ip.dst;
Extract addr From ip.addr;
Extract port From tcp.port;
Extract start From tcp.flags.syn;
Extract stop From tcp.flags.fin;
Extract stop From tcp.flags.rst;
Transform direction_as_text;
}
Gop my_gop On my_pdu Match (addr,addr,port,port) {
...
Extra (direction);
}
The original example (below) would delete src and dst then add direction.
Transform direction_as_text {
Match (src=192.168.0.2, dst=192.168.0.3) Replace (direction=from_2_to_3);
Match (src=192.168.0.3, dst=192.168.0.2) Replace (direction=from_3_to_2);
};
NAT can create problems when tracing, but we can easily work around it by Transforming the NATed IP address and the Ethernet address of the router into the non-NAT address:
Transform denat {
Match (addr=192.168.0.5, ether=01:02:03:04:05:06) Replace (addr=123.45.67.89);
Match (addr=192.168.0.6, ether=01:02:03:04:05:06) Replace (addr=123.45.67.90);
Match (addr=192.168.0.7, ether=01:02:03:04:05:06) Replace (addr=123.45.67.91);
}
Pdu my_pdu Proto my_proto transport tcp/ip/eth {
Extract ether From eth.addr;
Extract addr From ip.addr;
Extract port From tcp.port;
Transform denat;
}
We’ll show a MATE configuration that first creates GOPs for every DNS and HTTP request, then it ties the GOPs together in a GOG based on the host. Finally, we’ll separate into different GOGs request coming from different users.
With this MATE configuration loaded we can:
- use mate.http_use.Duration > 5.5 to filter frames based on the time it takes to load a complete page from the DNS request to resolve its name until the last image gets loaded.
- use mate.http_use.client == "10.10.10.20" && mate.http_use.host == "www.example.com" to isolate DNS and HTTP packets related to a visit of a certain user.
- use mate.http_req.Duration > 1.5 to filter all the packets of HTTP requests that take more than 1.5 seconds to complete.
The complete config file is available on the Wireshark Wiki: https://wiki.wireshark.org/Mate/Tutorial
Note: This example uses dns.qry.name which is defined since Wireshark version 0.10.9. Supposing you have a MATE plugin already installed you can test it with the current Wireshark version.
First we’ll tell MATE how to create a GOP for each DNS request/response.
MATE needs to know what makes a DNS PDU. We describe it using a Pdu declaration:
Pdu dns_pdu Proto dns Transport ip {
Extract addr From ip.addr;
Extract dns_id From dns.id;
Extract dns_resp From dns.flags.response;
};
Using Proto dns we tell MATE to create PDUs every time it finds dns. Using Transport ip we inform MATE that some of the fields we are interested are in the ip part of the frame. Finally, we tell MATE to import ip.addr as addr, dns.id as dns_id and dns.flags.response as dns_resp.
Once we’ve told MATE how to extract dns_pdus we’ll tell it how to match requests and responses and group them into a GOP. For this we’ll use a Gop declaration to define the GOP, and then, Start and Stop statements to tell it when the GOP starts and ends.
Gop dns_req On dns_pdu Match (addr,addr,dns_id) {
Start (dns_resp="False");
Stop (dns_resp="True");
};
Using the Gop declaration we tell MATE that the Name of the GOP is dns_req, that _dns_pdus_s can become members of the GOP, and what is the key used to match the PDUs to the GOP.
The key for this GOP is "addr, addr, dns_id". That means that in order to belong to the same GOP, dns_pdus have to have both addresses and the request id identical. We then instruct MATE that a dns_req starts whenever a dns_pdu matches "dns_resp="False"" and that it stops when another dns_pdu matches "dns_resp="True"".
At this point, if we open a capture file using this configuration, we are able to use a display filter mate.dns_req.Time > 1 to see only the packets of DNS requests that take more than one second to complete.
We can use a display filter mate.dns_req && ! mate.dns_req.Time to find requests for which no response was given. mate.xxx.Time is set only for GOPs that have being stopped.
This other example creates a GOP for every HTTP request.
Pdu http_pdu Proto http Transport tcp/ip {
Extract addr From ip.addr;
Extract port From tcp.port;
Extract http_rq From http.request.method;
Extract http_rs From http.response;
DiscardPduData true;
};
Gop http_req On http_pdu Match (addr, addr, port, port) {
Start (http_rq);
Stop (http_rs);
};
So, if we open a capture using this configuration
- filtering with mate.http_req.Time > 1 will give all the requests where the response header takes more than one second to come
- filtering with mate.http_req.Duration > 1.5 will show those request that take more than 1.5 seconds to complete.
You have to know that mate.xxx.Time gives the time in seconds between the PDU matching the GOP Start clause and the PDU matching the GOP Stop clause (yes, you can create timers using this!). On the other hand, mate.xxx.Duration gives you the time passed between the GOP Start and the last PDU assigned to that GOP regardless whether it is a Stop or not. After the GOP Stop, PDUs matching the GOP’s Key will still be assigned to the same GOP as far as they don’t match the GOP Start, in which case a new GOP with the same key will be created.
We’ll tie together to a single GOG all the HTTP packets belonging to requests and responses to a certain host and the DNS request and response used to resolve its domain name using the Pdu and Gop definitions of the previous examples
To be able to group DNS and HTTP requests together, we need to import into the PDUs and GOPs some part of information that both those protocols share. Once the PDUs and GOPs have been defined, we can use Extract (for PDUs) and Extract (for GOPs) statements to tell MATE what other protocol fields are to be added to PDU’s and GOP’s AVPLs. We add the following statements to the appropriate declarations:
Extract host From http.host; // to Pdu http_pdu as the last Extract in the list
Extra (host); // to Gop http_req after the Stop
Extract host From dns.qry.name; // to Pdu dns_pdu as the last Extract in the list
Extra (host); // to Gop dns_req after the Stop
Here we’ve told MATE to import http.host into http_pdu and dns.qry.name into dns_pdu as host. We also have to tell MATE to copy the host attribute from the PDUs to the GOPs - we do this using Extra.
Once we have all the data we need in PDUs and GOPs, we tell MATE what makes different GOPs belong to a certain GOG.
Gog http_use {
Member http_req (host);
Member dns_req (host);
Expiration 0.75;
};
Using the Gog declaration, we tell MATE to define a GOG type named http_use whose expiration is 0.75 seconds after all the GOPs that belong to it had been stopped. After that time, an eventual new GOP with the same key match will create a new GOG instead of been added to the previous GOG.
Using the Member statements, we tell MATE that http_req*s with the same *host belong to the same GOG, same thing for *dns_req*s.
So far we have instructed MATE to group every packet related to sessions towards a certain host. At this point if we open a capture file and:
- a display filter mate.http_use.Duration > 5 will show only those requests that have taken more than 5 seconds to complete starting from the DNS request and ending with the last packet of the HTTP responses.
- a display filter mate.http_use.host == "www.w3c.org" will show all the packets (both DNS and HTTP) related to the requests directed to www.w3c.org
"Houston: we’ve had a problem here."
This configuration works fine if used for captures taken at the client’s side but deeper in the network we’d got a real mess. Requests from many users get mixed together into http_uses. GOGs are created and stopped almost randomly (depending on the timing in which GOPs start and stop). How do we get requests from individual users separated from each other?
MATE has a tool that can be used to resolve this kind of grouping issues. This tool are the Transforms. Once defined, they can be applied against PDUs, GOPs and GOGs and they might replace or insert more attributes based on what’s there. We’ll use them to create an attribute named client, using which we’ll separate different requests.
For DNS we need the ip.src of the request moved into the GOP only from the DNS request.
So we first tell MATE to import ip.src as client:
Extract client From ip.src;
Next, we tell MATE to replace ( dns_resp="True", client ) with just dns_resp="True" in the PDU. That way, we’ll keep the attribute client only in the DNS request PDUs (i.e., packets coming from the client).To do so, we have to add a Transform declaration (in this case, with just one clause) before the Pdu declaration which uses it:
Transform rm_client_from_dns_resp {
Match (dns_resp="True", client) Replace (dns_resp="True");
};
Next, we invoke the transform by adding the following line after the Extract list of the dns_pdu PDU:
Transform rm_client_from_dns_resp;
HTTP is a little trickier. We have to remove the attribute carrying ip.src from both the response and the "continuations" of the response, but as there is nothing to filter on for the continuations, we have to add a fake attribute first. And then we have to remove client when the fake attribute appears. This is possible due to the fact that the Match clauses in the Transform are executed one by one until one of them succeeds. First, we declare another two Transforms:
Transform rm_client_from_http_resp1 {
Match (http_rq); //first match wins so the request won't get the not_rq attribute inserted
Match Every (addr) Insert (not_rq); //this line won't be evaluated if the first one matched so not_rq won't be inserted to requests
};
Transform rm_client_from_http_resp2 {
Match (not_rq, client) Replace (); //replace "client and not_rq" with nothing (will happen only in the response and eventual parts of it)
};
Next, we add another Extract statement to the http_pdu declaration, and apply both Transforms declared above in a proper order:
Extract client From ip.src;
Transform rm_client_from_http_resp1, rm_client_from_http_resp2;
In MATE, all the Transform_s listed for an item will be evaluated, while inside a single _Transform, the evaluation will stop at the first successful Match clause. That’s why we first just match http_rq to get out of the first sequence before adding the not_rq attribute. Then we apply the second Transform which removes both not_rq and client if both are there. Yes, _Transform_s are cumbersome, but they are very useful.
Once we got all what we need in the PDUs, we have to tell MATE to copy the attribute client from the PDUs to the respective GOPs, by adding client to Extra lists of both Gop declarations:
Extra (host, client);
On top of that, we need to modify the old declarations of GOP key to new ones that include both client and host. So we change the Gog Member declarations the following way:
Member http_req (host, client);
Member dns_req (host, client);
Now we got it, every "usage" gets its own GOG.
The following is a collection of various configuration examples for MATE. Many of them are useless because the "conversations" facility does a better job. Anyway they are meant to help users understanding how to configure MATE.
The following example creates a GOP out of every TCP session.
Transform add_tcp_stop {
Match (tcp_flags_reset="True") Insert (tcp_stop="True");
Match (tcp_flags_fin="True") Insert (tcp_stop="True");
};
Pdu tcp_pdu Proto tcp Transport ip {
Extract addr From ip.addr;
Extract port From tcp.port;
Extract tcp_start From tcp.flags.syn;
Extract tcp_flags_reset From tcp.flags.reset;
Extract tcp_flags_fin From tcp.flags.fin;
Transform add_tcp_stop;
};
Gop tcp_ses On tcp_pdu Match (addr, addr, port, port) {
Start (tcp_start="True");
Stop (tcp_stop="True");
};
Done;
This probably would do fine in 99.9% of the cases but 10.0.0.1:20→10.0.0.2:22 and 10.0.0.1:22→10.0.0.2:20 would both fall into the same gop if they happen to overlap in time.
- filtering with mate.tcp_ses.Time > 1 will give all the sessions that last more than one second
- filtering with mate.tcp_ses.NumOfPdus < 5 will show all tcp sessions that have less than 5 packets.
- filtering with mate.tcp_ses.Id == 3 will show all the packets for the third tcp session MATE has found
This configuration allows to tie a complete passive FTP session (including the data transfer) in a single GOG.
Pdu ftp_pdu Proto ftp Transport tcp/ip {
Extract ftp_addr From ip.addr;
Extract ftp_port From tcp.port;
Extract ftp_resp From ftp.response.code;
Extract ftp_req From ftp.request.command;
Extract server_addr From ftp.passive.ip;
Extract server_port From ftp.passive.port;
LastPdu true;
};
Pdu ftp_data_pdu Proto ftp-data Transport tcp/ip{
Extract server_addr From ip.src;
Extract server_port From tcp.srcport;
};
Gop ftp_data On ftp_data_pdu Match (server_addr, server_port) {
Start (server_addr);
};
Gop ftp_ctl On ftp_pdu Match (ftp_addr, ftp_addr, ftp_port, ftp_port) {
Start (ftp_resp=220);
Stop (ftp_resp=221);
Extra (server_addr, server_port);
};
Gog ftp_ses {
Member ftp_ctl (ftp_addr, ftp_addr, ftp_port, ftp_port);
Member ftp_data (server_addr, server_port);
};
Done;
Note: not having anything to distinguish between ftp-data packets makes this config to create one GOP for every ftp-data packet instead of each transfer. Pre-started GOPs would avoid this.
Spying on people, in addition to being immoral, is illegal in many countries. This is an example meant to explain how to do it not an invitation to do so. It’s up to the police to do this kind of job when there is a good reason to do so.
Pdu radius_pdu On radius Transport udp/ip {
Extract addr From ip.addr;
Extract port From udp.port;
Extract radius_id From radius.id;
Extract radius_code From radius.code;
Extract user_ip From radius.framed_addr;
Extract username From radius.username;
}
Gop radius_req On radius_pdu (radius_id, addr, addr, port, port) {
Start (radius_code {1|4|7} );
Stop (radius_code {2|3|5|8|9} );
Extra (user_ip, username);
}
// we define the smtp traffic we want to filter
Pdu user_smtp Proto smtp Transport tcp/ip {
Extract user_ip From ip.addr;
Extract smtp_port From tcp.port;
Extract tcp_start From tcp.flags.syn;
Extract tcp_stop From tcp.flags.reset;
}
Gop user_smtp_ses On user_smtp (user_ip, user_ip, smtp_port!25) {
Start (tcp_start=1);
Stop (tcp_stop=1);
}
// with the following group of groups we'll group together the radius and the smtp
// we set a long expiration to avoid the session expire on long pauses.
Gog user_mail {
Expiration 1800;
Member radius_req (user_ip);
Member user_smtp_ses (user_ip);
Extra (username);
}
Done;
Filtering the capture file with mate.user_mail.username == "theuser" will filter the RADIUS packets and SMTP traffic for "theuser".
This configuration will create a GOG out of every call.
Pdu q931 Proto q931 Transport ip {
Extract addr From ip.addr;
Extract call_ref From q931.call_ref;
Extract q931_msg From q931.message_type;
Extract calling From q931.calling_party_number.digits;
Extract called From q931.called_party_number.digits;
Extract guid From h225.guid;
Extract q931_cause From q931.cause_value;
};
Gop q931_leg On q931 Match (addr, addr, call_ref) {
Start (q931_msg=5);
Stop (q931_msg=90);
Extra (calling, called, guid, q931_cause);
};
Pdu ras Proto h225.RasMessage Transport ip {
Extract addr From ip.addr;
Extract ras_sn From h225.requestSeqNum;
Extract ras_msg From h225.RasMessage;
Extract guid From h225.guid;
};
Gop ras_req On ras Match (addr, addr, ras_sn) {
Start (ras_msg {0|3|6|9|12|15|18|21|26|30} );
Stop (ras_msg {1|2|4|5|7|8|10|11|13|14|16|17|19|20|22|24|27|28|29|31});
Extra (guid);
};
Gog call {
Member ras_req (guid);
Member q931_leg (guid);
Extra (called,calling,q931_cause);
};
Done;
with this we can:
- filter all signalling for a specific caller: mate.call.caller == "123456789"
- filter all signalling for calls with a specific release cause: mate.call.q931_cause == 31
- filter all signalling for very short calls: mate.q931_leg.Time < 5
With this example, all the components of an MMS send or receive will be tied into a single GOG. Note that this example uses the Payload clause because MMS delivery uses MMSE over either HTTP or WSP. As it is not possible to relate the retrieve request to a response by the means of MMSE only (the request is just an HTTP GET without any MMSE), a GOP is made of HTTP PDUs but MMSE data need to be extracted from the bodies.
## WARNING: this example has been blindly translated from the "old" MATE syntax
## and it has been verified that Wireshark accepts it. However, it has not been
## tested against any capture file due to lack of the latter.
Transform rm_client_from_http_resp1 {
Match (http_rq);
Match Every (addr) Insert (not_rq);
};
Transform rm_client_from_http_resp2 {
Match (not_rq,ue) Replace ();
};
Pdu mmse_over_http_pdu Proto http Transport tcp/ip {
Payload mmse;
Extract addr From ip.addr;
Extract port From tcp.port;
Extract http_rq From http.request;
Extract content From http.content_type;
Extract resp From http.response.code;
Extract method From http.request.method;
Extract host From http.host;
Extract content From http.content_type;
Extract trx From mmse.transaction_id;
Extract msg_type From mmse.message_type;
Extract notify_status From mmse.status;
Extract send_status From mmse.response_status;
Transform rm_client_from_http_resp1, rm_client_from_http_resp2;
};
Gop mmse_over_http On mmse_over_http_pdu Match (addr, addr, port, port) {
Start (http_rq);
Stop (http_rs);
Extra (host, ue, resp, notify_status, send_status, trx);
};
Transform mms_start {
Match Loose() Insert (mms_start);
};
Pdu mmse_over_wsp_pdu Proto wsp Transport ip {
Payload mmse;
Extract trx From mmse.transaction_id;
Extract msg_type From mmse.message_type;
Extract notify_status From mmse.status;
Extract send_status From mmse.response_status;
Transform mms_start;
};
Gop mmse_over_wsp On mmse_over_wsp_pdu Match (trx) {
Start (mms_start);
Stop (never);
Extra (ue, notify_status, send_status);
};
Gog mms {
Member mmse_over_http (trx);
Member mmse_over_wsp (trx);
Extra (ue, notify_status, send_status, resp, host, trx);
Expiration 60.0;
};
The MATE library (will) contains GOP definitions for several protocols. Library protocols are included in your MATE config using: _Action=Include; Lib=proto_name;_.
For Every protocol with a library entry, we’ll find defined what from the PDU is needed to create a GOP for that protocol, eventually any criteria and the very essential GOP definition (i.e., Gop, Start and Stop).
|
Note |
|---|---|
|
It seems that this code is written in the old syntax of MATE. So far it has not been transcribed into the new format. It may still form the basis to recreate these in the new format. |
It will create a GOP for every TCP session. If it is used it should be the last one in the list. And every other proto on top of TCP should be declared with LastPdu=TRUE; so that a TCP PDU is not created where another pdu type exists.
Transform add_tcp_stop {
Match (tcp_flags_reset="True") Insert (tcp_stop="True");
Match (tcp_flags_fin="True") Insert (tcp_stop="True");
};
Pdu tcp_pdu Proto tcp Transport ip {
Extract addr From ip.addr;
Extract port From tcp.port;
Extract tcp_start From tcp.flags.syn;
Extract tcp_flags_reset From tcp.flags.reset;
Extract tcp_flags_fin From tcp.flags.fin;
Transform add_tcp_stop;
};
Gop tcp_ses On tcp_pdu Match (addr, addr, port, port) {
Start (tcp_start="True");
Stop (tcp_stop="True");
};
Done;
will create a GOP containing every request and its response (eventually retransmissions too).
Action=PduDef; Name=dns_pdu; Proto=dns; Transport=udp/ip; addr=ip.addr; port=udp.port; dns_id=dns.id; dns_rsp=dns.flags.response; Action=GopDef; Name=dns_req; On=dns_pdu; addr; addr; port!53; dns_id; Action=GopStart; For=dns_req; dns_rsp=0; Action=GopStop; For=dns_req; dns_rsp=1;
A GOP for every transaction.
Action=PduDef; Name=radius_pdu; Proto=radius; Transport=udp/ip; addr=ip.addr; port=udp.port; radius_id=radius.id; radius_code=radius.code; Action=GopDef; Name=radius_req; On=radius_pdu; radius_id; addr; addr; port; port; Action=GopStart; For=radius_req; radius_code|1|4|7; Action=GopStop; For=radius_req; radius_code|2|3|5|8|9;
Action=PduDef; Name=rtsp_pdu; Proto=rtsp; Transport=tcp/ip; addr=ip.addr; port=tcp.port; rtsp_method=rtsp.method; Action=PduExtra; For=rtsp_pdu; rtsp_ses=rtsp.session; rtsp_url=rtsp.url; Action=GopDef; Name=rtsp_ses; On=rtsp_pdu; addr; addr; port; port; Action=GopStart; For=rtsp_ses; rtsp_method=DESCRIBE; Action=GopStop; For=rtsp_ses; rtsp_method=TEARDOWN; Action=GopExtra; For=rtsp_ses; rtsp_ses; rtsp_url;
Most protocol definitions here will create one GOP for every Call Leg unless stated.
Action=PduDef; Name=isup_pdu; Proto=isup; Transport=mtp3; mtp3pc=mtp3.dpc; mtp3pc=mtp3.opc; cic=isup.cic; isup_msg=isup.message_type; Action=GopDef; Name=isup_leg; On=isup_pdu; ShowPduTree=TRUE; mtp3pc; mtp3pc; cic; Action=GopStart; For=isup_leg; isup_msg=1; Action=GopStop; For=isup_leg; isup_msg=16;
Action=PduDef; Name=q931_pdu; Proto=q931; Stop=TRUE; Transport=tcp/ip; addr=ip.addr; call_ref=q931.call_ref; q931_msg=q931.message_type; Action=GopDef; Name=q931_leg; On=q931_pdu; addr; addr; call_ref; Action=GopStart; For=q931_leg; q931_msg=5; Action=GopStop; For=q931_leg; q931_msg=90;
Action=PduDef; Name=ras_pdu; Proto=h225.RasMessage; Transport=udp/ip; addr=ip.addr; ras_sn=h225.RequestSeqNum; ras_msg=h225.RasMessage; Action=PduExtra; For=ras_pdu; guid=h225.guid; Action=GopDef; Name=ras_leg; On=ras_pdu; addr; addr; ras_sn; Action=GopStart; For=ras_leg; ras_msg|0|3|6|9|12|15|18|21|26|30; Action=GopStop; For=ras_leg; ras_msg|1|2|4|5|7|8|10|11|13|14|16|17|19|20|22|24|27|28|29|31; Action=GopExtra; For=ras_leg; guid;
Action=PduDef; Proto=sip_pdu; Transport=tcp/ip; addr=ip.addr; port=tcp.port; sip_method=sip.Method; sip_callid=sip.Call-ID; calling=sdp.owner.username; Action=GopDef; Name=sip_leg; On=sip_pdu; addr; addr; port; port; Action=GopStart; For=sip; sip_method=INVITE; Action=GopStop; For=sip; sip_method=BYE;
Will create a GOP out of every transaction.
To "tie" them to your call’s GoG use: Action=GogKey; Name=your_call; On=mgc_tr; addr!mgc_addr; megaco_ctx;
Action=PduDef; Name=mgc_pdu; Proto=megaco; Transport=ip; addr=ip.addr; megaco_ctx=megaco.context; megaco_trx=megaco.transid; megaco_msg=megaco.transaction; term=megaco.termid; Action=GopDef; Name=mgc_tr; On=mgc_pdu; addr; addr; megaco_trx; Action=GopStart; For=mgc_tr; megaco_msg|Request|Notify; Action=GopStop; For=mgc_tr; megaco_msg=Reply; Action=GopExtra; For=mgc_tr; term^DS1; megaco_ctx!Choose one;
MATE uses AVPs for almost everything: to keep the data it has extracted from the frames' trees as well as to keep the elements of the configuration.
These "pairs" (actually tuples) are made of a name, a value and, in case of configuration AVPs, an operator. Names and values are strings. AVPs with operators other than '=' are used only in the configuration and are used for matching AVPs of PDUs, GOPs and GOGs in the analysis phase.
The name is a string used to refer to a type of AVP. Two attributes won’t match unless their names are identical. Capitalized names are reserved for keywords (you can use them for your elements if you want but I think it’s not the case). MATE attribute names can be used in Wireshark’s display filters the same way like names of protocol fields provided by dissectors, but they are not just references to (or aliases of) protocol fields.
Currently only match operators are defined (there are plans to (re)add transform attributes but some internal issues have to be solved before that). The match operations are always performed between two operands: the value of an AVP stated in the configuration and the value of an AVP (or several AVPs with the same name) extracted from packet data (called "data AVPs"). It is not possible to match data AVPs to each other.
The defined match operators are:
- Equal = test for equality, that is: either the value strings are identical or the match will fail.
- Not Equal ! will match only if the value strings aren’t equal.
- One Of {} will match if one of the value strings listed is equal to the data AVP’s string. Items inside the list’s curly braces are separated with the | character.
- Starts With ^ will match if the configuration value string matches the first characters of the data AVP’s value string.
- Ends With $ will match if the configuration value string matches the last characters of the data AVP’s value string.
- Contains ~ will match if the configuration value string matches a substring of the characters of the data AVP’s value string.
- Lower Than < will match if the data AVP’s value string is semantically lower than the configuration value string.
- Higher Than > will match if the data AVP’s value string is semantically higher than the configuration value string.
- Exists ? (can be omitted) will match if the AVP name matches, regardless what the value string is.
This operator tests whether the values of the operator and the operand AVP are equal.
- Example
- attrib=aaa matches attrib=aaa attrib=aaa does not match attrib=bbb
This operator matches if the value strings of two AVPs are not equal.
- Example
- attrib=aaa matches attrib!bbb attrib=aaa does not match attrib!aaa
The "one of" operator matches if the data AVP value is equal to one of the values listed in the "one of" AVP.
- Example
- attrib=1 matches attrib{1|2|3} attrib=2 matches attrib{1|2|3} attrib=4 does not match attrib{1|2|3}
The "starts with" operator matches if the first characters of the data AVP value are identical to the configuration AVP value.
- Example
- attrib=abcd matches attrib^abc attrib=abc matches attrib^abc attrib=ab does not match attrib^abc attrib=abcd does not match attrib^bcd attrib=abc does not match attrib^abcd
The ends with operator will match if the last bytes of the data AVP value are equal to the configuration AVP value.
- Example
- attrib=wxyz matches attrib$xyz attrib=yz does not match attrib$xyz attrib=abc…wxyz does not match attrib$abc
The "contains" operator will match if the data AVP value contains a string identical to the configuration AVP value.
- Example
- attrib=abcde matches attrib~bcd attrib=abcde matches attrib~abc attrib=abcde matches attrib~cde attrib=abcde does not match attrib~xyz
The "lower than" operator will match if the data AVP value is semantically lower than the configuration AVP value.
- Example
- attrib=abc matches attrib<bcd attrib=1 matches attrib<2 but beware: attrib=10 does not match attrib<9 attrib=bcd does not match attrib<abc attrib=bcd does not match attrib<bcd
BUGS
It should check whether the values are numbers and compare them numerically
The "higher than" operator will match if the data AVP value is semantically higher than the configuration AVP value.
Examples
attrib=bcd matches attrib>abc attrib=3 matches attrib>2 but beware: attrib=9 does not match attrib>10 attrib=abc does not match attrib>bcd attrib=abc does not match attrib>abc
BUGS
It should check whether the values are numbers and compare them numerically
PDUs, GOPs and GOGs use an AVPL to contain the tracing information. An AVPL is an unsorted set of AVPs that can be matched against other AVPLs.
There are three types of match operations that can be performed between AVPLs. The PDU’s/GOP’s/GOG’s AVPL will be always one of the operands; the AVPL operator (match type) and the second operand AVPL will always come from the configuration. Note that a diverse AVP match operator may be specified for each AVP in the configuration AVPL.
An AVPL match operation returns a result AVPL. In Transforms, the result AVPL may be replaced by another AVPL. The replacement means that the existing data AVPs are dropped and the replacement AVPL from the configuration is Merged to the data AVPL of the PDU/GOP/GOG.
- Loose Match: Will match if at least one of the AVPs of the two operand AVPLs match. If it matches, it returns a result AVPL containing all AVPs from the data AVPL that did match the configuration’s AVPs.
- "Every" Match: Will match if none of the AVPs of the configuration AVPL fails to match an AVP in the data AVPL, even if not all of the configuration AVPs have a match. If it matches, it returns a result AVPL containing all AVPs from the data AVPL that did match an AVP in the configuration AVPL.
- Strict Match: Will match if and only if each of the AVPs in the configuration AVPL has at least one match in the data AVPL. If it matches, it returns a result AVPL containing those AVPs from the data AVPL that matched.
A loose match between AVPLs succeeds if at least one of the data AVPs matches at least one of the configuration AVPs. Its result AVPL contains all the data AVPs that matched.
Loose matches are used in Extra operations against the PDU's AVPL to merge the result into GOP's AVPL, and against GOP's AVPL to merge the result into GOG's AVPL. They may also be used in Criteria and Transforms.
Loose Match Examples
(attr_a=aaa, attr_b=bbb, attr_c=xxx) Match Loose (attr_a?, attr_c?) =⇒ (attr_a=aaa, attr_c=xxx)
(attr_a=aaa, attr_b=bbb, attr_c=xxx) Match Loose (attr_a?, attr_c=ccc) =⇒ (attr_a=aaa)
(attr_a=aaa, attr_b=bbb, attr_c=xxx) Match Loose (attr_a=xxx; attr_c=ccc) =⇒ No Match!
An "every" match between AVPLs succeeds if none of the configuration’s AVPs that have a counterpart in the data AVPL fails to match. Its result AVPL contains all the data AVPs that matched.
These may only be used in Criteria and Transforms.
|
Note |
|---|---|
|
As of current (2.0.1), Loose Match does not work as described here, see issue 12184. |
"Every" Match Examples
(attr_a=aaa, attr_b=bbb, attr_c=xxx) Match Every (attr_a?, attr_c?) =⇒ (attr_a=aaa, attr_c=xxx)
(attr_a=aaa, attr_b=bbb, attr_c=xxx) Match Every (attr_a?, attr_c?, attr_d=ddd) =⇒ (attr_a=aaa, attr_c=xxx)
(attr_a=aaa, attr_b=bbb, attr_c=xxx) Match Every (attr_a?, attr_c=ccc) =⇒ No Match!
(attr_a=aaa; attr_b=bbb; attr_c=xxx) Match Every (attr_a=xxx, attr_c=ccc) =⇒ No Match!
A Strict match between AVPLs succeeds if and only if every AVP in the configuration AVPL has at least one counterpart in the data AVPL and none of the AVP matches fails. The result AVPL contains all the data AVPs that matched.
These are used between GOP keys (key AVPLs) and PDU AVPLs. They may also be used in Criteria and Transforms.
Examples
(attr_a=aaa, attr_b=bbb, attr_c=xxx) Match Strict (attr_a?, attr_c=xxx) =⇒ (attr_a=aaa, attr_c=xxx)
(attr_a=aaa, attr_b=bbb, attr_c=xxx, attr_c=yyy) Match Strict (attr_a?, attr_c?) =⇒ (attr_a=aaa, attr_c=xxx, attr_c=yyy)
(attr_a=aaa, attr_b=bbb, attr_c=xxx) Match Strict (attr_a?, attr_c=ccc) =⇒ No Match!
(attr_a=aaa, attr_b=bbb, attr_c=xxx) Match Strict (attr_a?, attr_c?, attr_d?) =⇒ No Match!
An AVPL may be merged into another one. That would add to the latter every AVP from the former that does not already exist there.
This operation is done
- between the result of a key match and the GOP’s or GOG’s AVPL,
- between the result of an Extra match and the GOP’s or GOG’s AVPL,
- between the result of a Transform match and PDU’s/GOP’s AVPL. If the operation specified by the Match clause is Replace, the result AVPL of the match is removed from the item’s AVPL before the modify_avpl is merged into it.
Examples
(attr_a=aaa, attr_b=bbb) "merge" (attr_a=aaa, attr_c=xxx) former becomes (attr_a=aaa, attr_b=bbb, attr_c=xxx)
Can’t have multiple "attr_a" with same value "aaa"
(attr_a=aaa, attr_b=bbb) "merge" (attr_a=aaa, attr_a=xxx) former becomes (attr_a=aaa, attr_a=xxx, attr_b=bbb)
Multiple "attr_a" with different values "aaa" and "xxx"
(attr_a=aaa, attr_b=bbb) "merge" (attr_c=xxx, attr_d=ddd) former becomes (attr_a=aaa, attr_b=bbb, attr_c=xxx, attr_d=ddd)
All AVP names are unique so resulting AVPL contains all AVPs from both AVPLs
The following configuration AVPLs deal with PDU creation and data extraction.
In each frame of the capture, MATE will look for source proto_name's PDUs in the order in which the declarations appear in its configuration and will create PDUs of every type it can from that frame, unless specifically instructed that some PDU type is the last one to be looked for in the frame. If told so for a given type, MATE will extract all PDUs of that type and the previously declared types it finds in the frame but not those declared later.
The complete declaration of a Pdu looks as below; the mandatory order of the diverse clauses is as shown.
Pdu name Proto proto_name Transport {proto1[/proto2/proto3[/...]|mate}; {
Payload proto; //optional, no default value
Extract attribute From proto.field ; //may occur multiple times, at least once
Transform transform1[, transform2[, ...]]; //optional
Criteria {Accept|Reject} {Strict|Every|Loose} match_avpl; //optional
DropUnassigned {TRUE|FALSE}; //optional, default=FALSE
DiscardPduData {TRUE|FALSE}; //optional, default=FALSE
LastPdu {TRUE|FALSE}; //optional, default=FALSE
};
The name is a mandatory attribute of a Pdu declaration. It is chosen arbitrarily, except that each name may only be used once in MATE’s configuration, regardless the class of an item it is used for. The name is used to distinguish between different types of PDUs, GOPs, and GOGs. The name is also used as part of the filterable fields' names related to this type of PDU which MATE creates.
However, several Pdu declarations may share the same name. In such case, all of them are created from each source PDU matching their Proto, Transport, and Payload clauses, while the bodies of their declarations may be totally different from each other. Together with the Accept (or Reject) clauses, this feature is useful when it is necessary to build the PDU’s AVPL from different sets of source fields depending on contents (or mere presence) of other source fields.
Every instance of the protocol proto_name PDU in a frame will generate one PDU with the AVPs extracted from fields that are in the proto_name's range and/or the ranges of underlying protocols specified by the Transport list. It is a mandatory attribute of a Pdu declaration. The proto_name is the name of the protocol as used in Wireshark display filter.
The PDU’s Proto, and its Transport list of protocols separated by / tell MATE which fields of a frame can get into the PDU’s AVPL. In order that MATE would extract an attribute from a frame’s protocol tree, the area representing the field in the hex display of the frame must be within the area of either the Proto or its relative Transports. Transports are chosen moving backwards from the protocol area, in the order they are given.
Proto http Transport tcp/ip does what you’d expect it to - it selects the nearest tcp range that precedes the current http range, and the nearest ip range that precedes that tcp range. If there is another ip range before the nearest one (e.g., in case of IP tunneling), that one is not going to be selected. Transport tcp/ip/ip that "logically" should select the encapsulating IP header too doesn’t work so far.
Once we’ve selected the Proto and Transport ranges, MATE will fetch those protocol fields belonging to them whose extraction is declared using the Extract clauses for the PDU type. The Transport list is also mandatory, if you actually don’t want to use any transport protocol, use Transport mate. (This didn’t work until 0.10.9).
Other than the PDU’s Proto and its Transport protocols, there is also a Payload attribute to tell MATE from which ranges of Proto's payload to extract fields of a frame into the PDU. In order to extract an attribute from a frame’s tree the highlighted area of the field in the hex display must be within the area of the Proto's relative payload(s). Payloads are chosen moving forward from the protocol area, in the order they are given. Proto http Transport tcp/ip Payload mmse will select the first mmse range after the current http range. Once we’ve selected the Payload ranges, MATE will fetch those protocol fields belonging to them whose extraction is declared using the Extract clauses for the PDU type.
Each Extract clause tells MATE which protocol field value to extract as an AVP value and what string to use as the AVP name. The protocol fields are referred to using the names used in Wireshark display filters. If there is more than one such protocol field in the frame, each instance that fulfills the criteria stated above is extracted into its own AVP. The AVP names may be chosen arbitrarily, but to be able to match values originally coming from different PDUs (e.g., hostname from DNS query and a hostname from HTTP GET request) later in the analysis, identical AVP names must be assigned to them and the dissectors must provide the field values in identical format (which is not always the case).
The Transform clause specifies a list of previously declared Transforms to be performed on the PDU’s AVPL after all protocol fields have been extracted to it. The list is always executed completely, left to right. On the contrary, the list of Match clauses inside each individual Transform is executed only until the first match succeeds.
This clause tells MATE whether to use the PDU for analysis. It specifies a match AVPL, an AVPL Match type (Strict, Every, or Loose) and the action to be performed (Accept or Reject) if the match succeeds. Once every attribute has been extracted and eventual transform list has been executed, and if the Criteria clause is present, the PDU’s AVPL is matched against the match AVPL; if the match succeeds, the action specified is executed, i.e., the PDU is accepted or rejected. The default behaviors used if the respective keywords are omitted are Strict and Accept. Accordingly, if the clause is omitted, all PDUs are accepted.
If set to TRUE, MATE will destroy the PDU if it cannot assign it to a GOP. If set to FALSE (the default if not given), MATE will keep them.
If set to TRUE, MATE will delete the PDU’s AVPL once it has analyzed it and eventually extracted some AVPs from it into the GOP’s AVPL. This is useful to save memory (of which MATE uses a lot). If set to FALSE (the default if not given), MATE will keep the PDU attributes.
Declares a Gop type and its candidate key.
Gop name On pduname Match key {
Start match_avpl; // optional
Stop match_avpl; // optional
Extra match_avpl; // optional
Transform transform_list; // optional
Expiration time; // optional
IdleTimeout time; // optional
Lifetime time; // optional
DropUnassigned [TRUE|FALSE]; //optional
ShowTree [NoTree|PduTree|FrameTree|BasicTree]; //optional
ShowTimes [TRUE|FALSE]; //optional, default TRUE
};
The name is a mandatory attribute of a Gop declaration. It is chosen arbitrarily, except that each name may only be used once in MATE’s configuration, regardless the class of an item it is used for. The name is used to distinguish between different types of PDUs, GOPs, and GOGs. The name is also used as part of the filterable fields' names related to this type of GOP which MATE creates.
The name of PDUs which this type of GOP is supposed to be grouping. It is mandatory.
Defines what AVPs form up the key part of the GOP’s AVPL (the GOP’s key AVPL or simply the GOP’s key). All PDUs matching the key AVPL of an active GOP are assigned to that GOP; a PDU which contains the AVPs whose attribute names are listed in the GOP’s key AVPL, but they do not strictly match any active GOP’s key AVPL, will create a new GOP (unless a Start clause is given). When a GOP is created, the elements of its key AVPL are copied from the creating PDU.
If given, it tells MATE what match_avpl must a PDU’s AVPL match, in addition to matching the GOP’s key, in order to start a GOP. If not given, any PDU whose AVPL matches the GOP’s key AVPL will act as a start for a GOP. The PDU’s AVPs matching the match_avpl are not automatically copied into the GOP’s AVPL.
If given, it tells MATE what match_avpl must a PDU’s AVPL match, in addition to matching the GOP’s key, in order to stop a GOP. If omitted, the GOP is "auto-stopped" - that is, the GOP is marked as stopped as soon as it is created. The PDU’s AVPs matching the match_avpl are not automatically copied into the GOP’s AVPL.
If given, tells MATE which AVPs from the PDU’s AVPL are to be copied into the GOP’s AVPL in addition to the GOP’s key.
The Transform clause specifies a list of previously declared Transforms to be performed on the GOP’s AVPL after the AVPs from each new PDU, specified by the key AVPL and the Extra clause’s match_avpl, have been merged into it. The list is always executed completely, left to right. On the contrary, the list of Match clauses inside each individual Transform is executed only until the first match succeeds.
A (floating) number of seconds after a GOP is Stop ped during which further PDUs matching the Stop ped GOP’s key but not the Start condition will still be assigned to that GOP. The default value of zero has an actual meaning of infinity, as it disables this timer, so all PDUs matching the Stop ped GOP’s key will be assigned to that GOP unless they match the Start condition.
A (floating) number of seconds elapsed from the last PDU assigned to the GOP after which the GOP will be considered released. The default value of zero has an actual meaning of infinity, as it disables this timer, so the GOP won’t be released even if no PDUs arrive - unless the Lifetime timer expires.
A (floating) of seconds after the GOP Start after which the GOP will be considered released regardless anything else. The default value of zero has an actual meaning of infinity.
Whether or not a GOP that has not being assigned to any GOG should be discarded. If TRUE, the GOP is discarded right after creation. If FALSE, the default, the unassigned GOP is kept. Setting it to TRUE helps save memory and speed up filtering.
Controls the display of PDUs subtree of the GOP:
- NoTree: completely suppresses showing the tree
- PduTree: the tree is shown and shows the PDUs by PDU Id
- FrameTree: the tree is shown and shows the PDUs by the frame number in which they are
- BasicTree: needs investigation
Declares a Gog type and its candidate key.
Gog name {
Member gopname (key); // mandatory, at least one
Extra match_avpl; // optional
Transform transform_list; // optional
Expiration time; // optional, default 2.0
GopTree [NoTree|PduTree|FrameTree|BasicTree]; // optional
ShowTimes [TRUE|FALSE]; // optional, default TRUE
};
The name is a mandatory attribute of a Gog declaration. It is chosen arbitrarily, except that each name may only be used once in MATE’s configuration, regardless the class of an item it is used for. The name is used to distinguish between different types of PDUs, GOPs, and GOGs. The name is also used as part of the filterable fields' names related to this type of GOG which MATE creates.
Defines the key AVPL for the GOG individually for each GOP type gopname. All gopname type GOPs whose key AVPL matches the corresponding key AVPL of an active GOG are assigned to that GOG; a GOP which contains the AVPs whose attribute names are listed in the GOG’s corresponding key AVPL, but they do not strictly match any active GOG’s key AVPL, will create a new GOG. When a GOG is created, the elements of its key AVPL are copied from the creating GOP.
Although the key AVPLs are specified separately for each of the Member gopnames, in most cases they are identical, as the very purpose of a GOG is to group together GOPs made of PDUs of different types.
If given, tells MATE which AVPs from any of the GOP’s AVPL are to be copied into the GOG’s AVPL in addition to the GOG’s key.
A (floating) number of seconds after all the GOPs assigned to a GOG have been released during which new GOPs matching any of the session keys should still be assigned to the existing GOG instead of creating a new one. Its value can range from 0.0 to infinite. Defaults to 2.0 seconds.
The Transform clause specifies a list of previously declared Transforms to be performed on the GOG’s AVPL after the AVPs from each new GOP, specified by the key AVPL and the Extra clause’s match_avpl, have been merged into it. The list is always executed completely, left to right. On the contrary, the list of Match clauses inside each individual Transform is executed only until the first match succeeds.
Controls the display of GOPs subtree of the GOG:
- NoTree: completely suppresses showing the tree
- BasicTree: needs investigation
- FullTree: needs investigation
A Transform is a sequence of Match rules optionally followed by an instruction how to modify the match result using an additional AVPL. Such modification may be an Insert (merge) or a Replace. The syntax is as follows:
Transform name {
Match [Strict|Every|Loose] match_avpl [[Insert|Replace] modify_avpl] ; // may occur multiple times, at least once
};
For examples of Transforms, check the Manual page.
TODO: migrate the examples here?
The list of Match rules inside a Transform is processed top to bottom; the processing ends as soon as either a Match rule succeeds or all have been tried in vain.
Transforms can be used as helpers to manipulate an item’s AVPL before the item is processed further. An item declaration may contain a Transform clause indicating a list of previously declared Transforms. Regardless whether the individual transforms succeed or fail, the list is always executed completely and in the order given, i.e., left to right.
In MATE configuration file, a Transform must be declared before declaring any item which uses it.
|
Note |
|---|---|
|
The Settings parameters have been moved to other configuration parameters or deprecated. Leave for now until rest of document is updated for current syntax. |
The Settings config element is used to pass to MATE various operational parameters. the possible parameters are
How long in seconds after all the GOPs assigned to a GOG have been released new GOPs matching any of the session keys should create a new GOG instead of being assigned to the previous one. Its value can range from 0.0 to infinite. Defaults to 2.0 seconds.
Whether or not the AVPL of every PDU should be deleted after it was being processed (saves memory). It can be either TRUE or FALSE. Defaults to TRUE. Setting it to FALSE can save you from a headache if your config does not work.
Whether PDUs should be deleted if they are not assigned to any GOP. It can be either TRUE or FALSE. Defaults to FALSE. Set it to TRUE to save memory if unassigned PDUs are useless.
Whether GOPs should be deleted if they are not assigned to any session. It can be either TRUE or FALSE. Defaults to FALSE. Setting it to TRUE saves memory.
The following settings are used to debug MATE and its configuration. All levels are integers ranging from 0 (print only errors) to 9 (flood me with junk), defaulting to 0.
Debug {
Filename "path/name"; //optional, no default value
Level [0-9]; //optional, generic debug level
Pdu Level [0-9]; //optional, specific debug level for Pdu handling
Gop Level [0-9]; //optional, specific debug level for Gop handling
Gog Level [0-9]; //optional, specific debug level for Gog handling
};
The {{{path/name}}} is a full path to the file to which debug output is to be written. Non-existent file will be created, existing file will be overwritten at each opening of a capture file. If the statement is missing, debug messages are written to console, which means they are invisible on Windows.
Sets the level of debugging for generic debug messages. It is an integer ranging from 0 (print only errors) to 9 (flood me with junk).
Sets the level of debugging for messages regarding PDU creation. It is an integer ranging from 0 (print only errors) to 9 (flood me with junk).
Sets the level of debugging for messages regarding PDU analysis (that is how do they fit into ?GOPs). It is an integer ranging from 0 (print only errors) to 9 (flood me with junk).
Will include a file to the configuration.
Action=Include; {Filename=filename;|Lib=libname;}
The filename of the file to include. If it does not begin with '/' it will look for the file in the current path.
The name of the lib config to include. will look for libname.mate in wiresharks_dir/matelib.
Table of Contents
Wireshark provides you with additional information generated out of the plain packet data or it may need to indicate dissection problems. Messages generated by Wireshark are usually placed in square brackets (“[]”).
These messages might appear in the packet list.
Malformed packet means that the protocol dissector can’t dissect the contents of the packet any further. There can be various reasons:
- Wrong dissector: Wireshark erroneously has chosen the wrong protocol dissector for this packet. This will happen e.g., if you are using a protocol not on its well known TCP or UDP port. You may try Analyze|Decode As to circumvent this problem.
- Packet not reassembled: The packet is longer than a single frame and it is not reassembled, see Section 7.8, “Packet Reassembly” for further details.
- Packet is malformed: The packet is actually wrong (malformed), meaning that a part of the packet is just not as expected (not following the protocol specifications).
- Dissector is buggy: The corresponding protocol dissector is simply buggy or still incomplete.
Any of the above is possible. You’ll have to look into the specific situation to determine the reason. You could disable the dissector by disabling the protocol on the Analyze menu and check how Wireshark displays the packet then. You could (if it’s TCP) enable reassembly for TCP and the specific dissector (if possible) in the Edit|Preferences menu. You could check the packet contents yourself by reading the packet bytes and comparing it to the protocol specification. This could reveal a dissector bug. Or you could find out that the packet is indeed wrong.
The packet size was limited during capture, see “Limit each packet to n bytes” at the Section 4.5, “The “Capture Options” Dialog Box”. While dissecting, the current protocol dissector was simply running out of packet bytes and had to give up. There’s nothing else you can do now, except to repeat the whole capture process again with a higher (or no) packet size limitation.
These messages might appear in the packet details.
The current packet is the request of a detected request/response pair. You can directly jump to the corresponding response packet by double-clicking on the message.
Table of Contents
To understand which information will remain available after the captured packets are saved to a capture file, it’s helpful to know a bit about the capture file contents.
Wireshark uses the pcapng file format as the default format to save captured packets. It is very flexible but other tools may not support it.
Wireshark also supports the libpcap file format. This is a much simpler format and is well established. However, it has some drawbacks: it’s not extensible and lacks some information that would be really helpful (e.g., being able to add a comment to a packet such as “the problems start here” would be really nice).
In addition to the libpcap format, Wireshark supports several different capture file formats. However, the problems described above also applies for these formats.
At the start of each libpcap capture file some basic information is stored like a magic number to identify the libpcap file format. The most interesting information of this file start is the link layer type (Ethernet, 802.11, MPLS, etc.).
The following data is saved for each packet:
- The timestamp with millisecond resolution
- The packet length as it was “on the wire”
- The packet length as it’s saved in the file
- The packet’s raw bytes
A detailed description of the libpcap file format can be found at https://wiki.wireshark.org/Development/LibpcapFileFormat
You should also know the things that are not saved in capture files:
- Current selections (selected packet, …)
-
Name resolution information. See Section 7.9, “Name Resolution” for details
Pcapng files can optionally save name resolution information. Libpcap files can’t. Other file formats have varying levels of support.
- The number of packets dropped while capturing
- Packet marks set with “Edit/Mark Packet”
- Time references set with “Edit/Time Reference”
- The current display filter
To match the different policies for Unix-like systems and Windows, and different policies used on different Unix-like systems, the folders containing configuration files and plugins are different on different platforms. We indicate the location of the top-level folders under which configuration files and plugins are stored here, giving them placeholder names independent of their actual location, and use those names later when giving the location of the folders for configuration files and plugins.
|
Tip |
|---|---|
|
A list of the folders Wireshark actually uses can be found under the Folders tab in the dialog box shown when you select About Wireshark from the Help menu. |
%APPDATA% is the personal application data folder, e.g.: C:\Users\username\AppData\Roaming\Wireshark (details can be found at: Section B.5.1, “Windows profiles”).
WIRESHARK is the Wireshark program folder, e.g.: C:\Program Files\Wireshark.
$XDG_CONFIG_HOME is the folder for user-specific configuration files. It’s usually $HOME/.config, where $HOME is the user’s home folder, which is usually something such as /home/username, or /Users/username on macOS.
If you are using macOS and you are running a copy of Wireshark
installed as an application bundle, APPDIR is the top-level directory
of the Wireshark application bundle, which will typically be
/Applications/Wireshark.app. Otherwise, INSTALLDIR is the top-level
directory under which reside the subdirectories in which components of
Wireshark are installed. This will typically be /usr if Wireshark is
bundled with the system (for example, provided as a package with a Linux
distribution) and /usr/local if, for example, you’ve built Wireshark
from source and installed it.
Wireshark uses a number of configuration files while it is running. Some of these reside in the personal configuration folder and are used to maintain information between runs of Wireshark, while some of them are maintained in system areas.
The content format of the configuration files is the same on all platforms.
On Windows:
- The personal configuration folder for Wireshark is the Wireshark sub-folder of that folder, i.e., %APPDATA%\Wireshark.
- The global configuration folder for Wireshark is the Wireshark program folder and is also used as the system configuration folder.
On Unix-like systems:
- The personal configuration folder is $XDG_CONFIG_HOME/wireshark. For backwards compatibility with Wireshark before 2.2, if $XDG_CONFIG_HOME/wireshark does not exist and $HOME/.wireshark is present, then the latter will be used.
- If you are using macOS and you are running a copy of Wireshark installed as an application bundle, the global configuration folder is APPDIR/Contents/Resources/share/wireshark. Otherwise, the global configuration folder is INSTALLDIR/share/wireshark.
- The /etc folder is the system configuration folder. The folder actually used on your system may vary, maybe something like: /usr/local/etc.
Table B.1. Configuration files overview
| File/Folder | Description |
|---|---|
cfilters |
Capture filters. |
colorfilters |
Coloring rules. |
dfilter_buttons |
Display filter buttons. |
dfilters |
Display filters. |
disabled_protos |
Disabled protocols. |
dmacros |
Display filter macros. |
ethers |
Ethernet name resolution. |
hosts |
IPv4 and IPv6 name resolution. |
ipxnets |
IPX name resolution. |
manuf |
Ethernet name resolution. |
preferences |
Settings from the Preferences dialog box. |
recent |
Per-profile GUI settings. |
recent_common |
Common GUI settings. |
services |
Network services. |
ss7pcs |
SS7 point code resolution. |
subnets |
IPv4 subnet name resolution. |
subnetsipv6 |
IPv6 subnet name resolution. |
vlans |
VLAN ID name resolution. |
wka |
Well-known MAC addresses. |
File contents
- cfilters
-
This file contains all the capture filters that you have defined and saved. It consists of one or more lines, where each line has the following format:
"<filter name>" <filter string>
At program start, if there is a cfilters file in the personal configuration folder, it is read. If there isn’t a cfilters file in the personal configuration folder, then, if there is a cfilters file in the global configuration folder, it is read.
When you press the Save button in the “Capture Filters” dialog box, all the current capture filters are written to the personal capture filters file.
- colorfilters
-
This file contains all the color filters that you have defined and saved. It consists of one or more lines, where each line has the following format:
@<filter name>@<filter string>@[<bg RGB(16-bit)>][<fg RGB(16-bit)>]
At program start, if there is a colorfilters file in the personal configuration folder, it is read. If there isn’t a colorfilters file in the personal configuration folder, then, if there is a colorfilters file in the global configuration folder, it is read.
When you press the Save button in the “Coloring Rules” dialog box, all the current color filters are written to the personal color filters file.
- dfilter_buttons
-
This file contains all the display filter buttons that you have defined and saved. It consists of one or more lines, where each line has the following format:
"TRUE/FALSE","<button label>","<filter string>","<comment string>"
where the first field is TRUE if the button is enabled (shown).
At program start, if there is a dfilter_buttons file in the personal configuration folder, it is read. If there isn’t a dfilter_buttons file in the personal configuration folder, then, if there is a dfilter_buttons file in the global configuration folder, it is read.
When you save any changes to the filter buttons, all the current display filter buttons are written to the personal display filter buttons file.
- dfilters
-
This file contains all the display filters that you have defined and saved. It consists of one or more lines, where each line has the following format:
"<filter name>" <filter string>
At program start, if there is a dfilters file in the personal configuration folder, it is read. If there isn’t a dfilters file in the personal configuration folder, then, if there is a dfilters file in the global configuration folder, it is read.
When you press the Save button in the “Display Filters” dialog box, all the current display filters are written to the personal display filters file.
- disabled_protos
-
Each line in this file specifies a disabled protocol name. The following are some examples:
tcp udp
At program start, if there is a disabled_protos file in the global configuration folder, it is read first. Then, if there is a disabled_protos file in the personal configuration folder, that is read; if there is an entry for a protocol set in both files, the setting in the personal disabled protocols file overrides the setting in the global disabled protocols file.
When you press the Save button in the “Enabled Protocols” dialog box, the current set of disabled protocols is written to the personal disabled protocols file.
- dmacros
-
This file contains all the display filter macros that you have defined and saved. It consists of one or more lines, where each line has the following format:
"<macro name>" <macro expression>
At program start, if there is a dmacros file in the personal configuration folder, it is read. If there isn’t a dmacros file in the personal configuration folder, then, if there is a dmacros file in the global configuration folder, it is read.
In versions of Wireshark prior to 4.4, the display filter macros were stored in a dfilter_macros file with a somewhat different format, a UAT. At program start if the dmacros file is not found a dfilter_macros file is looked for in the personal and global configuration folders and converted to the new format.
When you press the Save button in the "Display Filter Macros" dialog box, all the current display filter macros are written to the personal display filter macros file.
More information about Display Filter Macros is available in Section 6.7, “Defining And Saving Filter Macros”
- ethers
-
When Wireshark is trying to translate a hardware MAC or EUI-64 address to a name, it consults the ethers file in the personal configuration folder first. If the address is not found in that file, Wireshark consults the ethers file in the system configuration folder.
This file has a similar format to the /etc/ethers file on some UNIX-like systems. Each line in these files consists of one hardware address and name separated by whitespace (tabs or spaces). The hardware addresses are expressed as pairs of hexadecimal digits separated by colons (:), dashes (-), or periods(.), with the same separator used in the entire address. A
#can be used to indicate a comment that extends to the rest of the line. NIS lookups, as in some UNIX-like systems, are not supported. Both 6 byte MAC and 8 byte EUI-64 addresses are supported. The following are some examples:ff-ff-ff-ff-ff-ff Broadcast c0-00-ff-ff-ff-ff TR_broadcast 00.2b.08.93.4b.a1 Freds_machine 00:00:00:00:00:00:00:00 zb_zero_broadcast
The settings from this file are read in at program start, and reloaded when opening a new capture file or changing the configuration profile, and never written by Wireshark.
- hosts
-
Wireshark uses the entries in the hosts files to translate IPv4 and IPv6 addresses into names.
Wireshark reads hosts files from multiple locations in a hierarchical manner:
-
Global hosts file (e.g.,
C:\Program Files\Wireshark\hostson Windows) -
Base personal hosts file (e.g.,
%APPDATA%\Wireshark\hostson Windows) -
Profile hosts file (e.g.,
%APPDATA%\Wireshark\profiles\<name>\hostson Windows)
All three files are read in sequence. When entries conflict, the last file loaded wins, creating a three-tier precedence system: - Enterprise/global settings (lowest priority) - User-wide personal overrides (medium priority) - Profile-specific overrides (highest priority)
The profile hosts file is always loaded when name resolution is enabled. The base personal hosts file allows users to maintain user-wide name resolution mappings across all profiles without needing write access to system directories or duplicating entries in every profile.
This file has the same format as the usual /etc/hosts file on Unix systems.
An example is:
# Comments must be prepended by the # sign!
192.168.0.1 homeserver
The settings from these files are read in at program start, and reloaded when opening a new capture file or changing the configuration profile, and never written by Wireshark.
-
Global hosts file (e.g.,
- ipxnets
-
When Wireshark is trying to translate an IPX network number to a name, it consults the ipxnets file in the personal configuration folder first. If the address is not found in that file, Wireshark consults the ipxnets file in the system configuration folder.
An example is:
C0.A8.2C.00      HR
c0-a8-1c-00      CEO
00:00:BE:EF      IT_Server1
110f             FileServer3
The settings from this file are read in when an IPX network number is to be translated to a name, and never written by Wireshark.
- manuf
-
At program start, if there is a manuf file in the global configuration folder, it is read first. Then, if there is a manuf file in the personal configuration folder, that is read; if there is an entry for a given address prefix in both files, the setting in the personal file overrides the entry in the global file.
The entries in this file are used to translate MAC address prefixes into short and long manufacturer names. Each line consists of a MAC address prefix followed by an abbreviated manufacturer name and the full manufacturer name. Prefixes 24 bits long by default and may be followed by an optional length. Note that this is not the same format as the ethers file, which does not allow prefix lengths.
Examples are:
00:00:01        Xerox   Xerox Corporation
00:50:C2:00:30:00/36      Microsoft        Microsoft
In earlier versions of Wireshark, official information from the IEEE Registration Authority was distributed in this format as the manuf file in the global configuration folder. In current versions of Wireshark, this information is compiled into the program to speed startup, but if a file is present in the global configuration folder it is still read, and can be used to supplement or replace the official data just as the personal file does. The compiled-in information can be written out in this format as a report with
tshark -G manuf.The settings from this file are read in at program start, and reloaded when opening a new capture file or changing the configuration profile, and never written by Wireshark.
- preferences
-
This file contains your Wireshark preferences, including defaults for capturing and displaying packets. It is a simple text file containing statements of the form:
variable: value
At program start, if there is a preferences file in the global configuration folder, it is read first. Then, if there is a preferences file in the personal configuration folder, that is read; if there is a preference set in both files, the setting in the personal preferences file overrides the setting in the global preference file.
If you press the Save button in the “Preferences” dialog box, all the current settings are written to the personal preferences file.
- recent
-
This file contains GUI settings that are specific to the current profile, such as column widths and toolbar visibility. It is a simple text file containing statements of the form:
variable: value
It is read at program start and written when preferences are saved and at program exit. It is also written and read whenever you switch to a different profile.
- recent_common
-
This file contains common GUI settings, such as recently opened capture files, recently used filters, and window geometries. It is a simple text file containing statements of the form:
variable: value
It is read at program start and written when preferences are saved and at program exit.
- services
-
Wireshark uses the services files to translate port numbers into names.
At program start, if there is a services file in the global configuration folder, it is read first. Then, if there is a services file in the personal configuration folder, that is read; if there is an entry for a given port number in both files, the setting in the personal services file overrides the entry in the global services file. The format is that of the standard services(5) file on UNIX-compatible systems.
An example is:
mydns       5045/udp     # My own Domain Name Server
mydns       5045/tcp     # My own Domain Name Server
In earlier versions of Wireshark, official information from the IANA Service Name and Transport Protocol Port Number Registry was distributed in this format as the services file in the global configuration folder. In current versions of Wireshark, this information is compiled into the program to speed startup, but if a file is present in the global configuration folder it is still read, and can be used to supplement or replace the official data just as the personal file does. The compiled-in information can be written out in this format as a report with
tshark -G services.The settings from this file are read in at program start, and reloaded when opening a new capture file or changing the configuration profile, and never written by Wireshark.
- ss7pcs
-
Wireshark uses the ss7pcs file to translate SS7 point codes to node names.
At program start, if there is a ss7pcs file in the personal configuration folder, it is read.
Each line in this file consists of one network indicator followed by a dash followed by a point code in decimal and a node name separated by whitespace or tab.
An example is:
2-1234 MyPointCode1
The settings from this file are read in at program start, and reloaded when opening a new capture file opens or changing the configuration profile, and never written by Wireshark.
- subnets and subnetsipv6
-
Wireshark uses the subnets and subnetsipv6 files to translate an IP address into a subnet name. If no exact match from a hosts file or from DNS is found, Wireshark will attempt a partial match for the subnet of the address.
At program start, if there is a subnets or subnetsipv6 file in the personal configuration folder, it is read first. Then, if there is a subnets or subnetsipv6 file in the global configuration folder, that is read; if there is a preference set in both files, the setting in the global preferences file overrides the setting in the personal preference file.
Each line in one of these files consists of an IP address, a subnet mask length separated only by a “/” and a name separated by whitespace. While the address must be a full IP address, any values beyond the mask length are subsequently ignored.
An example is:
# Comments must be prepended by the # sign!
192.168.0.0/24 ws_test_network
or
2001:DB8::/32 documentation
A partially matched name will be printed as “subnet-name.remaining-address”. For example, “192.168.0.1” under the subnet above would be printed as “ws_test_network.1”; if the mask length above had been 16 rather than 24, the printed address would be “ws_test_network.0.1”.
The settings from these files are read in at program start, and reloaded when opening a new capture file or changing the configuration profile, and never written by Wireshark.
The subnets file also changes the behavior of the Endpoints and Conversations Statistics dialogs for the IPv4 protocol when the IPv4 user preference Aggregate subnets in Statistics Dialogs is enabled. In this case, when an IPv4 address matches a subnet, the statistics dialog will show this subnet instead of the IPv4 address.
- vlans
-
Wireshark uses the vlans file to translate VLAN tag IDs into names.
If there is a vlans file in the currently active profile folder, it is used. Otherwise, the vlans file in the personal configuration folder is used.
Each line in this file consists of one VLAN tag ID and a describing name separated by whitespace or tab.
An example is:
123     Server-LAN
2049    HR-Client-LAN
The settings from this file are read in when a VLAN ID is to be translated to a name, and never written by Wireshark.
- wka
-
At program start, if there is a wka file in the global configuration folder, it is read.
The entries in this file are used to translate MAC addresses and MAC address prefixes into names. The format is that of the manuf file. This file is distributed with Wireshark, and contains data assembled from various non IEEE but respected sources.
The settings from this file are read in at program start, and reloaded when opening a new capture file or changing the configuration profile, and never written by Wireshark.
Wireshark supports plugins for various purposes. Plugins can either be scripts written in Lua or code written in C or C++ and compiled to machine code.
Wireshark looks for plugins in both a personal plugin folder and a global plugin folder. Lua plugins are stored in the plugin folders; compiled plugins are stored in subfolders of the plugin folders, with the subfolder name being the Wireshark minor version number (X.Y). There is another hierarchical level for each Wireshark plugin type (libwireshark, libwiretap and codecs). So for example the location for a libwireshark plugin foo.so (foo.dll on Windows) would be PLUGINDIR/X.Y/epan (libwireshark used to be called libepan; the other folder names are codecs and wiretap).
On Windows:
- The personal plugin folder is %APPDATA%\Wireshark\plugins.
- The global plugin folder is WIRESHARK\plugins.
On Unix-like systems:
- The personal plugin folder is ~/.local/lib/wireshark/plugins.
|
Note |
|---|---|
|
To provide better support for binary plugins this folder changed in Wireshark 2.5. It is recommended to use the new folder but for Lua scripts only you may continue to use $XDG_CONFIG_HOME/wireshark/plugins for backward-compatibility. This is useful to have older versions of Wireshark installed side-by-side. In case of duplicate file names between old and new the new folder wins. |
- If you are running on macOS and Wireshark is installed as an application bundle, the global plugin folder is %APPDIR%/Contents/PlugIns/wireshark, otherwise it’s INSTALLDIR/lib/wireshark/plugins.
Here you will find some details about the folders used in Wireshark on different Windows versions.
As already mentioned, you can find the currently used folders in the “About Wireshark” dialog.
Windows uses some special directories to store user configuration files which define the “user profile”. This can be confusing, as the default directory location changed from Windows version to version and might also be different for English and internationalized versions of Windows.
|
Note |
|---|---|
|
If you’ve upgraded to a new Windows version, your profile might be kept in the former location. The defaults mentioned here might not apply. |
The following guides you to the right place where to look for Wireshark’s profile data.
- Windows 11, Windows 10, Windows 8.1, Windows 8, Windows 7, Windows Vista, and associated server editions
- C:\Users\username\AppData\Roaming\Wireshark.
- Windows XP and Windows Server 2003 [1]
- C:\Documents and Settings\username\Application Data. “Documents and Settings” and “Application Data” might be internationalized.
Some larger Windows environments use roaming profiles. If this is the case the configurations of all programs you use won’t be saved on your local hard drive. They will be stored on the domain server instead.
Your settings will travel with you from computer to computer with one exception. The “Local Settings” folder in your profile data (typically something like: C:\Documents and Settings\username\Local Settings) will not be transferred to the domain server. This is the default for temporary capture files.
Wireshark uses the folder which is set by the TMPDIR or TEMP environment variable. This variable will be set by the Windows installer.
- Windows 11, Windows 10, Windows 8.1, Windows 8, Windows 7, Windows Vista, and associated server editions
- C:\Users\username\AppData\Local\Temp
- Windows XP and Windows Server 2003 [1]
- C:\Documents and Settings\username\Local Settings\Temp
Wireshark distinguishes between protocols (e.g., tcp) and protocol fields (e.g., tcp.port).
A comprehensive list of all protocols and protocol fields can be found in the “Display Filter Reference” at https://www.wireshark.org/docs/dfref/
Table of Contents
- D.1. Introduction
- D.2. tshark: Terminal-based Wireshark
- D.3. tcpdump: Capturing with “tcpdump” for viewing with Wireshark
- D.4. dumpcap: Capturing with “dumpcap” for viewing with Wireshark
- D.5. capinfos: Print information about capture files
- D.6. captype: Prints the types of capture files
- D.7. rawshark: Dump and analyze network traffic.
- D.8. editcap: Edit capture files
- D.9. mergecap: Merging multiple capture files into one
- D.10. text2pcap: Converting ASCII hexdumps to network captures
- D.11. reordercap: Reorder a capture file
- D.12. mmdbresolve: Resolve IP geolocation information
Wireshark comes with an array of command line tools which can be helpful for packet analysis. Some of these tools are described in this chapter. You can find more information about all of Wireshark’s command line tools on the web site.
TShark is a terminal oriented version of Wireshark designed for capturing and
displaying packets when an interactive user interface isn’t necessary or
available. It supports the same options as wireshark. For more information on
tshark consult your local manual page (man tshark) or
the online version.
Help information available from tshark.
TShark (Wireshark) 4.7.3 (v4.7.3rc0-27-g31d0fc1bc625)
Dump and analyze network traffic.
See https://www.wireshark.org for more information.

Usage: tshark [options] ...

Capture interface:
  -i <interface>, --interface <interface>
                           name or idx of interface (def: first non-loopback)
  -f <capture filter>      packet filter in libpcap filter syntax
  -s <snaplen>, --snapshot-length <snaplen>
                           packet snapshot length (def: appropriate maximum)
  -p, --no-promiscuous-mode
                           don't capture in promiscuous mode
  -I, --monitor-mode       capture in monitor mode, if available
  -B <buffer size>, --buffer-size <buffer size>
                           size of kernel buffer in MiB (def: 2MiB)
  -y <link type>, --linktype <link type>
                           link layer type (def: first appropriate)
  --time-stamp-type <type> timestamp method for interface
  -D, --list-interfaces    print list of interfaces and exit
  -L, --list-data-link-types
                           print list of link-layer types of iface and exit
  --list-time-stamp-types  print list of timestamp types for iface and exit
  --no-optimize            do not optimize capture filter

Capture display:
  --update-interval        interval between updates with new packets, in milliseconds (def: 100ms)
Capture stop conditions:
  -c <packet count>        stop after n packets (def: infinite)
  -a <autostop cond.> ..., --autostop <autostop cond.> ...
                           duration:NUM - stop after NUM seconds
                           filesize:NUM - stop this file after NUM KB
                              files:NUM - stop after NUM files
                            packets:NUM - stop after NUM packets
Capture output:
  -b <ringbuffer opt.> ..., --ring-buffer <ringbuffer opt.>
                           duration:NUM - switch to next file after NUM secs
                           filesize:NUM - switch to next file after NUM KB
                              files:NUM - ringbuffer: replace after NUM files
                            packets:NUM - switch to next file after NUM packets
                           interval:NUM - switch to next file when the time is
                                          an exact multiple of NUM secs
                         printname:FILE - print filename to FILE when written
                                          (can use 'stdout' or 'stderr')
Input file:
  -r <infile>, --read-file <infile>
                           set the filename to read from (or '-' for stdin)

Processing:
  -2                       perform a two-pass analysis
  -M <packet count>        perform session auto reset
  -R <read filter>, --read-filter <read filter>
                           packet Read filter in Wireshark display filter syntax
                           (requires -2)
  -Y <display filter>, --display-filter <display filter>
                           packet displaY filter in Wireshark display filter
                           syntax
  -n                       disable all name resolutions (def: "mNd" enabled, or
                           as set in preferences)
  -N <name resolve flags>  enable specific name resolution(s): "mtndsNvg"
  -d <layer_type>==<selector>,<decode_as_protocol> ...
                           "Decode As", see the man page for details
                           Example: tcp.port==8888,http
  -H <hosts file>          read a list of entries from a hosts file, which will
                           then be written to a capture file. (Implies -W n)
  --enable-protocol <proto_name>
                           enable dissection of proto_name
  --disable-protocol <proto_name>
                           disable dissection of proto_name
  --only-protocols <protocols>
                           Only enable dissection of these protocols, comma
                           separated. Disable everything else
  --disable-all-protocols
                           Disable dissection of all protocols
  --enable-heuristic <short_name>
                           enable dissection of heuristic protocol
  --disable-heuristic <short_name>
                           disable dissection of heuristic protocol
Output:
  -w <outfile|->           write packets to a pcapng-format file named "outfile"
                           (or '-' for stdout). If the output filename has the
                           .gz extension, it will be compressed to a gzip archive
  --capture-comment <comment>
                           add a capture file comment, if supported
  -C <config profile>      start with specified configuration profile
  --global-profile         use the global profile instead of personal profile
  -F <output file type>    set the output file type; default is pcapng.
                           an empty "-F" option will list the file types
  -V                       add output of packet tree        (Packet Details)
  -O <protocols>           Only show packet details of these protocols, comma
                           separated
  -P, --print              print packet summary even when writing to a file
  -S <separator>           the line separator to print between packets
  -x                       add output of hex and ASCII dump (Packet Bytes)
  --hexdump <hexoption>    add hexdump, set options for data source and ASCII dump
     all                   dump all data sources (-x default)
     frames                dump only frame data source
     ascii                 include ASCII dump text (-x default)
     delimit               delimit ASCII dump text with '|' characters
     noascii               exclude ASCII dump text
     time                  include frame timestamp preamble
     notime                do not include frame timestamp preamble (-x default)
     help                  display help for --hexdump and exit
  -T pdml|ps|psml|json|jsonraw|ek|tabs|text|fields|?
                           format of text output (def: text)
  -j <protocolfilter>      protocols layers filter if -T ek|pdml|json selected
                           (e.g. "ip ip.flags text", filter does not expand child
                           nodes, unless child is specified also in the filter)
  -J <protocolfilter>      top level protocol filter if -T ek|pdml|json selected
                           (e.g. "http tcp", filter which expands all child nodes)
  -e <field>               field to print if -Tfields selected (e.g. tcp.port,
                           _ws.col.info)
                           this option can be repeated to print multiple fields
  -E<fieldsoption>=<value> set options for output when -Tfields selected:
     bom=y|n               print a UTF-8 BOM
     header=y|n            switch headers on and off
     separator=/t|/s|<char> select tab, space, printable character as separator
     occurrence=f|l|a      print first, last or all occurrences of each field
     aggregator=,|/s|<char> select comma, space, printable character as
                           aggregator
     quote=d|s|n           select double, single, no quotes for values
  -t (a|ad|adoy|d|dd|e|r|rc|u|ud|udoy)[.[N]]|.[N]
                           output format of time stamps (def: r: rel. to first)
  -u s|hms                 output format of seconds (def: s: seconds)
  -l                       flush standard output after each packet
                           (implies --update-interval 0)
  -q                       be more quiet on stdout (e.g. when using statistics)
  -Q                       only log true errors to stderr (quieter than -q)
  -g                       enable group read access on the output file(s)
  -W n                     Save extra information in the file, if supported.
                           n = write network address resolution information
  -X <key>:<value>         eXtension options, see the man page for details
  -U tap_name              PDUs export mode, see the man page for details
  -z <statistics>          various statistics, see the man page for details
  --export-objects <protocol>,<destdir>
                           save exported objects for a protocol to a directory
                           named "destdir"
  --export-tls-session-keys <keyfile>
                           export TLS Session Keys to a file named "keyfile"
  --color                  color output text similarly to the Wireshark GUI,
                           requires a terminal with 24-bit color support
                           Also supplies color attributes to pdml and psml formats
                           (Note that attributes are nonstandard)
  --no-duplicate-keys      If -T json is specified, merge duplicate keys in an object
                           into a single key with as value a json array containing all
                           values
  --elastic-mapping-filter <protocols> If -G elastic-mapping is specified, put only the
                           specified protocols within the mapping file
  --temp-dir <directory>   write temporary files to this directory
                           (default: /tmp)
  --compress <type>        compress the output file using the type compression format

Diagnostic output:
  --log-level <level>       sets the active log level ("critical", "warning", etc.)
  --log-fatal <level>       sets level to abort the program ("critical" or "warning")
  --log-fatal-count <count> sets the number of fatal errors before aborting the program
  --log-domains <[!]list>   comma-separated list of the active log domains
  --log-fatal-domains <list>
                            list of domains that cause the program to abort
  --log-debug <[!]list>     list of domains with "debug" level
  --log-noisy <[!]list>     list of domains with "noisy" level
  --log-file <path>         file to output messages to (in addition to stderr)

Miscellaneous:
  -h, --help               display this help and exit
  -v, --version            display version info and exit
  -o <name>:<value> ...    override preference setting
  -K <keytab>              keytab file to use for kerberos decryption
  -G [report]              dump one of several available reports and exit
                           default report="fields"
                           use "-G help" for more help

Dumpcap can benefit from an enabled BPF JIT compiler if available.
You might want to enable it by executing:
 "echo 1 > /proc/sys/net/core/bpf_jit_enable"
Note that this can make your system less secure!
It’s often more useful to capture packets using tcpdump rather than
wireshark. For example, you might want to do a remote capture and either don’t
have GUI access or don’t have Wireshark installed on the remote machine.
Older versions of tcpdump truncate packets to 68 or 96 bytes. If this is the case,
use -s to capture full-sized packets:
$ tcpdump -i <interface> -s 65535 -w <file>
You will have to specify the correct interface and the name of a file to save into. In addition, you will have to terminate the capture with ^C when you believe you have captured enough packets.
tcpdump is not part of the Wireshark distribution. You can get it from
https://www.tcpdump.org/ or as a standard package in most Linux distributions.
For more information on tcpdump consult your local manual page (man
tcpdump) or the online version.
Dumpcap is a network traffic dump tool. It captures packet data from a live network and writes the packets to a file. Dumpcap’s native capture file format is pcapng, which is also the format used by Wireshark.
By default, Dumpcap uses the pcap library to capture traffic
from the first available network interface and writes the received raw
packet data, along with the packets’ time stamps into a pcapng file. The
capture filter syntax follows the rules of the pcap library. For more
information on dumpcap consult your local manual page (man dumpcap)
or the online version.
Help information available from dumpcap.
Dumpcap (Wireshark) 4.7.3 (v4.7.3rc0-27-g31d0fc1bc625)
Capture network packets and dump them into a pcapng or pcap file.
See https://www.wireshark.org for more information.

Usage: dumpcap [options] ...

Capture interface:
  -i <interface>, --interface <interface>
                           name or idx of interface (def: first non-loopback)
  --ifname <name>          name to use in the capture file for a pipe from which
                           we're capturing
  --ifdescr <description>
                           description to use in the capture file for a pipe
                           from which we're capturing
  -f <capture filter>      packet filter in libpcap filter syntax
  -s <snaplen>, --snapshot-length <snaplen>
                           packet snapshot length (def: appropriate maximum)
  -p, --no-promiscuous-mode
                           don't capture in promiscuous mode
  -I, --monitor-mode       capture in monitor mode, if available
  -B <buffer size>, --buffer-size <buffer size>
                           size of kernel buffer in MiB (def: 2MiB)
  -y <link type>, --linktype <link type>
                           link layer type (def: first appropriate)
  --time-stamp-type <type> timestamp method for interface
  -D, --list-interfaces    print list of interfaces and exit
  -L, --list-data-link-types
                           print list of link-layer types of iface and exit
  --list-time-stamp-types  print list of timestamp types for iface and exit
  --no-optimize            do not optimize capture filter
  --update-interval        interval between updates with new packets, in milliseconds (def: 100ms)
  -d                       print generated BPF code for capture filter
  -k <freq>,[<type>],[<center_freq1>],[<center_freq2>]
                           set channel on wifi interface
  -S                       print statistics for each interface once per second
  -M                       for -D, -L, and -S, produce machine-readable output

Stop conditions:
  -c <packet count>        stop after n packets (def: infinite)
  -a <autostop cond.> ..., --autostop <autostop cond.> ...
                           duration:NUM - stop after NUM seconds
                           filesize:NUM - stop this file after NUM kB
                              files:NUM - stop after NUM files
                            packets:NUM - stop after NUM packets
Output (files):
  -w <filename>            name of file to save (def: tempfile)
  -g                       enable group read access on the output file(s)
  -b <ringbuffer opt.> ..., --ring-buffer <ringbuffer opt.>
                           duration:NUM - switch to next file after NUM secs
                           filesize:NUM - switch to next file after NUM kB
                              files:NUM - ringbuffer: replace after NUM files
                            packets:NUM - ringbuffer: replace after NUM packets
                           interval:NUM - switch to next file when the time is
                                          an exact multiple of NUM secs
                          printname:FILE - print filename to FILE when written
                                           (can use 'stdout' or 'stderr')
  -F                       output file type (default: pcapng)
                           an empty "-F" option will list the file types
  -n                       use pcapng format instead of pcap (default)
  -P                       use libpcap format instead of pcapng
  --capture-comment <comment>
                           add a capture comment to the output file
                           (only for pcapng)
  --temp-dir <directory>   write temporary files to this directory
                           (default: /tmp)

Diagnostic output:
  --log-level <level>       sets the active log level ("critical", "warning", etc.)
  --log-fatal <level>       sets level to abort the program ("critical" or "warning")
  --log-fatal-count <count> sets the number of fatal errors before aborting the program
  --log-domains <[!]list>   comma-separated list of the active log domains
  --log-fatal-domains <list>
                            list of domains that cause the program to abort
  --log-debug <[!]list>     list of domains with "debug" level
  --log-noisy <[!]list>     list of domains with "noisy" level
  --log-file <path>         file to output messages to (in addition to stderr)

Miscellaneous:
  -N <packet_limit>        maximum number of packets buffered within dumpcap
  -C <byte_limit>          maximum number of bytes used for buffering packets
                           within dumpcap
  -t                       use a separate thread per interface
  -q                       don't report packet capture counts
  -Q                       suppress all non-error status messages to stderr
  --application-flavor <flavor>
                           set the application flavor
  -v, --version            print version information and exit
  -h, --help               display this help and exit

Dumpcap can benefit from an enabled BPF JIT compiler if available.
You might want to enable it by executing:
 "echo 1 > /proc/sys/net/core/bpf_jit_enable"
Note that this can make your system less secure!

Example: dumpcap -i eth0 -a duration:60 -w output.pcapng
"Capture packets from interface eth0 until 60s passed into output.pcapng"

Use Ctrl-C to stop capturing at any time.
capinfos can print information about capture files including the file
type, number of packets, date and time information, and file hashes.
Information can be printed in human and machine readable formats. For
more information on capinfos consult your local manual page (man
capinfos) or the online
version.
Help information available from capinfos.
Capinfos (Wireshark) 4.7.3 (v4.7.3rc0-27-g31d0fc1bc625)
Print various information (infos) about capture files.
See https://www.wireshark.org for more information.

Usage: capinfos [options] <infile> ...

General infos:
  -t display the capture file type
  -E display the capture file encapsulation
  -I display the capture file interface information
  -F display additional capture file information
  -H display the SHA256 and SHA1 hashes of the file
  -k display the capture comment
  -p display individual packet comments

Size infos:
  -c display the number of packets
  -s display the size of the file (in bytes)
  -d display the total length of all packets (in bytes)
  -l display the packet size limit (snapshot length)

Time infos:
  -u display the capture duration (in seconds)
  -a display the timestamp of the earliest packet
  -e display the timestamp of the latest packet
  -o display the capture file chronological status (True/False)
  -S display earliest and latest packet timestamps as seconds

Statistic infos:
  -y display average data rate (in bytes/sec)
  -i display average data rate (in bits/sec)
  -z display average packet size (in bytes)
  -x display average packet rate (in packets/sec)

Metadata infos:
  -n display number of resolved IPv4 and IPv6 addresses
  -D display number of decryption secrets

Output format:
  -L generate long report (default)
  -T generate table report
  -M display machine-readable values in long reports

Table report options:
  -R generate header record (default)
  -r do not generate header record

  -B separate infos with TAB character (default)
  -m separate infos with comma (,) character
  -b separate infos with SPACE character

  -N do not quote infos (default)
  -q quote infos with single quotes (')
  -Q quote infos with double quotes (")

Miscellaneous:
  -h, --help               display this help and exit
  -v, --version            display version info and exit
  -C cancel processing if file open fails (default is to continue)
  -A generate all infos (default)
  -K disable displaying the capture comment
  -P disable displaying individual packet comments

Options are processed from left to right order with later options superseding
or adding to earlier options.

If no options are given the default is to display all infos in long report
output format.
captype can print capture file type information about capture files.
For more information on captype consult your local manual page (man
captype) or the online
version.
Help information available from captype.
Captype (Wireshark) 4.7.3 (v4.7.3rc0-27-g31d0fc1bc625)
Print the file types of capture files.
See https://www.wireshark.org for more information.

Usage: captype [options] <infile> ...

Miscellaneous:
  -h, --help               display this help and exit
  -v, --version            display version info and exit
Rawshark reads a stream of packets from a file or pipe, and prints a
line describing its output, followed by a set of matching fields for
each packet on stdout. For more information on rawshark consult your
local manual page (man rawshark) or
the online version.
Help information available from rawshark.
Rawshark (Wireshark) 4.7.3 (v4.7.3rc0-27-g31d0fc1bc625)
Dump and analyze network traffic.
See https://www.wireshark.org for more information.

Usage: rawshark [options] ...

Input file:
  -r <infile>, --read-file <infile>
                            set the pipe or file name to read from

Processing:
  -d <encap:linktype>|<proto:protoname>
                           packet encapsulation or protocol
  -F <field>               field to display
  -m                       virtual memory limit, in bytes
  -n                       disable all name resolutions (def: "mNd" enabled, or
                           as set in preferences)
  -N <name resolve flags>  enable specific name resolution(s): "mnNtdv"
  -p                       use the system's packet header format
                           (which may have 64-bit timestamps)
  -R <read filter>, --read-filter <read filter>
                           packet filter in Wireshark display filter syntax
  -s                       skip PCAP header on input
  -Y <display filter>, --display-filter <display filter>
                           packet filter in Wireshark display filter syntax
  --enable-protocol <proto_name>
                           enable dissection of proto_name
  --disable-protocol <proto_name>
                           disable dissection of proto_name
  --only-protocols <protocols>
                           Only enable dissection of these protocols, comma
                           separated. Disable everything else
  --disable-all-protocols
                           Disable dissection of all protocols
  --enable-heuristic <short_name>
                           enable dissection of heuristic protocol
  --disable-heuristic <short_name>
                           disable dissection of heuristic protocol

Output:
  -l                       flush output after each packet
  -S                       format string for fields
                           (%D - name, %S - stringval, %N numval)
  -t (a|ad|adoy|d|dd|e|r|rc|u|ud|udoy)[.[N]]|.[N]
                           output format of time stamps (def: r: rel. to first)
  -u s|hms                 output format of seconds (def: s: seconds)

Diagnostic output:
  --log-level <level>       sets the active log level ("critical", "warning", etc.)
  --log-fatal <level>       sets level to abort the program ("critical" or "warning")
  --log-fatal-count <count> sets the number of fatal errors before aborting the program
  --log-domains <[!]list>   comma-separated list of the active log domains
  --log-fatal-domains <list>
                            list of domains that cause the program to abort
  --log-debug <[!]list>     list of domains with "debug" level
  --log-noisy <[!]list>     list of domains with "noisy" level
  --log-file <path>         file to output messages to (in addition to stderr)


Miscellaneous:
  -h, --help               display this help and exit
  -v, --version            display version info and exit
  -o <name>:<value> ...    override preference setting
  -K <keytab>              keytab file to use for kerberos decryption
editcap is a general-purpose utility for modifying capture files. Its
main function is to remove packets from capture files, but it can also
be used to convert capture files from one format to another, as well as
to print information about capture files. For more information on
editcap consult your local manual page (man editcap) or
the online version.
Help information available from editcap.
Editcap (Wireshark) 4.7.3 (v4.7.3rc0-27-g31d0fc1bc625)
Edit and/or translate the format of capture files.
See https://www.wireshark.org for more information.

Usage: editcap [options] ... <infile> <outfile> [ <packet#>[-<packet#>] ... ]

<infile> and <outfile> must both be present; use '-' for stdin or stdout.
A single packet or a range of packets can be selected.

Packet selection:
  -r                     keep the selected packets; default is to delete them.
  -A <start time>        only read packets whose timestamp is after (or equal
                         to) the given time.
  -B <stop time>         only read packets whose timestamp is before the
                         given time.
                         Time format for -A/-B/-R options is
                         YYYY-MM-DDThh:mm:ss[.nnnnnnnnn][Z|+-hh:mm]
                         Unix epoch timestamps are also supported.

Duplicate packet removal:
  --novlan               remove vlan info from packets before checking for duplicates.
  -d                     remove packet if duplicate (window == 5).
  -D <dup window>        remove packet if duplicate; configurable <dup window>.
                         Valid <dup window> values are 0 to 1000000.
                         NOTE: A <dup window> of 0 with -V (verbose option) is
                         useful to print MD5 hashes.
  -w <dup time window>   remove packet if duplicate packet is found EQUAL TO OR
                         LESS THAN <dup time window> prior to current packet.
                         A <dup time window> is specified in relative seconds
                         (e.g. 0.000001).
           NOTE: The use of the 'Duplicate packet removal' options with
           other editcap options except -V may not always work as expected.
           Specifically the -r, -t or -S options will very likely NOT have the
           desired effect if combined with the -d, -D or -w.
  --skip-radiotap-header skip radiotap header when checking for packet duplicates.
                         Useful when processing packets captured by multiple radios
                         on the same channel in the vicinity of each other.
  --set-unused           set unused byts to zero in sll link addr.

Packet manipulation:
  -s <snaplen>           truncate each packet to max. <snaplen> bytes of data.
  --sctp-split           split SCTP bundled DATA chunks into individual packets.
  -C [offset:]<choplen>  chop each packet by <choplen> bytes. Positive values
                         chop at the packet beginning, negative values at the
                         packet end. If an optional offset precedes the length,
                         then the bytes chopped will be offset from that value.
                         Positive offsets are from the packet beginning,
                         negative offsets are from the packet end. You can use
                         this option more than once, allowing up to 2 chopping
                         regions within a packet provided that at least 1
                         choplen is positive and at least 1 is negative.
  -L                     adjust the frame (i.e. reported) length when chopping
                         and/or snapping.
  -R <framenum>:<time>   replace the timestamp for given frame number.
                         Accept the same time format as used for -A/-B options.
  -t <time adjustment>   adjust the timestamp of each packet.
                         <time adjustment> is in relative seconds (e.g. -0.5).
  -S <strict adjustment> adjust timestamp of packets if necessary to ensure
                         strict chronological increasing order. The <strict
                         adjustment> is specified in relative seconds with
                         values of 0 or 0.000001 being the most reasonable.
                         A negative adjustment value will modify timestamps so
                         that each packet's delta time is the absolute value
                         of the adjustment specified. A value of -0 will set
                         all packets to the timestamp of the first packet.
  -E <error probability> set the probability (between 0.0 and 1.0 incl.) that
                         a particular packet byte will be randomly changed.
  -o <change offset>     When used in conjunction with -E, skip some bytes from the
                         beginning of the packet. This allows one to preserve some
                         bytes, in order to have some headers untouched.
  --seed <seed>          When used in conjunction with -E, set the seed to use for
                         the pseudo-random number generator. This allows one to
                         repeat a particular sequence of errors.
  -I <bytes to ignore>   ignore the specified number of bytes at the beginning
                         of the frame during MD5 hash calculation, unless the
                         frame is too short, then the full frame is used.
                         Useful to remove duplicated packets taken on
                         several routers (different mac addresses for
                         example).
                         e.g. -I 26 in case of Ether/IP will ignore
                         ether(14) and IP header(20 - 4(src ip) - 4(dst ip)).
  -a <framenum>:<comment> Add or replace packet comment for given frame number.
                         Any pre-existing packet comments from the input file
                         for the specified frame will be replaced unless used
                         in conjunction with "--preserve-packet-comments".
  --discard-packet-comments
                         Discard all pre-existing packet comments from the input
                         file when writing the output file.  Does not discard
                         new comments added by "-a" in the same command line.
  --preserve-packet-comments
                         Preserve from the input file all pre-existing packet
                         comments when adding a new packet comment with "-a".
                         Without this option each "-a" will cause to be
                         discarded any pre-existing comments for the specified
                         frame.

Output File(s):
                         if the output file(s) have the .gz extension, then
                         gzip compression will be used
  -c <packets per file>  split the packet output to different files based on
                         uniform packet counts with a maximum of
                         <packets per file> each.
  -i <seconds per file>  split the packet output to different files based on
                         uniform time intervals with a maximum of
                         <seconds per file> each.
  -F <capture type>      set the output file type; default is pcapng.
                         An empty "-F" option will list the file types.
  -T <encap type>        set the output file encapsulation type; default is the
                         same as the input file. An empty "-T" option will
                         list the encapsulation types.
  --inject-secrets <type>,<file>  Insert decryption secrets from <file>. List
                         supported secret types with "--inject-secrets help".
  --extract-secrets      Extract decryption secrets into the output file instead.
                         Incompatible with other options besides -V.
  --discard-all-secrets  Discard all decryption secrets from the input file
                         when writing the output file.  Does not discard
                         secrets added by "--inject-secrets" in the same
                         command line.
  --discard-name-resolution
                         Discard all name resolution records from the input
                         file when writing the output file.
  --capture-comment <comment>
                         Add a capture file comment, if supported.
  --discard-capture-comment
                         Discard capture file comments from the input file
                         when writing the output file.  Does not discard
                         comments added by "--capture-comment" in the same
                         command line.
  --compress <type>      Compress the output file using the type compression format.

Miscellaneous:
  -h, --help             display this help and exit.
  -V                     verbose output.
                         If -V is used with any of the 'Duplicate Packet
                         Removal' options (-d, -D or -w) then Packet lengths
                         and MD5 hashes are printed to standard-error.
  -v, --version          print version information and exit.
Capture file types available from editcap -F.
editcap: The available capture file types for the "-F" flag are:
    pcap - Wireshark/tcpdump/... - pcap
    pcapng - Wireshark/... - pcapng
    5views - InfoVista 5View capture
    blf - Vector Informatik Binary Logging Format (BLF) logfile
    btsnoop - Symbian OS btsnoop
    commview-ncf - TamoSoft CommView NCF
    commview-ncfx - TamoSoft CommView NCFX
    dct2000 - Catapult DCT2000 trace (.out format)
    erf - Endace ERF capture
    eyesdn - EyeSDN USB S0/E1 ISDN trace format
    k12text - K12 text file
    lanalyzer - Novell LANalyzer
    logcat - Android Logcat Binary format
    logcat-brief - Android Logcat Brief text format
    logcat-long - Android Logcat Long text format
    logcat-process - Android Logcat Process text format
    logcat-tag - Android Logcat Tag text format
    logcat-thread - Android Logcat Thread text format
    logcat-threadtime - Android Logcat Threadtime text format
    logcat-time - Android Logcat Time text format
    modpcap - Modified tcpdump - pcap
    mp2t - MPEG2 transport stream
    netmon1 - Microsoft NetMon 1.x
    netmon2 - Microsoft NetMon 2.x
    nettl - HP-UX nettl trace
    ngsniffer - Sniffer (DOS)
    ngwsniffer_1_1 - NetXray, Sniffer (Windows) 1.1
    ngwsniffer_2_0 - Sniffer (Windows) 2.00x
    nokiapcap - Nokia tcpdump - pcap
    nsecpcap - Wireshark/tcpdump/... - nanosecond pcap
    nstrace10 - NetScaler Trace (Version 1.0)
    nstrace20 - NetScaler Trace (Version 2.0)
    nstrace30 - NetScaler Trace (Version 3.0)
    nstrace35 - NetScaler Trace (Version 3.5)
    observer - Viavi Observer
    rf5 - Tektronix K12xx 32-bit .rf5 format
    rh6_1pcap - RedHat 6.1 tcpdump - pcap
    snoop - Sun snoop
    suse6_3pcap - SuSE 6.3 tcpdump - pcap
    visual - Visual Networks traffic capture
Encapsulation types available from editcap -T.
editcap: The available encapsulation types for the "-T" flag are:
    alp - ATSC Link-Layer Protocol (A/330) packets
    ap1394 - Apple IP-over-IEEE 1394
    arcnet - ARCNET
    arcnet_linux - Linux ARCNET
    ascend - Lucent/Ascend access equipment
    atm-pdus - ATM PDUs
    atm-pdus-untruncated - ATM PDUs - untruncated
    atm-rfc1483 - RFC 1483 ATM
    auerlog - Auerswald Log
    autosardlt - AUTOSAR DLT
    ax25 - Amateur Radio AX.25
    ax25-kiss - AX.25 with KISS header
    bacnet-ms-tp - BACnet MS/TP
    bacnet-ms-tp-with-direction - BACnet MS/TP with Directional Info
    ber - ASN.1 Basic Encoding Rules
    bluetooth-bredr-bb-rf - Bluetooth BR/EDR Baseband RF
    bluetooth-h4 - Bluetooth H4
    bluetooth-h4-linux - Bluetooth H4 with linux header
    bluetooth-hci - Bluetooth without transport layer
    bluetooth-le-ll - Bluetooth Low Energy Link Layer
    bluetooth-le-ll-rf - Bluetooth Low Energy Link Layer RF
    bluetooth-linux-monitor - Bluetooth Linux Monitor
    can20b - Controller Area Network 2.0B
    chdlc - Cisco HDLC
    chdlc-with-direction - Cisco HDLC with Directional Info
    cosine - CoSine L2 debug log
    dbus - D-Bus
    dct2000 - Catapult DCT2000
    dect_nr - DECT-2020 New Radio (NR) MAC layer
    docsis - Data Over Cable Service Interface Specification
    docsis31_xra31 - DOCSIS with Excentis XRA pseudo-header
    dpauxmon - DisplayPort AUX channel with Unigraf pseudo-header
    dpnss_link - Digital Private Signalling System No 1 Link Layer
    dvbci - DVB-CI (Common Interface)
    ebhscr - Elektrobit High Speed Capture and Replay
    ems - EMS (EGNOS Message Server) file
    enc - OpenBSD enc(4) encapsulating interface
    epon - Ethernet Passive Optical Network
    erf - Extensible Record Format
    eri_enb_log - Ericsson eNode-B raw log
    ether - Ethernet
    ether-mpacket - IEEE 802.3br mPackets
    ether-nettl - Ethernet with nettl headers
    etw - Event Tracing for Windows messages
    fc2 - Fibre Channel FC-2
    fc2sof - Fibre Channel FC-2 With Frame Delimiter
    fddi - FDDI
    fddi-nettl - FDDI with nettl headers
    fddi-swapped - FDDI with bit-swapped MAC addresses
    fira-uci - FiRa UWB Controller Interface (UCI) protocol.
    flexray - FlexRay
    frelay - Frame Relay
    frelay-with-direction - Frame Relay with Directional Info
    gcom-serial - GCOM Serial
    gcom-tie1 - GCOM TIE1
    gfp-f - ITU-T G.7041/Y.1303 Generic Framing Procedure Frame-mapped mode
    gfp-t - ITU-T G.7041/Y.1303 Generic Framing Procedure Transparent mode
    gprs-llc - GPRS LLC
    gsm_um - GSM Um Interface
    hhdlc - HiPath HDLC
    i2c-linux - I2C with Linux-specific pseudo-header
    ieee-802-11 - IEEE 802.11 Wireless LAN
    ieee-802-11-avs - IEEE 802.11 plus AVS radio header
    ieee-802-11-netmon - IEEE 802.11 plus Network Monitor radio header
    ieee-802-11-prism - IEEE 802.11 plus Prism II monitor mode radio header
    ieee-802-11-radio - IEEE 802.11 Wireless LAN with radio information
    ieee-802-11-radiotap - IEEE 802.11 plus radiotap radio header
    ieee-802-16-mac-cps - IEEE 802.16 MAC Common Part Sublayer
    infiniband - InfiniBand
    ios - Cisco IOS internal
    ip-ib - IP over IB
    ip-over-fc - RFC 2625 IP-over-Fibre Channel
    ip-over-ib - IP over InfiniBand
    ipfix - RFC 5655/RFC 5101 IPFIX
    ipmb-kontron - Intelligent Platform Management Bus with Kontron pseudo-header
    ipmi-trace - IPMI Trace Data Collection
    ipnet - Solaris IPNET
    irda - IrDA
    isdn - ISDN
    iso14443 - ISO 14443 contactless smartcard standards
    ixveriwave - IxVeriWave header and stats block
    jfif - JPEG/JFIF
    json - JavaScript Object Notation
    juniper-atm1 - Juniper ATM1
    juniper-atm2 - Juniper ATM2
    juniper-chdlc - Juniper C-HDLC
    juniper-ether - Juniper Ethernet
    juniper-frelay - Juniper Frame-Relay
    juniper-ggsn - Juniper GGSN
    juniper-mlfr - Juniper MLFR
    juniper-mlppp - Juniper MLPPP
    juniper-ppp - Juniper PPP
    juniper-pppoe - Juniper PPPoE
    juniper-st - Juniper Secure Tunnel Information
    juniper-svcs - Juniper Services
    juniper-vn - Juniper VN
    juniper-vp - Juniper Voice PIC
    k12 - K12 protocol analyzer
    lapb - LAPB
    lapd - LAPD
    layer1-event - EyeSDN Layer 1 event
    lin - Local Interconnect Network
    linux-atm-clip - Linux ATM CLIP
    linux-lapd - LAPD with Linux pseudo-header
    linux-sll - Linux cooked-mode capture v1
    linux-sll2 - Linux cooked-mode capture v2
    log_3GPP - 3GPP Phone Log
    logcat - Android Logcat Binary format
    logcat_brief - Android Logcat Brief text format
    logcat_long - Android Logcat Long text format
    logcat_process - Android Logcat Process text format
    logcat_tag - Android Logcat Tag text format
    logcat_thread - Android Logcat Thread text format
    logcat_threadtime - Android Logcat Threadtime text format
    logcat_time - Android Logcat Time text format
    loop - OpenBSD loopback
    loratap - LoRaTap
    ltalk - Localtalk
    m_module - Bachmann M-Module file
    mdb - MDB (Multi-Drop Bus)
    message_analyzer_wfp_capture2_v4 - Message Analyzer WFP Capture2 v4
    message_analyzer_wfp_capture2_v6 - Message Analyzer WFP Capture2 v6
    message_analyzer_wfp_capture_auth_v4 - Message Analyzer WFP Capture Auth v4
    message_analyzer_wfp_capture_auth_v6 - Message Analyzer WFP Capture Auth v6
    message_analyzer_wfp_capture_v4 - Message Analyzer WFP Capture v4
    message_analyzer_wfp_capture_v6 - Message Analyzer WFP Capture v6
    mime - MIME
    most - Media Oriented Systems Transport
    mp2ts - ISO/IEC 13818-1 MPEG2-TS
    mp4 - MP4 files
    mpeg - MPEG
    mtp2 - SS7 MTP2
    mtp2-with-phdr - MTP2 with pseudoheader
    mtp3 - SS7 MTP3
    mux27010 - MUX27010
    netanalyzer - Hilscher netANALYZER
    netanalyzer-transparent - Hilscher netANALYZER-Transparent
    netlink - Linux Netlink
    netmon_event - Network Monitor Network Event
    netmon_filter - Network Monitor Filter
    netmon_header - Network Monitor Header
    netmon_network_info - Network Monitor Network Info
    nfc-llcp - NFC LLCP
    nflog - NFLOG
    nordic_ble - nRF Sniffer for Bluetooth LE
    nstrace10 - NetScaler Encapsulation 1.0 of Ethernet
    nstrace20 - NetScaler Encapsulation 2.0 of Ethernet
    nstrace30 - NetScaler Encapsulation 3.0 of Ethernet
    nstrace35 - NetScaler Encapsulation 3.5 of Ethernet
    null - NULL/Loopback
    packetlogger - Apple Bluetooth PacketLogger
    pflog - OpenBSD PF Firewall logs
    pflog-old - OpenBSD PF Firewall logs, pre-3.4
    pktap - Apple PKTAP
    ppi - Per-Packet Information header
    ppp - PPP
    ppp-with-direction - PPP with Directional Info
    pppoes - PPP-over-Ethernet session
    procmon - Microsoft Process Monitor file
    raw-icmp-nettl - Raw ICMP with nettl headers
    raw-icmpv6-nettl - Raw ICMPv6 with nettl headers
    raw-telnet-nettl - Raw telnet with nettl headers
    rawip - Raw IP
    rawip-nettl - Raw IP with nettl headers
    rawip4 - Raw IPv4
    rawip6 - Raw IPv6
    redback - Redback SmartEdge
    rfc7468 - RFC 7468 file
    rtac-serial - RTAC serial-line
    ruby_marshal - Ruby marshal object
    s4607 - STANAG 4607
    s5066-dpdu - STANAG 5066 Data Transfer Sublayer PDUs(D_PDU)
    sccp - SS7 SCCP
    sctp - SCTP
    sdh - SDH
    sdjournal - systemd journal
    sdlc - SDLC
    silabs-dch - Silabs Debug Channel
    sita-wan - SITA WAN packets
    slip - SLIP
    socketcan - SocketCAN
    symantec - Symantec Enterprise Firewall
    tnef - Transport-Neutral Encapsulation Format
    tr - Token Ring
    tr-nettl - Token Ring with nettl headers
    tzsp - Tazmen sniffer protocol
    unknown - Unknown
    unknown-nettl - Unknown link-layer type with nettl headers
    usb-20 - USB 2.0/1.1/1.0 packets
    usb-20-full - Full-Speed USB 2.0/1.1/1.0 packets
    usb-20-high - High-Speed USB 2.0 packets
    usb-20-low - Low-Speed USB 2.0/1.1/1.0 packets
    usb-darwin - USB packets with Darwin (macOS, etc.) headers
    usb-freebsd - USB packets with FreeBSD header
    usb-linux - USB packets with Linux header
    usb-linux-mmap - USB packets with Linux header and padding
    usb-usbpcap - USB packets with USBPcap header
    user0 - USER 0
    user1 - USER 1
    user2 - USER 2
    user3 - USER 3
    user4 - USER 4
    user5 - USER 5
    user6 - USER 6
    user7 - USER 7
    user8 - USER 8
    user9 - USER 9
    user10 - USER 10
    user11 - USER 11
    user12 - USER 12
    user13 - USER 13
    user14 - USER 14
    user15 - USER 15
    v5-ef - V5 Envelope Function
    vpp - Vector Packet Processing graph dispatch trace
    vsock - Linux vsock
    whdlc - Wellfleet HDLC
    wireshark-upper-pdu - Wireshark Upper PDU export
    wpan - IEEE 802.15.4 Wireless PAN
    wpan-nofcs - IEEE 802.15.4 Wireless PAN with FCS not present
    wpan-nonask-phy - IEEE 802.15.4 Wireless PAN non-ASK PHY
    wpan-tap - IEEE 802.15.4 Wireless with TAP pseudo-header
    x2e-serial - X2E serial line capture
    x2e-xoraya - X2E Xoraya
    x25-nettl - X.25 with nettl headers
    xeth - Xerox 3MB Ethernet
    zbncp - ZBOSS NCP
    zwave-serial - Z-Wave Serial API packets
    zwave-tap - Z-Wave Wireless with TAP pseudo-header
Mergecap is a program that combines multiple saved capture files into a single
output file specified by the -w argument. Mergecap can read libpcap
capture files, including those of tcpdump. In addition, Mergecap can read
capture files from snoop (including Shomiti) and atmsnoop, LanAlyzer, Sniffer
(compressed or uncompressed), Microsoft Network Monitor, AIX’s iptrace, NetXray,
Sniffer Pro, RADCOM’s WAN/LAN analyzer, Lucent/Ascend router debug output,
HP-UX’s nettl, and the dump output from Toshiba’s ISDN routers. There is no need
to tell Mergecap what type of file you are reading; it will determine the file
type by itself. Mergecap is also capable of reading any of these file formats if
they are compressed using gzip. Mergecap recognizes this directly from the
file; the “.gz” extension is not required for this purpose.
By default, Mergecap writes all of the packets in the input capture files to a
pcapng file. The -F flag can be used
to specify the capture file’s output format ; it can write the file
in libpcap format (standard libpcap format, a modified format used by some
patched versions of libpcap, the format used by Red Hat Linux 6.1, or the format
used by SuSE Linux 6.3), snoop format, uncompressed Sniffer format, Microsoft
Network Monitor 1.x format, and the format used by Windows-based versions of the
Sniffer software.
Packets from the input files are merged in chronological order based on each
frame’s timestamp, unless the -a flag is specified. Mergecap assumes that
frames within a single capture file are already stored in chronological order.
When the -a flag is specified, packets are copied directly from each input
file to the output file, independent of each frame’s timestamp.
If the -s flag is used to specify a snapshot length, frames in the input file
with more captured data than the specified snapshot length will have only the
amount of data specified by the snapshot length written to the output file. This
may be useful if the program that is to read the output file cannot handle
packets larger than a certain size (for example, the versions of snoop in
Solaris 2.5.1 and Solaris 2.6 appear to reject Ethernet frames larger than the
standard Ethernet MTU, making them incapable of handling gigabit Ethernet
captures if jumbo frames were used).
If the -T flag is used to specify an encapsulation type, the encapsulation
type of the output capture file will be forced to the specified type, rather
than being the type appropriate to the encapsulation type of the input capture
file. Note that this merely forces the encapsulation type of the output file to
be the specified type; the packet headers of the packets will not be translated
from the encapsulation type of the input capture file to the specified
encapsulation type (for example, it will not translate an Ethernet capture to an
FDDI capture if an Ethernet capture is read and -T fddi is specified).
For more information on mergecap consult your local manual page (man
mergecap) or the online
version.
Help information available from mergecap.
Mergecap (Wireshark) 4.7.3 (v4.7.3rc0-27-g31d0fc1bc625)
Merge two or more capture files into one.
See https://www.wireshark.org for more information.

Usage: mergecap [options] -w <outfile>|- <infile> [<infile> ...]

Output:
  -a                concatenate rather than merge files.
                    default is to merge based on frame timestamps.
  -s <snaplen>      truncate packets to <snaplen> bytes of data.
  -w <outfile>|-    set the output filename to <outfile> or '-' for stdout.
                    if the output filename has the .gz extension, it will be compressed to a gzip archive
  -F <capture type> set the output file type; default is pcapng.
                    an empty "-F" option will list the file types.
  -I <IDB merge mode> set the merge mode for Interface Description Blocks; default is 'all'.
                    an empty "-I" option will list the merge modes.
  --compress <type> compress the output file using the type compression format.
  --no-merging-comment
                    do not add "File created by merging:" comment.

Miscellaneous:
  -h, --help        display this help and exit.
  -V                verbose output.
  -v, --version     print version information and exit.
A simple example merging dhcp-capture.pcapng and imap-1.pcapng into
outfile.pcapng is shown below.
Simple example of using mergecap.
$ mergecap -w outfile.pcapng dhcp-capture.pcapng imap-1.pcapng
There may be some occasions when you wish to convert a hex dump of some network traffic into a capture file.
text2pcap is a program that reads in an ASCII hex dump and writes the data
described into any capture file format supported by libwiretap. text2pcap can
read hexdumps with multiple packets in them, and build a capture file of
multiple packets.
text2pcap is also capable of generating dummy Ethernet, IP, UDP, TCP or SCTP
headers, in order to build fully processable packet dumps from hexdumps of
application-level data only.
text2pcap understands a hexdump of the form generated by od -A x -t x1. In
other words, each byte is individually displayed and surrounded with a space.
Each line begins with an offset describing the position in the packet, each new
packet starts with an offset of 0 and there is a space separating the offset
from the following bytes. The offset
is a hex number (can also be octal - see -o), of more than two hex digits. Here
is a sample dump that text2pcap can recognize:
000000 00 e0 1e a7 05 6f 00 10 ........
000008 5a a0 b9 12 08 00 46 00 ........
000010 03 68 00 00 00 00 0a 2e ........
000018 ee 33 0f 19 08 7f 0f 19 ........
000020 03 80 94 04 00 00 10 01 ........
000028 16 a2 0a 00 03 50 00 0c ........
000030 01 01 0f 19 03 80 11 01 ........
There is no limit on the width or number of bytes per line. Also the text dump
at the end of the line is ignored. Bytes/hex numbers can be uppercase or
lowercase. Any text before the offset is ignored, including email forwarding
characters “>”. Any lines of text between the bytestring lines is ignored.
The offsets are used to track the bytes, so offsets must be correct. Any line
which has only bytes without a leading offset is ignored. An offset is
recognized as being a hex number longer than two characters. Any text after the
bytes is ignored (e.g., the character dump). Any hex numbers in this text are
also ignored. An offset of zero is indicative of starting a new packet, so a
single text file with a series of hexdumps can be converted into a packet
capture with multiple packets. Packets may be preceded by a timestamp. These
are interpreted according to the format given on the command line. If not, the
first packet is timestamped with the current time the conversion takes place.
Multiple packets are written with timestamps differing by one microsecond each.
In general, short of these restrictions, text2pcap
is pretty liberal about reading in hexdumps and has been tested with a variety
of mangled outputs (including being forwarded through email multiple times, with
limited line wrap etc.)
There are a couple of other special features to note. Any line where the first
non-whitespace character is “#” will be ignored as a comment. Any line beginning
with #TEXT2PCAP is a directive and options can be inserted after this command to
be processed by text2pcap. Currently there are no directives implemented; in the
future, these may be used to give more fine-grained control on the dump and the
way it should be processed e.g., timestamps, encapsulation type etc.
text2pcap also allows the user to read in dumps of application-level data, by
inserting dummy L2, L3 and L4 headers before each packet. Possibilities include
inserting headers such as Ethernet, Ethernet + IP, Ethernet + IP + UDP, or TCP,
or SCTP before each packet. This allows Wireshark or any other full-packet
decoder to handle these dumps.
For more information on text2pcap consult your local manual page (man
text2pcap) or the online
version.
Help information available from text2pcap.
Text2pcap (Wireshark) 4.7.3 (v4.7.3rc0-27-g31d0fc1bc625)
Generate a capture file from an ASCII hexdump of packets.
See https://www.wireshark.org for more information.

Usage: text2pcap [options] <infile> <outfile>

where  <infile> specifies input  filename (use - for standard input)
      <outfile> specifies output filename (use - for standard output)

Input:
  -o hex|oct|dec|none    parse offsets as (h)ex, (o)ctal, (d)ecimal, or (n)one;
                         default is hex.
  -t <timefmt>           treat the text before the packet as a date/time code;
                         <timefmt> is a format string supported by strptime,
                         with an optional %f descriptor for fractional seconds.
                         Example: The time "10:15:14.5476" has the format code
                         "%H:%M:%S.%f"
                         The special format string ISO supports ISO-8601 times.
                         NOTE: Date/time fields from the current date/time are
                         used as the default for unspecified fields.
  -D                     the text before the packet starts with an I or an O,
                         indicating that the packet is inbound or outbound.
                         This is used when generating dummy headers if the
                         output format supports it (e.g. pcapng).
  -a                     enable ASCII text dump identification.
                         The start of the ASCII text dump can be identified
                         and excluded from the packet data, even if it looks
                         like a HEX dump.
                         NOTE: Do not enable it if the input file does not
                         contain the ASCII text dump.
  -r <regex>             enable regex mode. Scan the input using <regex>, a Perl
                         compatible regular expression matching a single packet.
                         Named capturing subgroups are used to identify fields:
                         <data> (mand.), and <time>, <dir>, and <seqno> (opt.)
                         The time field format is taken from the -t option
                         Example: -r '^(?<dir>[<>])\s(?<time>\d+:\d\d:\d\d.\d+)\s(?<data>[0-9a-fA-F]+)$'
                         could match a file with lines like
                         > 0:00:00.265620 a130368b000000080060
                         < 0:00:00.295459 a2010800000000000000000800000000
  -b 2|8|16|64           encoding base (radix) of the packet data in regex mode
                         (def: 16: hexadecimal) No effect in hexdump mode.

Output:
                         if the output file(s) have the .gz extension, then
                         gzip compression will be used.
  -F <capture type>      set the output file type; default is pcapng.
                         an empty "-F" option will list the file types.
  -E <encap type>        set the output file encapsulation type; default is
                         ether (Ethernet). An empty "-E" option will list
                         the encapsulation types.
  -l <typenum>           set the output file encapsulation type via link-layer
                         type number; default is 1 (Ethernet). See
                         https://www.tcpdump.org/linktypes.html for a list of
                         numbers.
                         Example: -l 7 for ARCNet packets.
  -m <max-packet>        max packet length in output; default is 262144
  -N <intf-name>         assign name to the interface in the pcapng file.
  --compress <type>      Compress the output file using the type compression format.

Prepend dummy header:
  -e <ethertype>         prepend dummy Ethernet II header with specified EtherType
                         (in HEX).
                         Example: -e 0x806 to specify an ARP packet.
  -i <proto>             prepend dummy IP header with specified IP protocol
                         (in DECIMAL).
                         Automatically prepends Ethernet header as well if
                         link-layer type is Ethernet.
                         Example: -i 46
  -4 <srcip>,<destip>    prepend dummy IPv4 header with specified
                         source and destination addresses.
                         Example: -4 10.0.0.1,10.0.0.2
  -6 <srcip>,<destip>    prepend dummy IPv6 header with specified
                         source and destination addresses.
                         Example: -6 2001:db8::b3ff:fe1e:8329,2001:0db8:85a3::8a2e:0370:7334
  -u <srcp>,<destp>      prepend dummy UDP header with specified
                         source and destination ports (in DECIMAL).
                         Automatically prepends Ethernet & IP headers as well.
                         Example: -u 1000,69 to make the packets look like
                         TFTP/UDP packets.
  -T <srcp>,<destp>      prepend dummy TCP header with specified
                         source and destination ports (in DECIMAL).
                         Automatically prepends Ethernet & IP headers as well.
                         Example: -T 50,60
  -s <srcp>,<dstp>,<tag> prepend dummy SCTP header with specified
                         source/destination ports and verification tag (in DECIMAL).
                         Automatically prepends Ethernet & IP headers as well.
                         Example: -s 30,40,34
  -S <srcp>,<dstp>,<ppi> prepend dummy SCTP header with specified
                         source/destination ports and verification tag 0.
                         Automatically prepends a dummy SCTP DATA
                         chunk header with payload protocol identifier ppi.
                         Example: -S 30,40,34
  -P <dissector>         prepend EXPORTED_PDU header with specified dissector
                         as the payload DISSECTOR_NAME tag.
                         Automatically sets link type to Upper PDU Export.
                         EXPORTED_PDU payload defaults to "data" otherwise.

Diagnostic output:
  --log-level <level>       sets the active log level ("critical", "warning", etc.)
  --log-fatal <level>       sets level to abort the program ("critical" or "warning")
  --log-fatal-count <count> sets the number of fatal errors before aborting the program
  --log-domains <[!]list>   comma-separated list of the active log domains
  --log-fatal-domains <list>
                            list of domains that cause the program to abort
  --log-debug <[!]list>     list of domains with "debug" level
  --log-noisy <[!]list>     list of domains with "noisy" level
  --log-file <path>         file to output messages to (in addition to stderr)

Miscellaneous:
  -h, --help             display this help and exit
  -v, --version          print version information and exit
  -q                     don't report processed packet counts
reordercap lets you reorder a capture file according to the packets
timestamp. For more information on reordercap consult your local
manual page (man reordercap) or
the online version.
Help information available from reordercap.
Reordercap (Wireshark) 4.7.3 (v4.7.3rc0-27-g31d0fc1bc625)
Reorder timestamps of input file frames into output file.
See https://www.wireshark.org for more information.

Usage: reordercap [options] <infile> <outfile>

Options:
  -n                don't write to output file if the input file is ordered.
  -h, --help        display this help and exit.
  -v, --version     print version information and exit.
mmdbresolve reads IPv4 and IPv6 addresses on stdin and prints their IP geolocation
information on stdout. For more information on mmdbresolve consult your local
manual page (man mmdbresolve) or
the online version.
Help information available from mmdbresolve.
mmdbresolve (Wireshark) 4.7.3 (v4.7.3rc0-27-g31d0fc1bc625)
Read IPv4 and IPv6 addresses on stdin and print their IP geolocation information on stdout.
See https://www.wireshark.org for more information.

Usage: mmdbresolve [-v|-h] -f <dbfile> [-f <dbfile>] ...

Options:
  -v: display version info and exit
  -h: display this help and exit
  -f: path to a MaxMind Database file
As with the original license and documentation distributed with Wireshark, this document is covered by the GNU General Public License (GNU GPL).
If you haven’t read the GPL before, please do so. It explains all the things that you are allowed to do with this code and documentation.
		    GNU GENERAL PUBLIC LICENSE
		       Version 2, June 1991

 Copyright (C) 1989, 1991 Free Software Foundation, Inc.
 <https://fsf.org/>
 Everyone is permitted to copy and distribute verbatim copies
 of this license document, but changing it is not allowed.

			    Preamble

  The licenses for most software are designed to take away your
freedom to share and change it.  By contrast, the GNU General Public
License is intended to guarantee your freedom to share and change free
software--to make sure the software is free for all its users.  This
General Public License applies to most of the Free Software
Foundation's software and to any other program whose authors commit to
using it.  (Some other Free Software Foundation software is covered by
the GNU Library General Public License instead.)  You can apply it to
your programs, too.

  When we speak of free software, we are referring to freedom, not
price.  Our General Public Licenses are designed to make sure that you
have the freedom to distribute copies of free software (and charge for
this service if you wish), that you receive source code or can get it
if you want it, that you can change the software or use pieces of it
in new free programs; and that you know you can do these things.

  To protect your rights, we need to make restrictions that forbid
anyone to deny you these rights or to ask you to surrender the rights.
These restrictions translate to certain responsibilities for you if you
distribute copies of the software, or if you modify it.

  For example, if you distribute copies of such a program, whether
gratis or for a fee, you must give the recipients all the rights that
you have.  You must make sure that they, too, receive or can get the
source code.  And you must show them these terms so they know their
rights.

  We protect your rights with two steps: (1) copyright the software, and
(2) offer you this license which gives you legal permission to copy,
distribute and/or modify the software.

  Also, for each author's protection and ours, we want to make certain
that everyone understands that there is no warranty for this free
software.  If the software is modified by someone else and passed on, we
want its recipients to know that what they have is not the original, so
that any problems introduced by others will not reflect on the original
authors' reputations.

  Finally, any free program is threatened constantly by software
patents.  We wish to avoid the danger that redistributors of a free
program will individually obtain patent licenses, in effect making the
program proprietary.  To prevent this, we have made it clear that any
patent must be licensed for everyone's free use or not licensed at all.

  The precise terms and conditions for copying, distribution and
modification follow.

		    GNU GENERAL PUBLIC LICENSE
   TERMS AND CONDITIONS FOR COPYING, DISTRIBUTION AND MODIFICATION

  0. This License applies to any program or other work which contains
a notice placed by the copyright holder saying it may be distributed
under the terms of this General Public License.  The "Program", below,
refers to any such program or work, and a "work based on the Program"
means either the Program or any derivative work under copyright law:
that is to say, a work containing the Program or a portion of it,
either verbatim or with modifications and/or translated into another
language.  (Hereinafter, translation is included without limitation in
the term "modification".)  Each licensee is addressed as "you".

Activities other than copying, distribution and modification are not
covered by this License; they are outside its scope.  The act of
running the Program is not restricted, and the output from the Program
is covered only if its contents constitute a work based on the
Program (independent of having been made by running the Program).
Whether that is true depends on what the Program does.

  1. You may copy and distribute verbatim copies of the Program's
source code as you receive it, in any medium, provided that you
conspicuously and appropriately publish on each copy an appropriate
copyright notice and disclaimer of warranty; keep intact all the
notices that refer to this License and to the absence of any warranty;
and give any other recipients of the Program a copy of this License
along with the Program.

You may charge a fee for the physical act of transferring a copy, and
you may at your option offer warranty protection in exchange for a fee.

  2. You may modify your copy or copies of the Program or any portion
of it, thus forming a work based on the Program, and copy and
distribute such modifications or work under the terms of Section 1
above, provided that you also meet all of these conditions:

    a) You must cause the modified files to carry prominent notices
    stating that you changed the files and the date of any change.

    b) You must cause any work that you distribute or publish, that in
    whole or in part contains or is derived from the Program or any
    part thereof, to be licensed as a whole at no charge to all third
    parties under the terms of this License.

    c) If the modified program normally reads commands interactively
    when run, you must cause it, when started running for such
    interactive use in the most ordinary way, to print or display an
    announcement including an appropriate copyright notice and a
    notice that there is no warranty (or else, saying that you provide
    a warranty) and that users may redistribute the program under
    these conditions, and telling the user how to view a copy of this
    License.  (Exception: if the Program itself is interactive but
    does not normally print such an announcement, your work based on
    the Program is not required to print an announcement.)

These requirements apply to the modified work as a whole.  If
identifiable sections of that work are not derived from the Program,
and can be reasonably considered independent and separate works in
themselves, then this License, and its terms, do not apply to those
sections when you distribute them as separate works.  But when you
distribute the same sections as part of a whole which is a work based
on the Program, the distribution of the whole must be on the terms of
this License, whose permissions for other licensees extend to the
entire whole, and thus to each and every part regardless of who wrote it.

Thus, it is not the intent of this section to claim rights or contest
your rights to work written entirely by you; rather, the intent is to
exercise the right to control the distribution of derivative or
collective works based on the Program.

In addition, mere aggregation of another work not based on the Program
with the Program (or with a work based on the Program) on a volume of
a storage or distribution medium does not bring the other work under
the scope of this License.

  3. You may copy and distribute the Program (or a work based on it,
under Section 2) in object code or executable form under the terms of
Sections 1 and 2 above provided that you also do one of the following:

    a) Accompany it with the complete corresponding machine-readable
    source code, which must be distributed under the terms of Sections
    1 and 2 above on a medium customarily used for software interchange; or,

    b) Accompany it with a written offer, valid for at least three
    years, to give any third party, for a charge no more than your
    cost of physically performing source distribution, a complete
    machine-readable copy of the corresponding source code, to be
    distributed under the terms of Sections 1 and 2 above on a medium
    customarily used for software interchange; or,

    c) Accompany it with the information you received as to the offer
    to distribute corresponding source code.  (This alternative is
    allowed only for noncommercial distribution and only if you
    received the program in object code or executable form with such
    an offer, in accord with Subsection b above.)

The source code for a work means the preferred form of the work for
making modifications to it.  For an executable work, complete source
code means all the source code for all modules it contains, plus any
associated interface definition files, plus the scripts used to
control compilation and installation of the executable.  However, as a
special exception, the source code distributed need not include
anything that is normally distributed (in either source or binary
form) with the major components (compiler, kernel, and so on) of the
operating system on which the executable runs, unless that component
itself accompanies the executable.

If distribution of executable or object code is made by offering
access to copy from a designated place, then offering equivalent
access to copy the source code from the same place counts as
distribution of the source code, even though third parties are not
compelled to copy the source along with the object code.

  4. You may not copy, modify, sublicense, or distribute the Program
except as expressly provided under this License.  Any attempt
otherwise to copy, modify, sublicense or distribute the Program is
void, and will automatically terminate your rights under this License.
However, parties who have received copies, or rights, from you under
this License will not have their licenses terminated so long as such
parties remain in full compliance.

  5. You are not required to accept this License, since you have not
signed it.  However, nothing else grants you permission to modify or
distribute the Program or its derivative works.  These actions are
prohibited by law if you do not accept this License.  Therefore, by
modifying or distributing the Program (or any work based on the
Program), you indicate your acceptance of this License to do so, and
all its terms and conditions for copying, distributing or modifying
the Program or works based on it.

  6. Each time you redistribute the Program (or any work based on the
Program), the recipient automatically receives a license from the
original licensor to copy, distribute or modify the Program subject to
these terms and conditions.  You may not impose any further
restrictions on the recipients' exercise of the rights granted herein.
You are not responsible for enforcing compliance by third parties to
this License.

  7. If, as a consequence of a court judgment or allegation of patent
infringement or for any other reason (not limited to patent issues),
conditions are imposed on you (whether by court order, agreement or
otherwise) that contradict the conditions of this License, they do not
excuse you from the conditions of this License.  If you cannot
distribute so as to satisfy simultaneously your obligations under this
License and any other pertinent obligations, then as a consequence you
may not distribute the Program at all.  For example, if a patent
license would not permit royalty-free redistribution of the Program by
all those who receive copies directly or indirectly through you, then
the only way you could satisfy both it and this License would be to
refrain entirely from distribution of the Program.

If any portion of this section is held invalid or unenforceable under
any particular circumstance, the balance of the section is intended to
apply and the section as a whole is intended to apply in other
circumstances.

It is not the purpose of this section to induce you to infringe any
patents or other property right claims or to contest validity of any
such claims; this section has the sole purpose of protecting the
integrity of the free software distribution system, which is
implemented by public license practices.  Many people have made
generous contributions to the wide range of software distributed
through that system in reliance on consistent application of that
system; it is up to the author/donor to decide if he or she is willing
to distribute software through any other system and a licensee cannot
impose that choice.

This section is intended to make thoroughly clear what is believed to
be a consequence of the rest of this License.

  8. If the distribution and/or use of the Program is restricted in
certain countries either by patents or by copyrighted interfaces, the
original copyright holder who places the Program under this License
may add an explicit geographical distribution limitation excluding
those countries, so that distribution is permitted only in or among
countries not thus excluded.  In such case, this License incorporates
the limitation as if written in the body of this License.

  9. The Free Software Foundation may publish revised and/or new versions
of the General Public License from time to time.  Such new versions will
be similar in spirit to the present version, but may differ in detail to
address new problems or concerns.

Each version is given a distinguishing version number.  If the Program
specifies a version number of this License which applies to it and "any
later version", you have the option of following the terms and conditions
either of that version or of any later version published by the Free
Software Foundation.  If the Program does not specify a version number of
this License, you may choose any version ever published by the Free Software
Foundation.

  10. If you wish to incorporate parts of the Program into other free
programs whose distribution conditions are different, write to the author
to ask for permission.  For software which is copyrighted by the Free
Software Foundation, write to the Free Software Foundation; we sometimes
make exceptions for this.  Our decision will be guided by the two goals
of preserving the free status of all derivatives of our free software and
of promoting the sharing and reuse of software generally.

			    NO WARRANTY

  11. BECAUSE THE PROGRAM IS LICENSED FREE OF CHARGE, THERE IS NO WARRANTY
FOR THE PROGRAM, TO THE EXTENT PERMITTED BY APPLICABLE LAW.  EXCEPT WHEN
OTHERWISE STATED IN WRITING THE COPYRIGHT HOLDERS AND/OR OTHER PARTIES
PROVIDE THE PROGRAM "AS IS" WITHOUT WARRANTY OF ANY KIND, EITHER EXPRESSED
OR IMPLIED, INCLUDING, BUT NOT LIMITED TO, THE IMPLIED WARRANTIES OF
MERCHANTABILITY AND FITNESS FOR A PARTICULAR PURPOSE.  THE ENTIRE RISK AS
TO THE QUALITY AND PERFORMANCE OF THE PROGRAM IS WITH YOU.  SHOULD THE
PROGRAM PROVE DEFECTIVE, YOU ASSUME THE COST OF ALL NECESSARY SERVICING,
REPAIR OR CORRECTION.

  12. IN NO EVENT UNLESS REQUIRED BY APPLICABLE LAW OR AGREED TO IN WRITING
WILL ANY COPYRIGHT HOLDER, OR ANY OTHER PARTY WHO MAY MODIFY AND/OR
REDISTRIBUTE THE PROGRAM AS PERMITTED ABOVE, BE LIABLE TO YOU FOR DAMAGES,
INCLUDING ANY GENERAL, SPECIAL, INCIDENTAL OR CONSEQUENTIAL DAMAGES ARISING
OUT OF THE USE OR INABILITY TO USE THE PROGRAM (INCLUDING BUT NOT LIMITED
TO LOSS OF DATA OR DATA BEING RENDERED INACCURATE OR LOSSES SUSTAINED BY
YOU OR THIRD PARTIES OR A FAILURE OF THE PROGRAM TO OPERATE WITH ANY OTHER
PROGRAMS), EVEN IF SUCH HOLDER OR OTHER PARTY HAS BEEN ADVISED OF THE
POSSIBILITY OF SUCH DAMAGES.

		     END OF TERMS AND CONDITIONS

	    How to Apply These Terms to Your New Programs

  If you develop a new program, and you want it to be of the greatest
possible use to the public, the best way to achieve this is to make it
free software which everyone can redistribute and change under these terms.

  To do so, attach the following notices to the program.  It is safest
to attach them to the start of each source file to most effectively
convey the exclusion of warranty; and each file should have at least
the "copyright" line and a pointer to where the full notice is found.

    <one line to give the program's name and a brief idea of what it does.>
    Copyright (C) <year>  <name of author>

    This program is free software; you can redistribute it and/or modify
    it under the terms of the GNU General Public License as published by
    the Free Software Foundation; either version 2 of the License, or
    (at your option) any later version.

    This program is distributed in the hope that it will be useful,
    but WITHOUT ANY WARRANTY; without even the implied warranty of
    MERCHANTABILITY or FITNESS FOR A PARTICULAR PURPOSE.  See the
    GNU General Public License for more details.

    You should have received a copy of the GNU General Public License
    along with this program; if not, see <https://www.gnu.org/licenses/>.


Also add information on how to contact you by electronic and paper mail.

If the program is interactive, make it output a short notice like this
when it starts in an interactive mode:

    Gnomovision version 69, Copyright (C) year  name of author
    Gnomovision comes with ABSOLUTELY NO WARRANTY; for details type `show w'.
    This is free software, and you are welcome to redistribute it
    under certain conditions; type `show c' for details.

The hypothetical commands `show w' and `show c' should show the appropriate
parts of the General Public License.  Of course, the commands you use may
be called something other than `show w' and `show c'; they could even be
mouse-clicks or menu items--whatever suits your program.

You should also get your employer (if you work as a programmer) or your
school, if any, to sign a "copyright disclaimer" for the program, if
necessary.  Here is a sample; alter the names:

  Yoyodyne, Inc., hereby disclaims all copyright interest in the program
  `Gnomovision' (which makes passes at compilers) written by James Hacker.

  <signature of Moe Ghoul>, 1 April 1989
  Moe Ghoul, President of Vice

This General Public License does not permit incorporating your program into
proprietary programs.  If your program is a subroutine library, you may
consider it more useful to permit linking proprietary applications with the
library.  If this is what you want to do, use the GNU Library General
Public License instead of this License.