Statistics of the captured LTE or NR MAC traffic. This window will summarize the MAC traffic found in the capture.
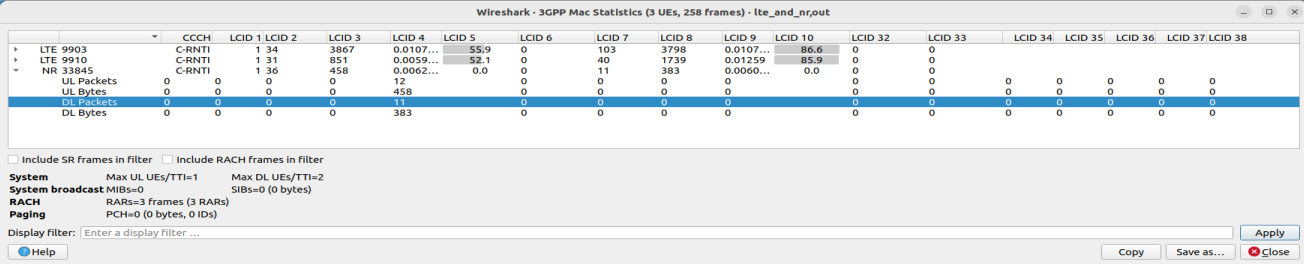
Each row in the top pane shows statistical highlights for exactly one UE/C-RNTI. Opening a UE item shows details of each logical channel identifier of that UE.
The bottom pane shows statistics for common channels, and controls to apply more detailed display filters to the packet list.
The RLC Graph menu launches a graph which shows LTE/NR Radio Link Control protocol sequence numbers changing over time along with (for AM) acknowledgements received in the opposite direction.
![[Note]](images/note.svg) | Note |
|---|---|
|
That graph shows data of a single bearer and direction. This graph may also be launched from the “RLC Statistics” window. |
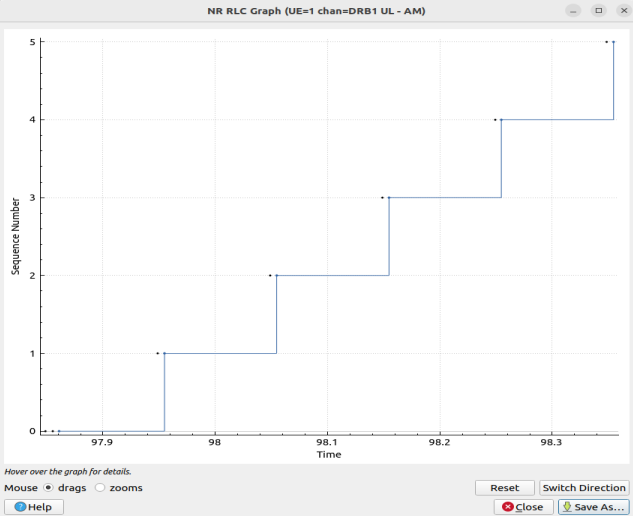
The image of the RLC Graph is borrowed from the Wireshark wiki.
Statistics of the captured LTE/NR RLC traffic. This window will summarize the RLC traffic found in the capture.
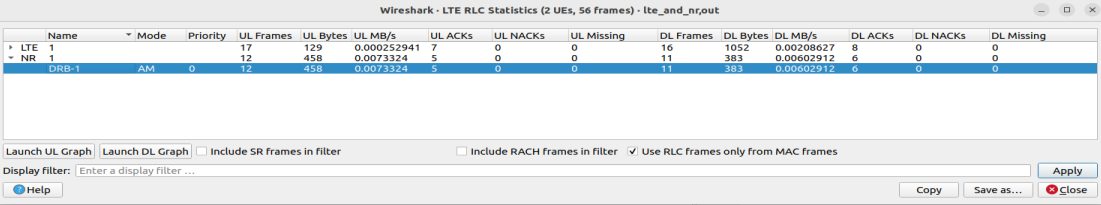
A check-box controls whether this window should include RLC PDUs logged within MAC PDUs or not. This will affect both the PDUs counted as well as the display filters generated (see below).
The upper list shows summaries of each active UE. Opening up a UE entry will show the same information broken down by individual bearers.
The lower part of the windows allows display filters to be generated and set for the selected bearer/channel. Note that in the case of Acknowledged Mode channels, if a single direction is chosen, the generated filter will show data in that direction and control PDUs in the opposite direction.