Table of Contents
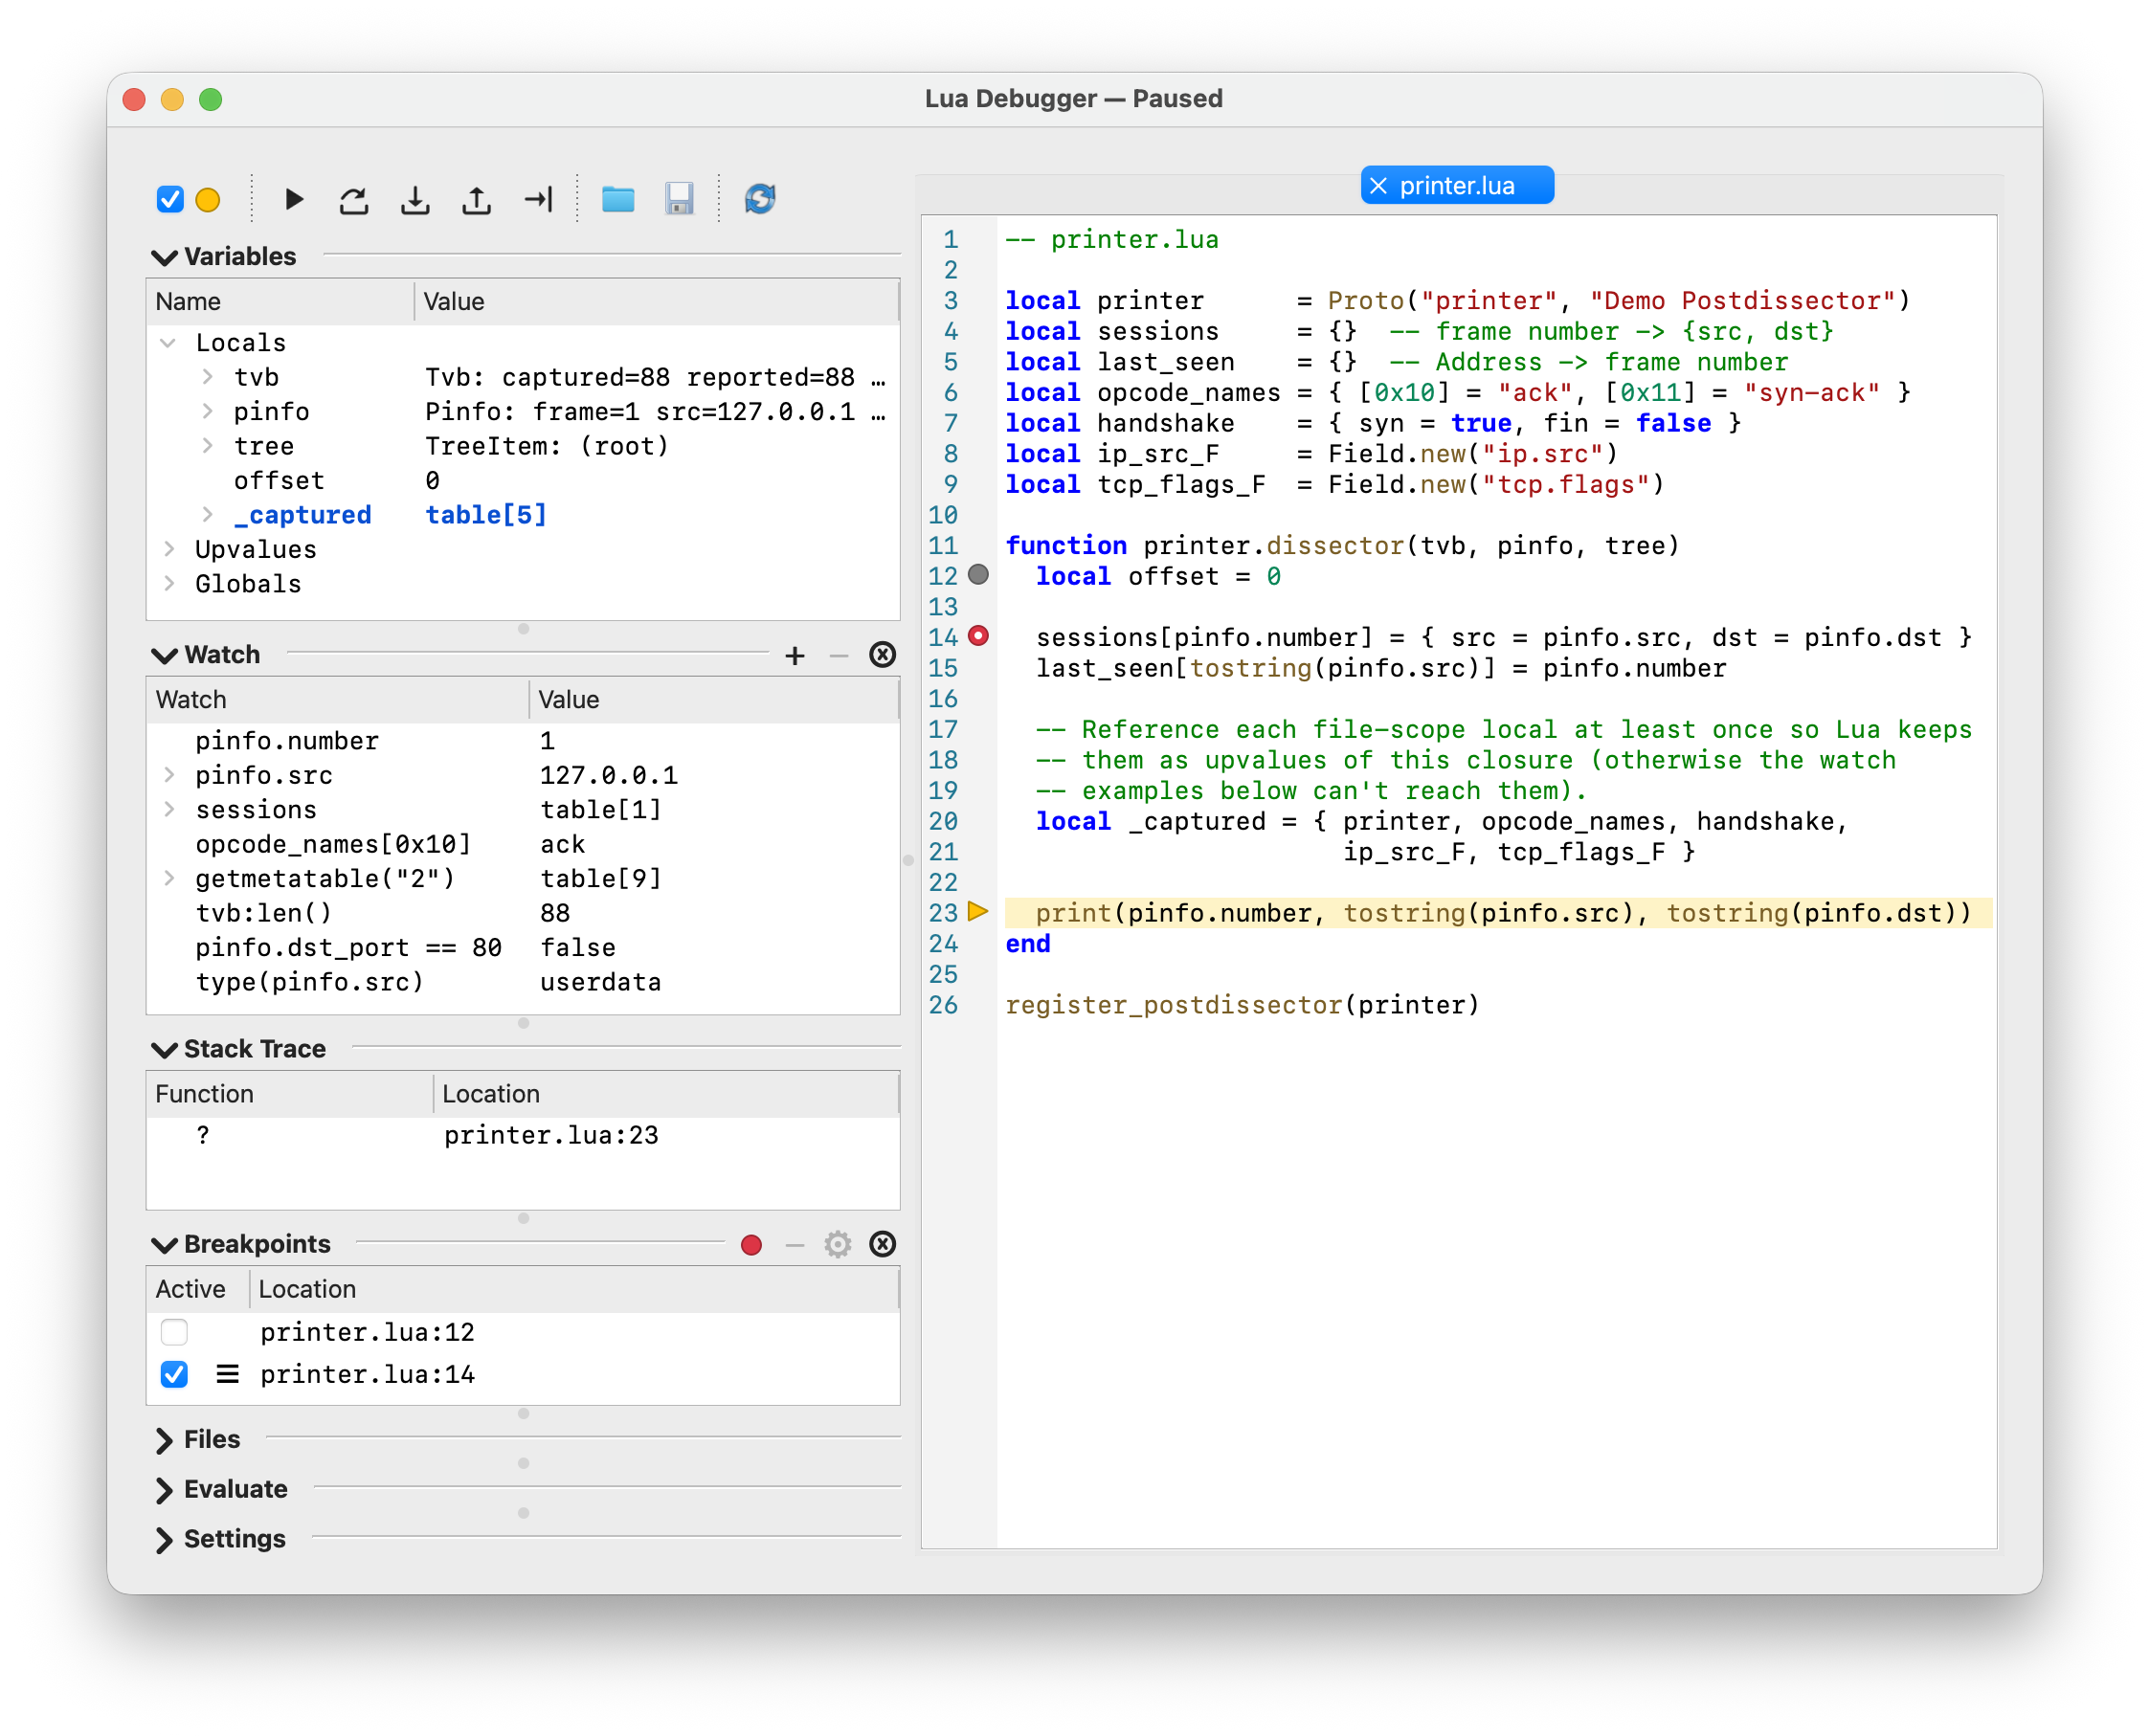
Wireshark ships with a comprehensive built-in graphical debugger for Lua scripts (dissectors, postdissectors, taps, and file readers/writers), with breakpoints, stepping, call-stack and variable inspection, watches, and expression evaluation. It is a sub-window of the main application, reached from → . There is only ever one debugger dialog; closing it does not lose any state, and reopening it from the menu brings back the same breakpoints, watches, and editor tabs.
The debugger lets you:
- set breakpoints — optionally with a condition, hit-count gate, or logpoint message — on any line of a loaded Lua script, or any file you open in its editor;
- step through Lua code line by line (step over, step into, step out, and run-to-line);
- inspect the current call stack, local variables, upvalues, and globals while paused, with the rest of Wireshark frozen;
- set watches — both Variables-style paths and arbitrary Lua expressions — that re-evaluate on every pause;
- evaluate ad-hoc Lua expressions against the paused state;
- edit script files in place, with syntax highlighting, a breakpoint gutter, inline find, and go-to-line;
The top of the dialog has an Enabled checkbox; its icon is a small colored circle that mirrors the debugger’s current state, and the debugger’s state is also appended to the window title (for example Lua Debugger — Paused). The debugger has four states:
- Disabled (gray) — the line hook is not installed; scripts run at full speed and breakpoints do not fire.
- Running (green) — the line hook is installed; scripts run until a breakpoint (or step target) hits.
- Paused (yellow) — a breakpoint, single step, or run-to-line pointed at a line inside a loaded script and the debugger has stopped Lua execution.
- Disabled (live capture) (red) — debugging is forcibly suppressed for the duration of a live capture and is restored to the previous enabled state when the capture ends. The Enabled checkbox is disabled in this state and its tooltip explains why; see Section 14.2.1, “Live-capture suppression”.
Watches, breakpoints, the editor theme, and section layout are remembered across Wireshark restarts.