There are a large number of preferences you can set. Simply select the → ( → on macOS) and Wireshark will pop up the Preferences dialog box as shown in Figure 11.6, “The preferences dialog box”, with the “Appearance” page as default. On the left side is a tree where you can select the page to be shown.
- The button will apply the preferences settings and close the dialog.
- The button will restore all preferences settings to the last saved state.
These preferences give you the option to control the makeup of the GUI.
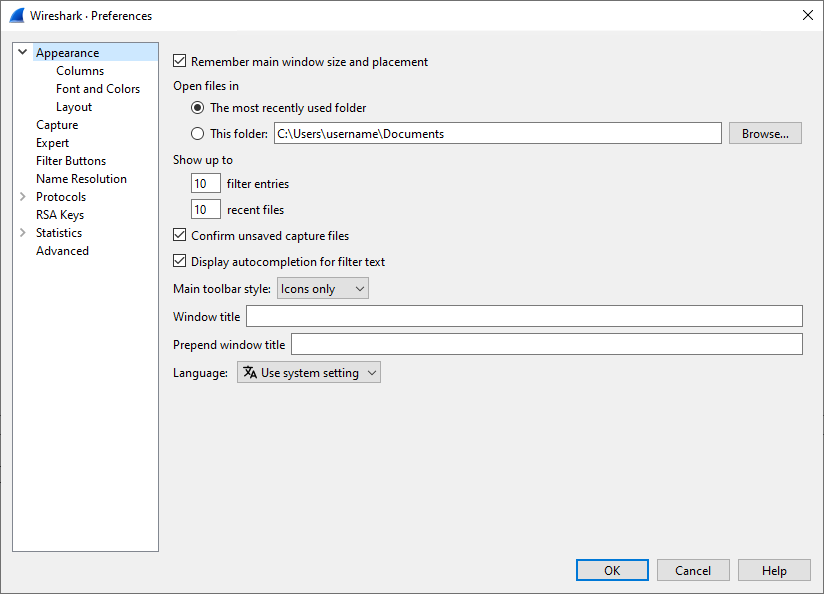
Selecting Remember main window size and placement allow for a repeatable experience when restarting Wireshark.
Selecting Open files in allows you to determine where to start the file selection dialog when opening capture files.
The preference Show up to allows you to determine how much history is tracked for display filter entries and recent files shown in the main application window.
Selecting Confirm unsaved capture files causes a dialog to appear when closing a capture file when it was not yet saved. This may help preventing inadvertent loss of data, eg., when Wireshark is closed.
Selecting Display autocompletion for filter text causes a drop down list to appear when you enter a display filter. This drop down list contains known display filters for easy selection.
The preference Main toolbar style allows you to tailor the toolbar style in one of three ways.
The Wireshark main window title is replaced by the name of the opened capture file. The preferences Window title and Prepend window title allow you to add bracketed strings after and before the window title. These window title strings can contain variables which will be replaced by their respective values.
The following variables are available.
- %C = Capture comment from command line
- %F = File path of the capture file
- %P = Currently selected profile name
- %S = Conditional separator (dash) that only shows when surrounded by variables with values or static text
- %V = Wireshark version info
The Language preference allows you to select the language used in the GUI. Note that the protocol information and details are kept in the language commonly used in this field, that being English.
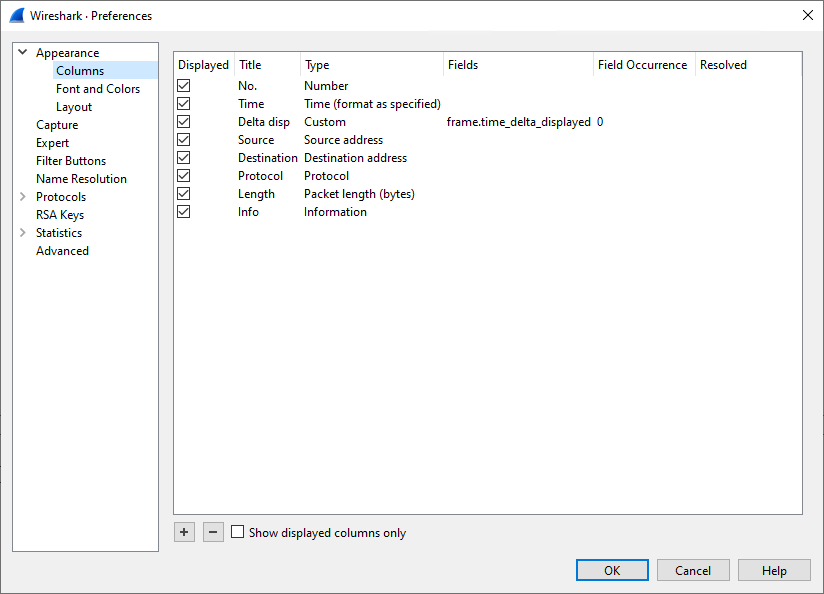
These preferences give you the option to control the definition of the columns shown in the packet list, once a capture file is loaded.
- Add new entry to the list.
- Remove the selected entry.
Selecting Show displayed columns only hides all non-displayed columns from the list, possibly making navigating the list easier.
The rows can be dragged and dropped to arrange them in the desired order.
The columns in the entries are as follows.
Selecting Displayed causes the column to be shown in the packet list.
The Title is the text shown in the header of the column in the packet list.
The Type is the type of value to be shown. This can be a predefined type, ie. a value in a defined format, or custom.
The following settings are applicable when the Type is set to "custom"
The Fields setting is the display filter name of the field to be shown in the column in the packet list.
The Field Occurrence setting is count of the given field in the frame, for fields that appear more than once in a frame.
Selecting Resolved causes name resolution to be applied to the field value, when available.
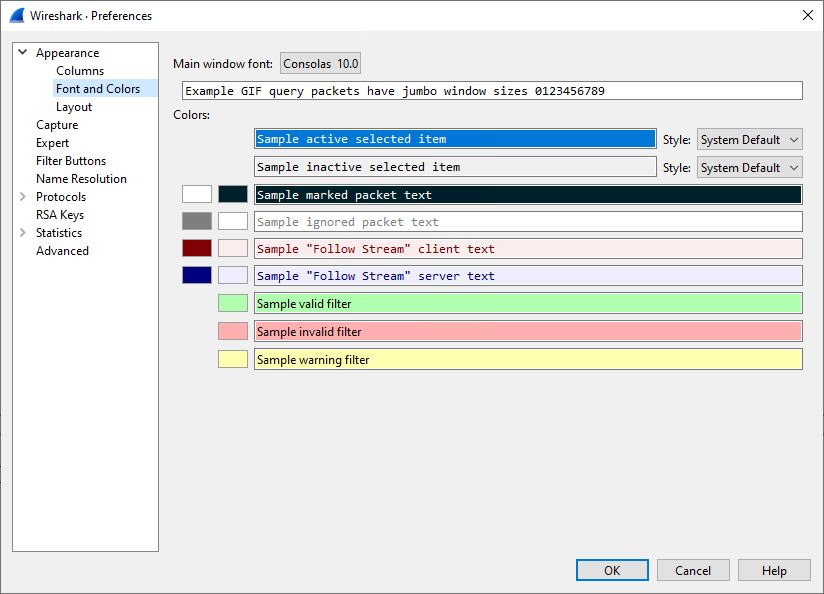
These preferences give you the option to select the font and colors used in the various packet panes. Most usable is to select a mono spaced font, which allows for a cleaner presentation, but using a proportional font is possible too.
These preferences allow you to define the layout of the GUI once a capture file is loaded.
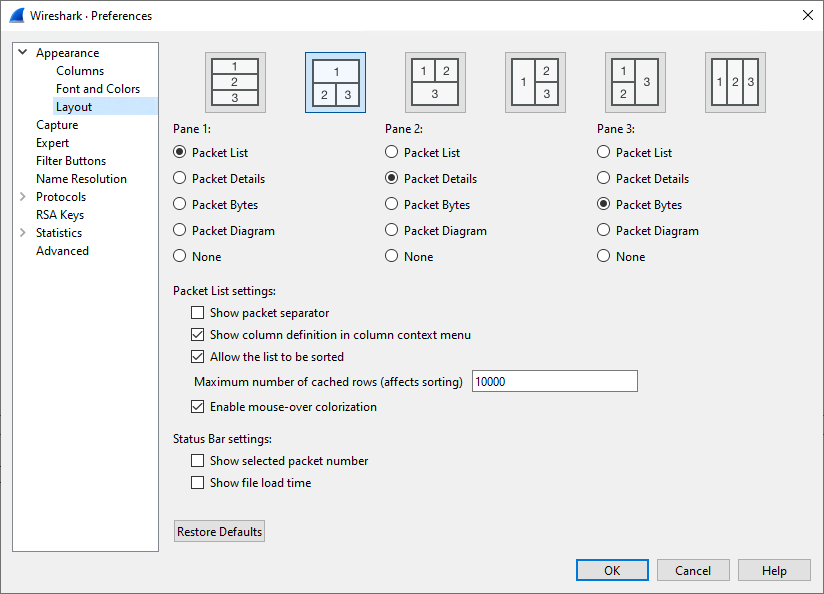
Make sure that you have at least one pane configured to contain the Packet list. Three panes can be active at the same time and they can be laid out as shown in the top layer. The exact sizes of these panes can be changed as needed once a capture file is opened.
Selecting Show packet list separator causes the packet list entries to be slightly set apart, which may improve readability at the cost of the amount of packets shown in the packet list.
Selecting Show column definition in column context menu make the column context menu wider to show the currently configured field type for the column. This may help identify the column to select or modify.
Selecting Allow the list to be sorted enables the sort operator on all the columns. This may prevent inadvertently triggering a sort, which may take considerable time for larger capture files.
The Maximum number of cached rows setting determines how much packet list information is cached to speed up sort operations, where a larger number causes more memory to be consumed by the cache. Be aware that changing other dissection settings may invalidate the cache content.
Selecting Enable mouse-over colorization enables the highlighting of the currently pointed to packet in the packet list. The currently selected packet is always highlighted.
Selecting Show selected packet number adds the selected packet number to the capture file details in the status bar, taking up some space in the status bar.
Selecting Show file load time adds the time it took to load the capture file to the status bar, taking up some space in the status bar.
These preferences allow you to set the default conditions for packet capture.
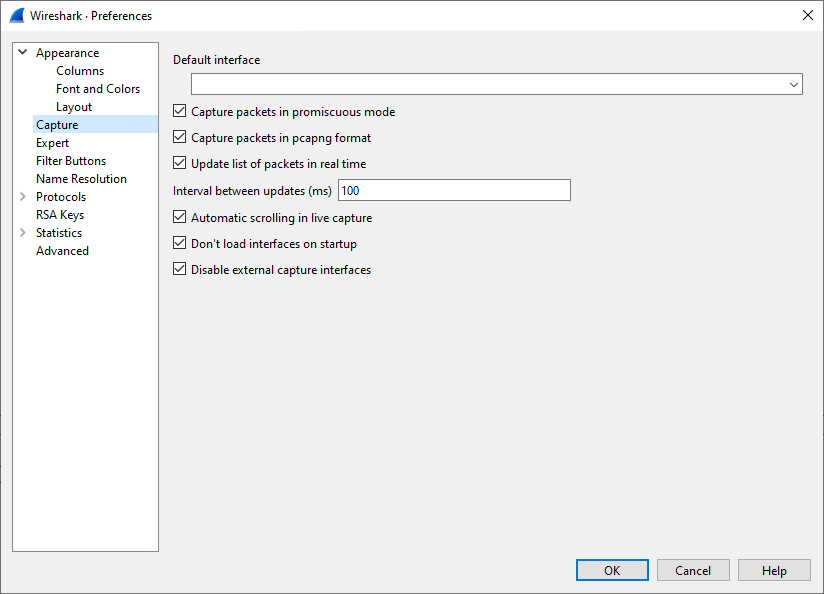
The default interface is the interface used for packet capture in case no other is selected on the opening page of GUI. Note that this can be multiple interfaces separated by a comma.
Selecting Capture packets in promiscuous mode causes the network interface(s) to capture on to be configured in promiscuous mode. This allows all (Ethernet) frames to be received by the network interface to be capture, not only those that are addressed to the capture interface.
Selecting Capture packets in pcapng format causes the Next-Generation packet capture file format to be used when capturing. This much more capable packet capture file format has many advantages over the original format, although not every external tool may be capable of handling packet captures in this format.
Selecting Update list of packets in real time causes the packet list to fill up and possibly scroll up during the packet capture process. This does give an insight in the packets captured, although it takes processing power to dissect the capture packets.
The preference Interval between updates (ms) allows you to configure how often the packet list is updated during the packet capture process. A higher interval reduces processing, but causes more delay between capture and display in the packet list.
Selecting Don’t load interfaces on startup prevents Wireshark from spawning dumpcap to populate the list of capture interfaces on the local system. This might be a time consuming operation delaying the start of the program, however on most systems this is not an issue. The interface list can always be populated after Wireshark is started via → .
Selecting Disable external capture interfaces prevents Wireshark from spawning extcap programs to list off their capture interfaces. This might be a time consuming operation delaying the start of the program, however on most systems this is not an issue.
These preferences allow you to modify the severity set for expert items.
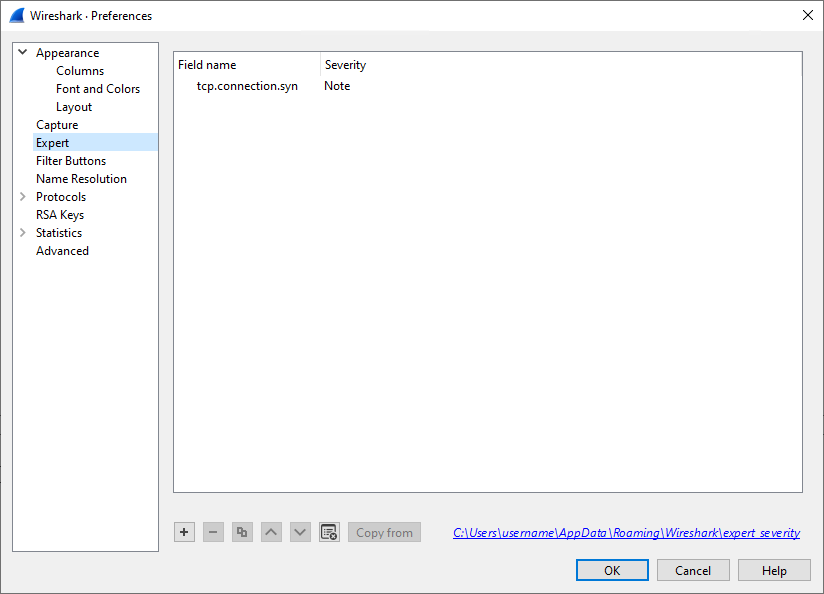
If, for whatever reason, you find that the severity for certain expert items does not match your needs you can change them here and have them used as such, showing up in the appropriate lists and overviews. Get the Field name from selecting the field in the packet details pane, then observe the name shown in the status bar. This is the name you enter on a new line in the list, while setting the desired Severity in the next column.
- Add new entry to the list.
- Remove the selected entry.
- Copy the selected entry.
- Move the selected entry up in the list.
- Move the selected entry down in the list.
- Clear the list of user specified expert item severities.
- Copy the list of user specified expert item severities from another profile.
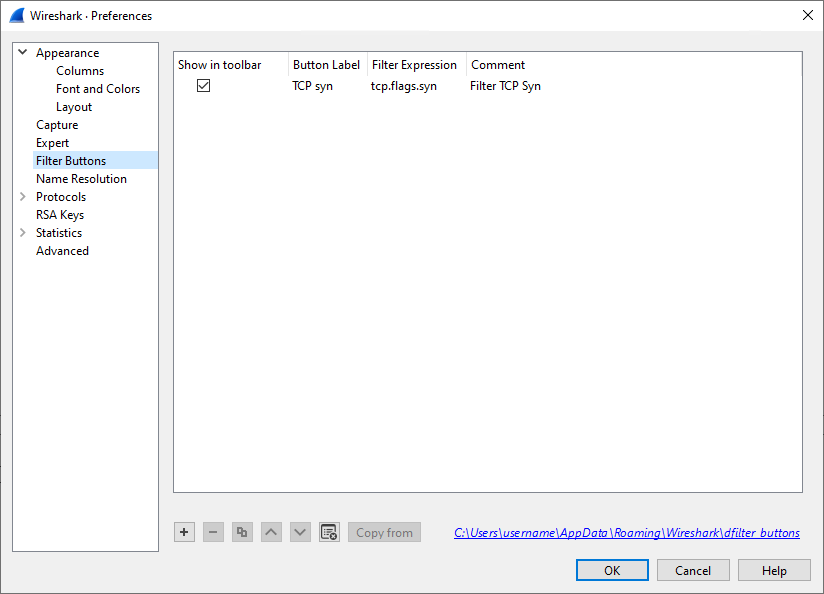
Having quick access to regularly used display filter expressions can be a real productivity boost. Here you can define your own display filter buttons.
- Add new entry to the list.
- Remove the selected entry.
- Copy the selected entry.
- Move the selected entry up in the list.
- Move the selected entry down in the list.
- Clear the list of user specified display filter buttons.
- Copy the list of user specified display filter buttons from another profile.
The columns in the entries are as follows.
Selecting Show in toolbar causes the button to be shown in the toolbar besides the display filter text entry.
The Button Label is the text shown on the button in the toolbar. The use of a double slash causes the button to create a dropdown list to allow grouping of multiple buttons, e.g. TCP//Syn and TCP//Res.
The Filter Expression is the display filter expression entered into the display filter text entry when the button is clicked.
The Comment is the comment text which appears in a bubble when the mouse hovers over the button.
These preferences allow you to configure which numeric identifiers in protocols are translated into human readable text. For some of these identifiers the readable texts are read from configurable external sources.
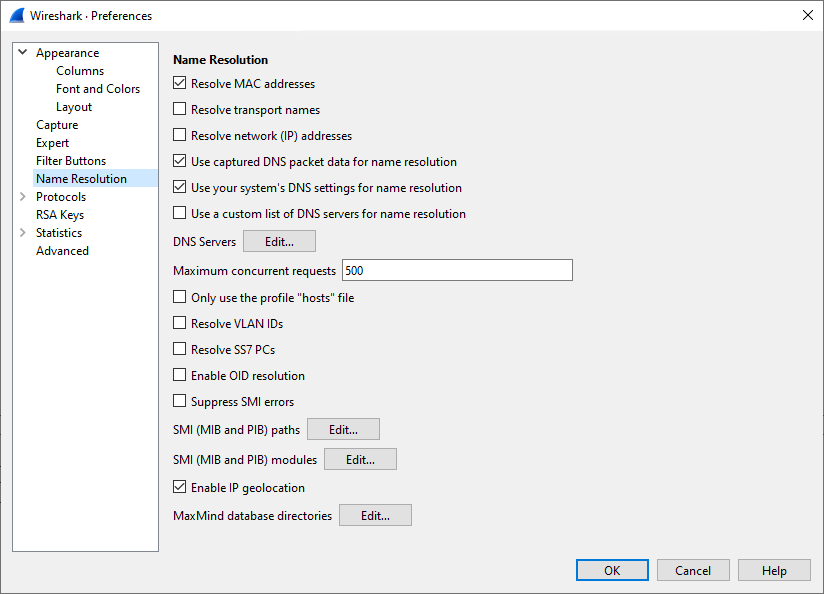
Selecting Resolve MAC addresses causes the OUI (Organizationally Unique Identifier) at the start of an Ethernet address to be translated into the name registered with the IEEE for that OUI.
Selecting Resolve transport names causes the UDP and TCP port numbers to be translated into the service registered to these ports by IANA.
Selecting Resolve network (IP) addresses causes IPv4, IPv6 and IPX addresses to be translated into their corresponding host name. To do this Wireshark reaches out to DNS servers to request names for addresses it finds in packets. There are several way to do this, which can be controlled through the following preferences.
Selecting Use captured DNS packet data for name resolution causes DNS response packets in the capture file to fill the network address resolution table. These can then be used to resolve addresses found in the packets.
Selecting Use your system’s DNS settings for name resolution causes DNS requests to be made as would be for other network applications.
Selecting Use a custom list of DNS servers for name resolution causes DNS requests to be made to manually configured DNS servers.
The DNS Servers button provides access to the dialog to manage these manually configured DNS servers.
The Maximum concurrent requests input field allows you to limit the amount of DNS queries made at the same time.
Selecting Resolve VLAN IDs causes the file "vlans" to be read and used to name VLANs. This file has the simple format of one line per VLAN, starting wit VLAN ID, a tab character, followed by the name of the VLAN.
Selecting Resolve SS7 PCs causes the file "ss7pcs" to be read and used to name SS7 Point Codes. This file has the simple format of one line per Point Code, starting with Network Indicator, a dash, the Point Code in decimal, a tab character, followed by the name of the Point Code.
Selecting Enable OID resolution causes the SMI library to be initialized. This library is capable of loading MIB/PIB files to provide name resolution for SMI objects, as present in SNMP packets.
Selecting Suppress SMI errors prevents the SMI library from emitting error messages while loading MIB/PIB files. The SMI library is very sensitive to irregularities in these files often resulting in harmless error being emitted.
The SMI (MIB and PIB) paths button provides access to the dialog to manage the directories where the MIB/PIB files to be loaded can be found.
The SMI (MIB and PIB) modules button provides access to the dialog to manage the MIB/PIB modules to be loaded.
The MaxMind database directories button provides access to the dialog to manage the directories where the MaxMind database files can be found. See Section 11.10, “MaxMind Database Paths”.
Wireshark supports quite a few protocols, which is reflected in the long list of child entries of the “Protocols” pane. You can jump to the preferences for a specific protocol by expanding “Protocols” and typing the first few letters of the protocol name.
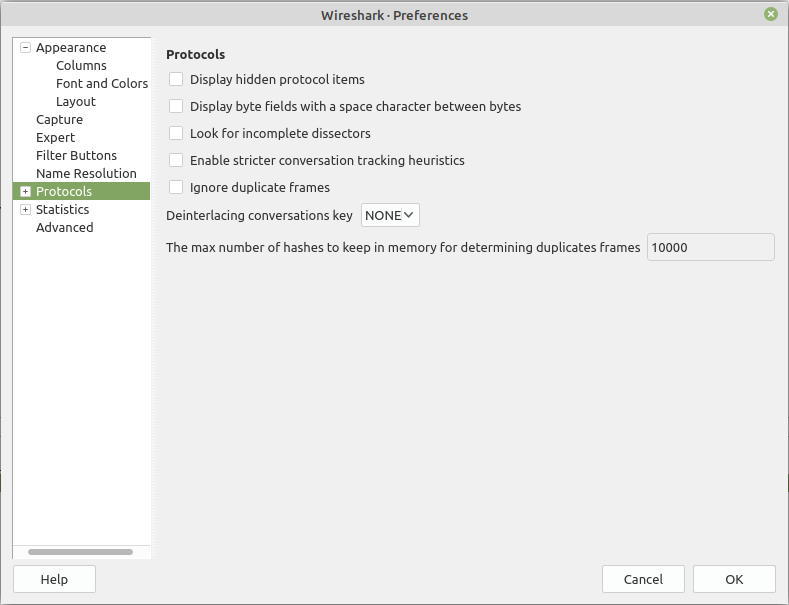
There are a few general protocol related preferences, listed below.
Selecting Display hidden protocol items influences what is shown in the packet details pane of the packet selected from the packet list. Some protocol dissectors add hidden protocol items that provide additional interpretations of the packet data, or with different display filter strings. These may or may not provide valuable information to the user and may clutter the output, therefor these items can be hidden.
Selecting Display byte fields with a space character between bytes influences the way a byte field in shown in the packet details pane of the packet selected in the packet list, if the dissector creates a byte field that is. The bytes in the byte field are normally shown as a concatenated sequence of hexadecimals. This preference allows you to get the representation of each byte separated by a space. This may improve readability of the individual bytes in the byte field.
Selecting Look for incomplete dissectors causes expert items to be added to the dissection of packet data for which the dissector does not create an interpretation. Dissectors should strive to not skip packet bytes and this preference allows you to be made aware of this.
Selecting Enable stricter conversation tracking heuristics allows dissectors to take more identifiers into consideration when creating "conversations". These are used to track related packets. The heuristics for these conversations are sensitive to mis-identification of packets, possibly corrupting conversation analysis. Adding more identifiers can reduce the change of this happening. Currently only the IPv4, ICMP and ICMPv6 dissector use this preference.
Selecting Ignore duplicate frames causes a duplicate frame to appear in the packet list, but flagged as ignored, hence not dissected. The determination of a duplicate frame is made based on the SHA256 hash of the bytes in the frame.
The preference Deinterlacing conversations key gives you options for deinterlacing the conversations. While NONE keeps the historical behaviour, the other options are built on three keys with the following meanings: V (VLAN), M (Mac Address), I (Interface). Packets which seem identical because they have the same payload but have a different value for their VLAN Tag, a MAC Address, or were captured on different interfaces, will then be part of different conversations if the respective deinterlacing key is activated.
The preference The max number of hashes to keep in memory for determining duplicate frames allows you to set how large the set of frames to consider for duplication is.
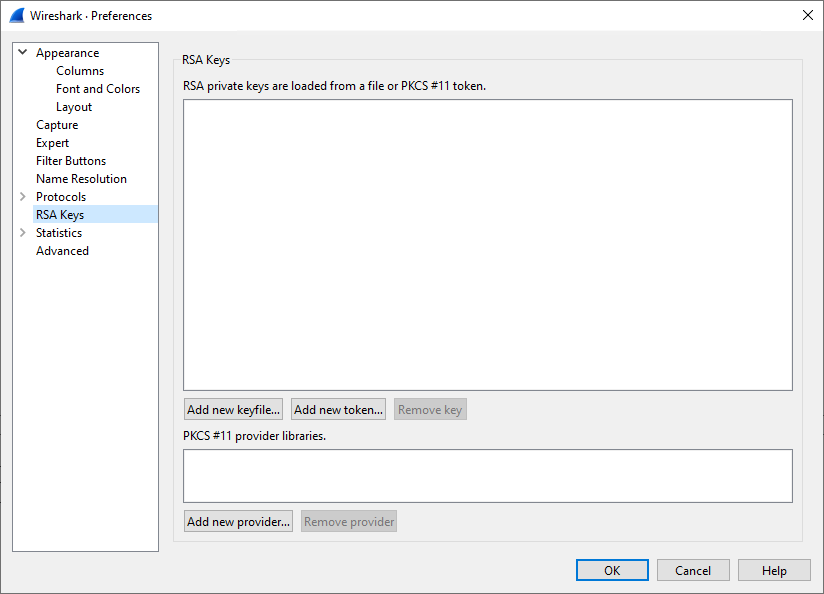
For more information see https://gitlab.com/wireshark/wireshark/-/wikis/TLS.
These preference have influence on the Statistics Tree (stats_tree) based dialogs accessible via the Statistics menu.
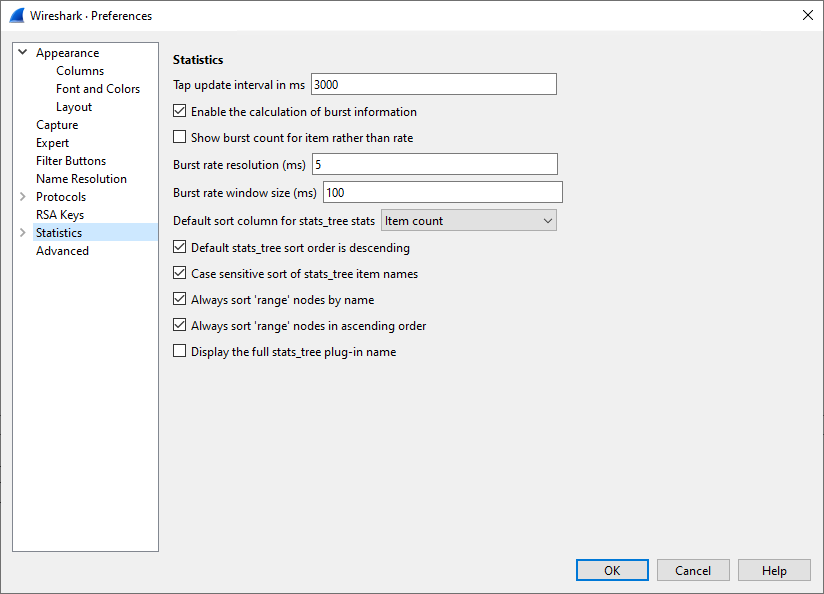
The preference Tap update interval in ms allows you to set how quickly protocol taps are being updated, partially determining the update speed of various dialogs and graphs.
Selecting Enable the calculation of burst information allows the Statistics Tree system to calculate burst information.
Selecting Show burst count for item rather than rate allows the statistics nodes to show the count of events within the burst window instead of a burst rate. Burst rate is calculated as number of events within burst window divided by the burst window length.
The preference Burst rate resolution (ms) sets the duration of the time interval into which events are grouped when calculating the burst rate. Setting a higher resolution (ie., a smaller number) increases processing overhead.
The preference Burst rate window size (ms) sets the duration of the sliding window during which the burst rate is measured. Longer window relative to burst rate resolution increases processing overhead. This value will be truncated to a multiple of the Burst rate resolution preference setting.
The preference Default sort column for stats_tree stats gives you to option to select one of the columns to sort on.
Selecting Default stats_tree sort order is descending causes a descending sort order based on the previously selected column.
Selecting Case sensitive sort of stats_tree item names causes a case sensitive sort based on the previous selected order and column.
Selecting Always sort 'range' nodes by name causes the sort to take place by name rather than values.
Selecting Always sort 'range' nodes in ascending order makes an exception for range nodes to the previously selected sort order.
Selecting Display the full stats_tree plug-in name causes the full menu path of the Statistics Tree plugin to be shown in the title.
The “Advanced” pane will let you view and edit all of Wireshark’s preferences, similar to about:config and chrome:flags in the Firefox and Chrome web browsers.
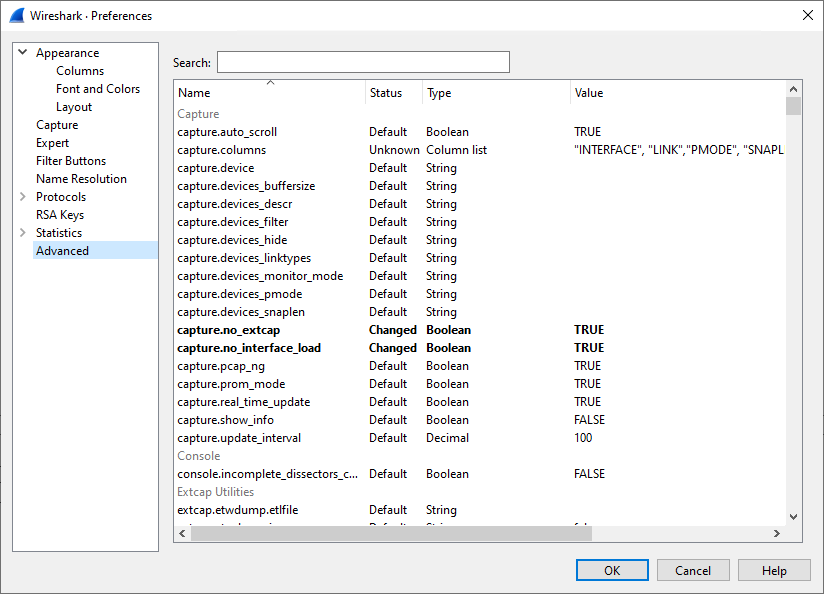
You can search for a preference by typing text into the “Search” entry. You can also pass preference names to Wireshark and TShark on the command line. For example, the gui.prepend_window_title can be used to differentiate between different instances of Wireshark on your screen:
$ wireshark -o "gui.prepend_window_title:LAN" &
$ wireshark -o "gui.prepend_window_title:External Network" &